Small Retailer


Analytics Built for Mall Decision-Makers
Understand asset direction, investment impact, and tenant environment - without building an analytics team.
A standard set of reports designed for:
- Asset owners
- Operators
- Leasing teams
What Analytics is for
Assess Asset Health
Track overall direction and stability across months and years.
Justify Investments
Understand the impact of refurbishments, anchors, and changes.
Align Stakeholders
Support owners, operators, and tenants with the same view.
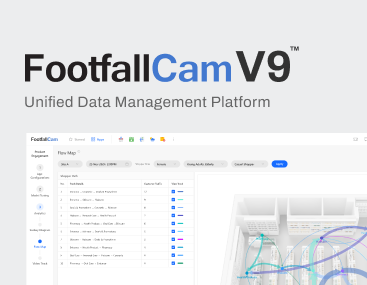
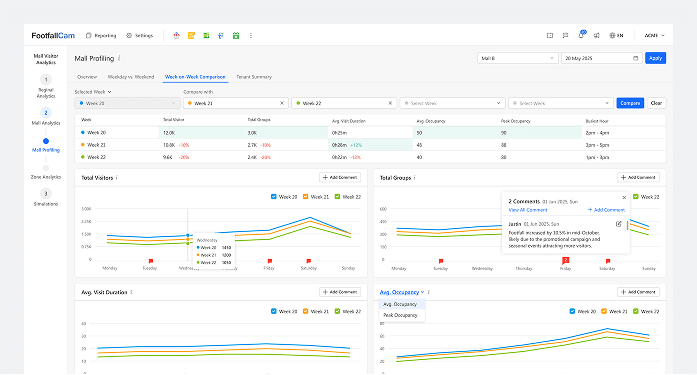
A Standard Set of Mall Analytics Reports
Unlike custom dashboards that vary by site and user, FootfallCam analytics is based on a standardised set of mall-specific reports, refined across real shopping mall deployments.
Each report answers a clear commercial question.
Asset Performance Overview
“Is the mall getting stronger or weaker over time?”
A high-level footfall overview showing:
- long-term footfall direction
- seasonal context
- year-on-year comparison
Used by asset owners and senior management to track portfolio stability and trajectory.

Zone and Wing Performance
Which parts of the mall are structurally strong?
Normalised zone analytics that reveal:
- consistently strong and weak areas
- hot zones and cold zones
- impact of layout, circulation, and anchors
Supports investment prioritisation, layout changes, and leasing strategy.
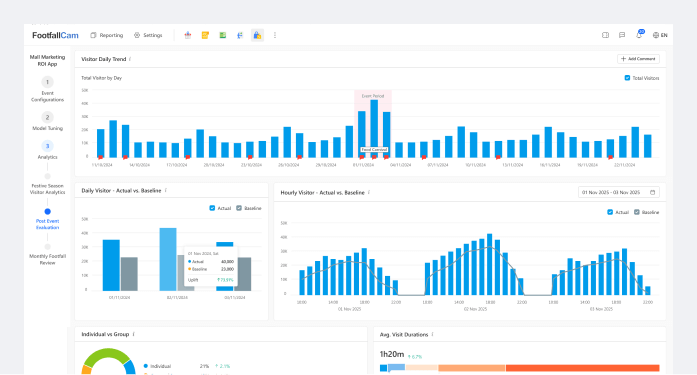
Event and Campaign Impact
Did this initiative change behaviour?
Clear before-and-after comparisons showing:
- baseline vs uplift
- localised vs mall-wide impact
- duration of effect
Allows teams to repeat what works and stop guessing.
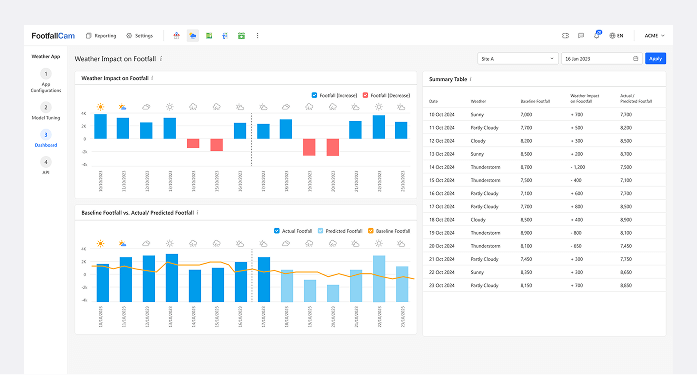
Seasonality and External Context
Is this an internal issue or a market effect?
Contextual analytics that separate:
- seasonal patterns
- weather and calendar effects
- long-term structural change
Protects teams from false conclusions and supports credible investor and lender communication.
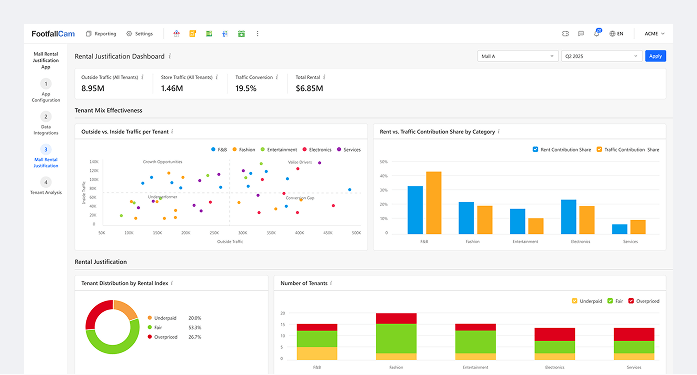
Tenant Environment Visibility
Are tenants operating in a fair environment?
Zone-level visibility that:
- provides location context
- explains adjacency effects
- focuses on stability, not blame
Enables constructive leasing conversations based on shared evidence.
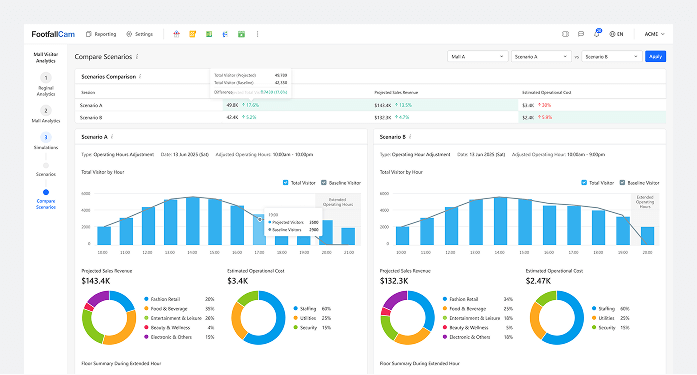
Investment Review
Did our major investment deliver results?
Before-and-after analysis showing:
- changes in movement patterns
- redistribution vs real growth
- time to stabilisation
Supports capital review, post-investment assessment, and future planning.
Designed for Shared Understanding
Owner
Portfolio direction, investment justification, board reporting.
Operators
Identify pressure zones, prioritise interventions, track results over time.
Leasing Teams
Fair tenant discussions, location context, evidence-based decisions.
Designed to support decisions, not overwhelm teams
No training sessions · No dashboards to build · No maintenance burden