Small Retailer


Designed for Real Coverage
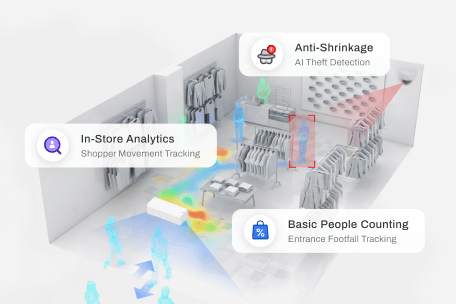
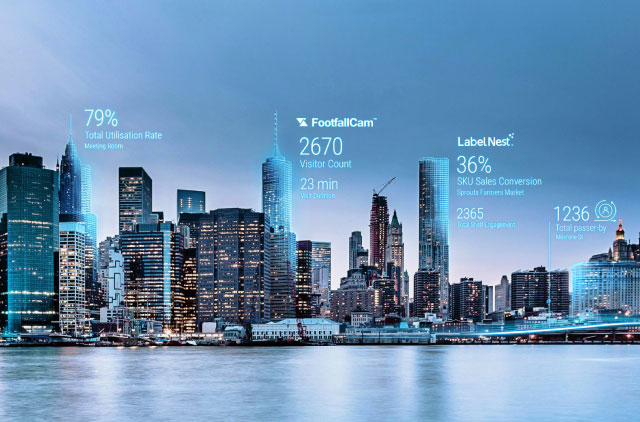
In large stores and malls, full coverage is rarely practical. Centroid combines multiple data sources to produce stable, usable metrics across the space with defined confidence levels and validation methods.
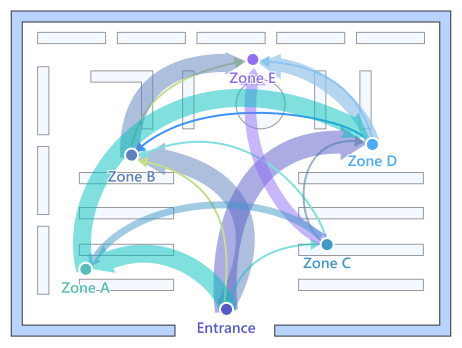
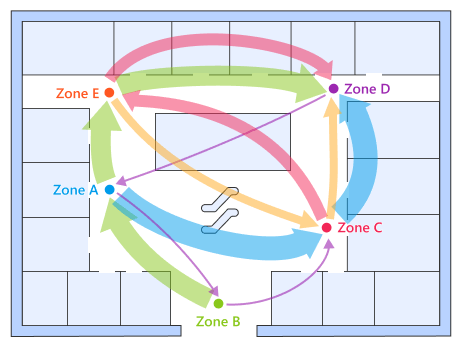
Measure how people move across entrances, zones, and departments including directional flow and transitions between key areas.
What You Get
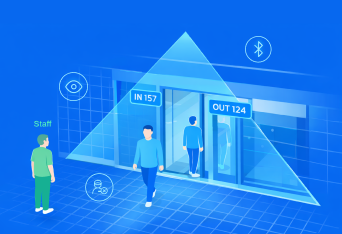
- Footfall between zones
- Entry → zone → exit flow
- Directional movement patterns
- Zone-to-zone conversion rates
Works Even When
- Coverage is partial across zones
- Paths are not continuously tracked
How It’s Derived
- Aggregated transitions from multiple sensors
- Flow reconstruction (not individual tracking)
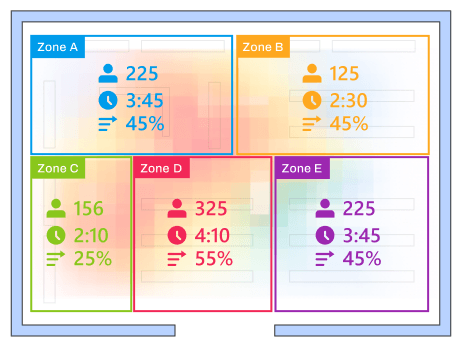
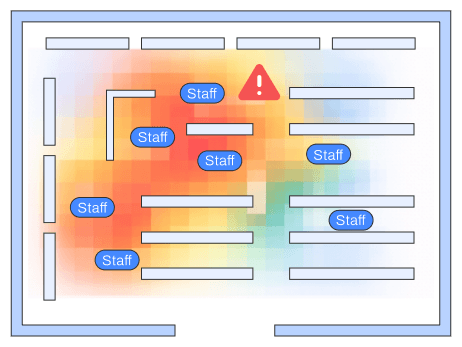
Understand how each area performs even when not every square meter is covered.
What You Get
- Zone footfall
- Dwell time (average / distribution)
- Engagement rate (visits vs pass-through)
- Hotspot / cold zone identification
Works Even When
- Coverage is uneven
- Some zones rely on inferred data
How It’s Derived
- Direct counts where available
- Interpolation + statistical modelling between zones
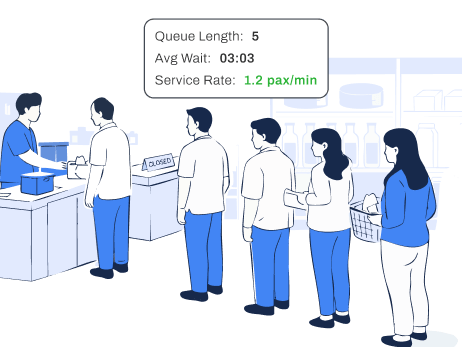
Monitor queues and service performance across dynamic service areas.
What You Get
- Average wait time
- Service rate (customers served per hour)
- Queue formation patterns
Works Even When
- Queue shapes change
- Queue shapes change
- Not all queue areas are fully covered
How It’s Derived
- Density + movement velocity
- Entry/exit rate modelling
Identify where operations break down by linking customer movement with service capacity.
What You Get
- Congestion points
- Zone overload vs underutilisation
- Staff vs customer imbalance (if enabled)
- Service delay indicators
Works Even When
- Staff tracking is partial or estimated
- Coverage varies across departments
How It’s Derived
- Correlation of flow, dwell, and queue metrics
- Cross-zone imbalance detection
Reconstruct how people move across the space linking fragmented observations into continuous journeys, even when coverage is incomplete.
What You Get
- End-to-end journey estimation
- Cross-zone transition continuity
- Reduced drop-off between observed areas
- More accurate zone-to-zone conversion
Works Even When
- Coverage is not continuous across the floor
- Movement paths are partially observed
- Large areas contain blind spots between sensors
How It’s Derived
- Linking observations across multiple detection points
- Continuity modelling between gaps
- Probability-based reconstruction of movement paths
Extend beyond standard reporting where needed.
What You Get
- Custom-defined KPIs
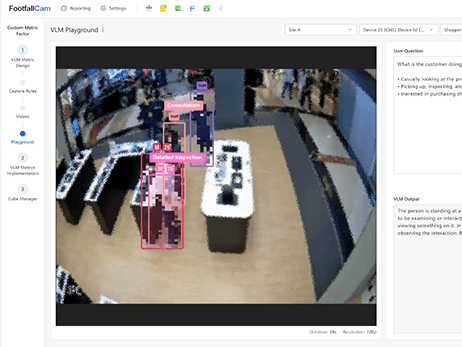
- Behavioural segmentation (via VLM where applicable)
- Campaign / display effectiveness
- Integration with external data (POS, WiFi, etc.)
Works Even When
- Product interaction zones
- Campaign uplift measurement
- Category-level engagement
Confidence & Coverage Layer
Every metric includes coverage and confidence indicators so you understand what is directly measured and what is inferred.
- Coverage map (by zone)
- Confidence score per metric
- Method transparency (measured vs inferred)