
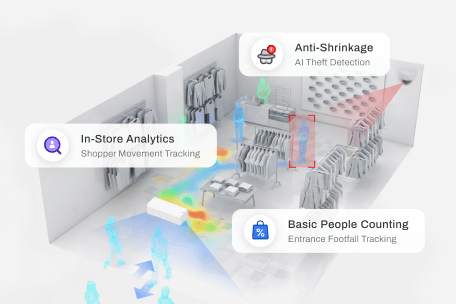
Small Retailer


Make Every Aisle Count
Every aisle attracts traffic, but not all convert into sales. We measure aisle-level engagement and conversion, helping retailers identify underperforming zones and optimise layout, merchandising, and product placement to maximise revenue per space.
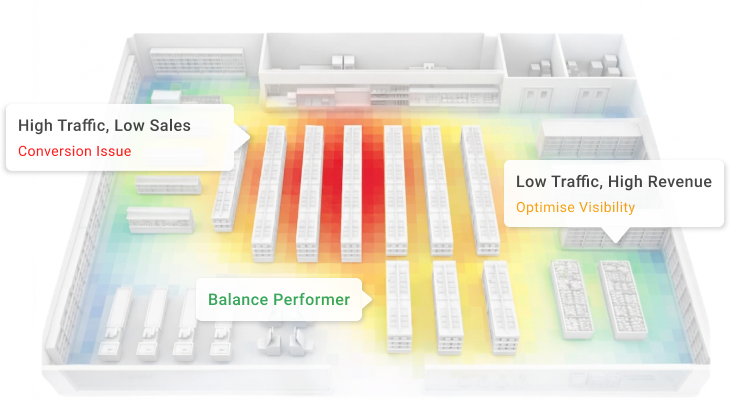
Measure Contribution
View each aisle by its contribution to total sales, not just activity levels. This highlights which areas drive revenue and which underperform, enabling more informed decisions to improve overall store productivity.
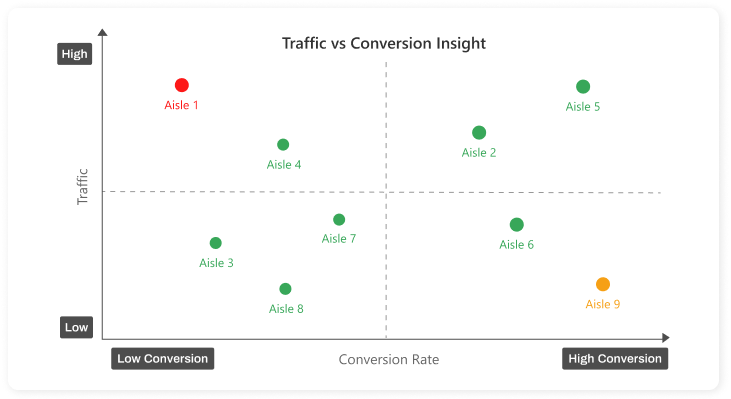
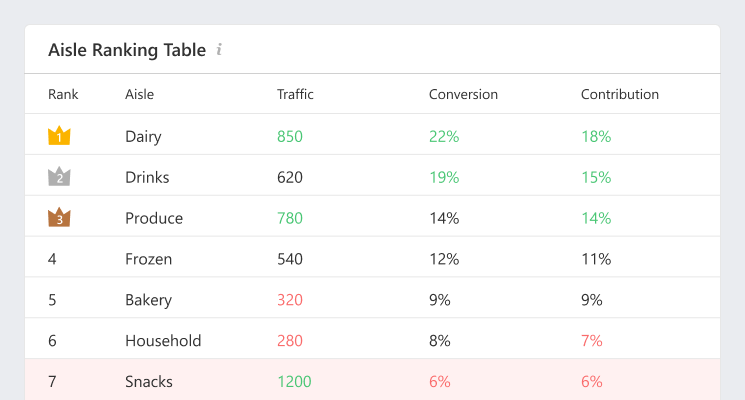
Traffic vs Conversion
High footfall does not guarantee sales. Separating traffic from conversion reveals where shoppers pass through without purchasing, helping identify missed opportunities and refine merchandising strategies to improve performance.
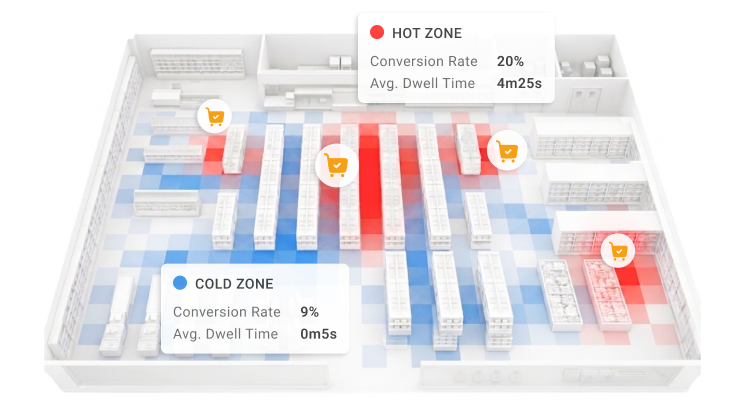
Hot and Cold Zones
Identify where shoppers actively purchase versus where they only pass through. This distinction highlights effective and underperforming zones, guiding improvements in product placement, layout, and overall merchandising strategy.
Benchmark Stores
Compare the same aisle across multiple store locations. Understand how layout, local demographics, and execution influence conversion performance, enabling best practices to be identified, replicated, and scaled across the network.
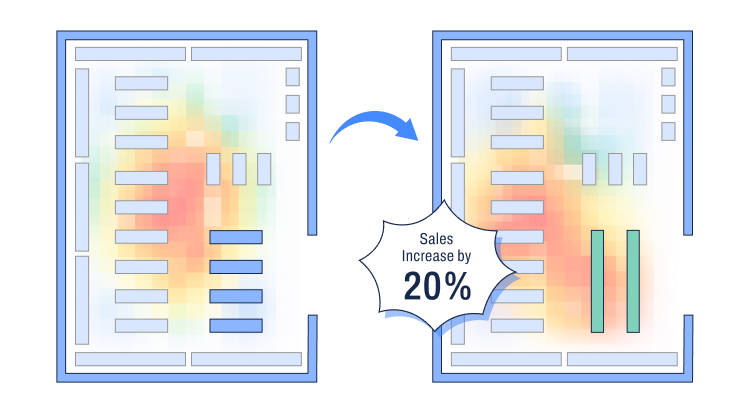
Track Impact
Measure the impact of layout changes, promotions, and category placement over time. Validate what improves conversion and standardise successful strategies across stores to drive consistent and measurable performance improvements.
The Conversion Gap in Aisles
Problem
High Traffic Doesn’t Guarantee Performance
High-traffic areas often underperform due to ineffective merchandising and layout decisions. This creates hidden inefficiencies where valuable space fails to generate proportional revenue.
Solution
Uncover Missed Sales Opportunities
Traditional reports show outcomes, while aisle-level analytics reveals where traffic fails to convert. This enables targeted improvements in merchandising, layout, and product placement to increase revenue per space.
Case Study
Underperforming aisle recovered
Layout impact validated
Cross-store consistency achieved
Underperforming aisle recovered
Case Study 1
Underperforming aisle recovered
Store size
8,500 sq ft supermarket, mall-based, mixed grocery and impulse categories
Performance issue
Snack aisle recorded the highest traffic in store but contributed disproportionately low sales. Management assumed strong performance due to constant shopper activity.
Deployment scope
Aisle analytics deployed using existing CCTV coverage. Traffic, dwell time, and POS data linked to measure conversion performance at zone level.
Measured improvement
Snack aisle conversion increased from 6.8% to 12.5% after layout and product repositioning. Sales contribution improved by 28%, with clearer visibility on high-performing SKUs.
Layout impact validated
Case Study 2
Layout impact validated
Store size
12,000 sq ft supermarket, suburban location, weekly promotional cycles
Loss issue
Frequent layout changes were implemented, but impact on sales remained unclear. Decisions were based on intuition rather than measurable performance.
Deployment scope
Zone-based conversion tracking implemented across key aisles. Before-and-after comparisons established for each layout change, linked with POS sales data.
Measured improvement
High-margin categories relocated to stronger conversion zones achieved a 19% uplift in sales. Ineffective promotional placements were identified and discontinued within one cycle.
Cross-store consistency achieved
Case Study 3
Cross-store consistency achieved
Store size
Multi-branch supermarket chain, 15 stores, 6,000–10,000 sq ft per location
Loss issue
Significant variation in category performance across stores. Identical product ranges delivered inconsistent sales outcomes with no clear explanation.
Deployment scope
Aisle conversion benchmarking introduced across all stores. Standardised metrics enabled comparison of traffic, dwell, and conversion for identical zones.
Measured improvement
Top-performing layouts identified and replicated across stores, improving average category conversion by 14%. Underperforming layouts were phased out, reducing performance variability across the network.
FAQs
Learn More