


Modern airports seek to optimise commercial revenues while improving passenger experiences. Understanding how passengers move within departure lounges—especially in retail, F&B, and VIP zones—is central to this goal.
Traditional CCTV and Wi-Fi analytics provide partial coverage or coarse data. Bluetooth Low Energy (BLE) offers a cost-effective and scalable method for passive, anonymous re-identification and journey reconstruction—when combined with visual verification and advanced fusion techniques.
This document explains, in precise technical terms, how FootfallCam leverages continuous BLE coverage and AI-based fusion to provide reliable, flight-level movement analytics without depending on any personal data.
The Technical Basis of BLE Tracking
BLE Advertising and MAC Randomisation
Modern BLE-enabled devices (smartphones, wearables, etc.) broadcast advertising packets on 3 channels (37, 38, 39) at customisable intervals (typically 20ms–1s). Each packet includes:
- A randomised MAC address
- Optional payload (often empty or application-defined)
- TX power level (often fixed)
To preserve privacy, Android and iOS both implement MAC address randomisation, typically rotating every 15 minutes under default system settings.
Key Insight:
The 15-minute rotation window is sufficient for re-identification over short-to-mid-range sessions such as time spent in departure lounges (30–90 min). Many BLE devices exhibit recognisable behaviour over these sessions, including:
- Consistent signal patterns (RSSI profile)
- Sudden disappearance/reappearance correlations
- Unique transmission frequencies or idle durations
Continuous Coverage in Large Spaces
Assuming a BLE reader with a 15m effective radius, a 30m diameter cell can be deployed. Overlapping coverage is necessary to ensure smooth handover. With a mesh deployment of BLE gateways, full coverage of lounge zones is viable.
If we define:
A = area of the lounge (e.g. 10,000 m²)
r = coverage radius per node (15 m)
N ≈ A / (πr²) = approximate number of nodes for full coverage
Then, approximately 14–16 BLE gateways would suffice for a 10,000 m² open lounge.
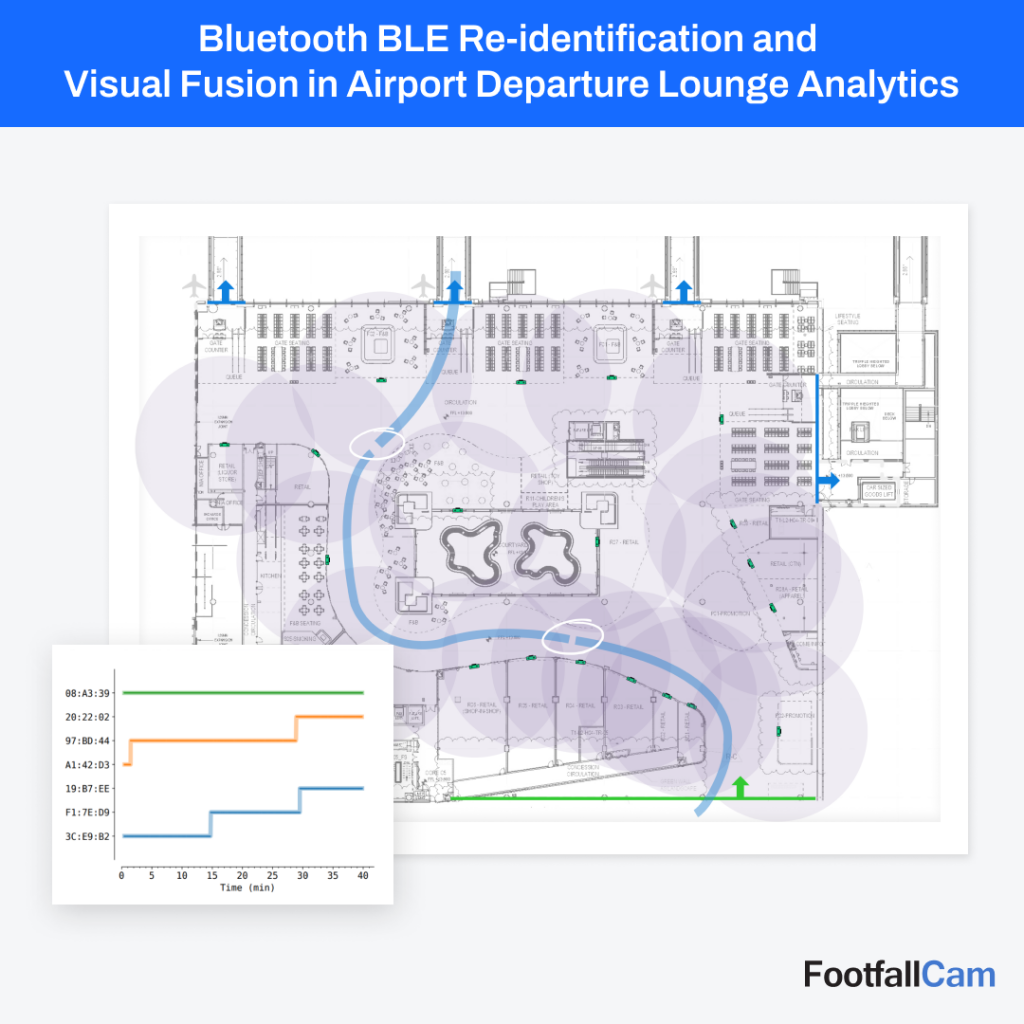
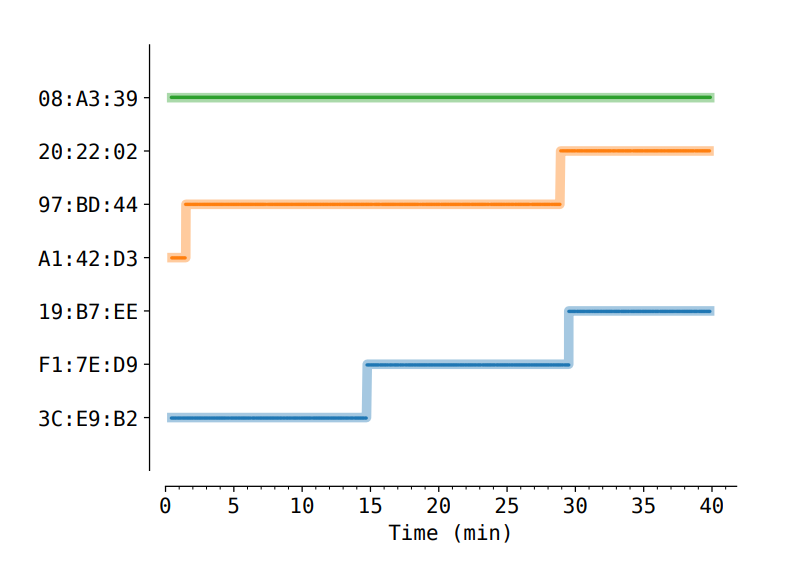
Re-identification via RSSI Reappearance Heuristic
A peer-reviewed approach shows the feasibility of tracking randomised MACs via correlation of:
- Disappearance timing t₁ of MAC A
- Appearance timing t₂ of MAC B
- RSSI consistency ΔRSSI ≤ ϵ across adjacent readers
- Spatial overlap across adjacent nodes
A pairing score S can be defined as:
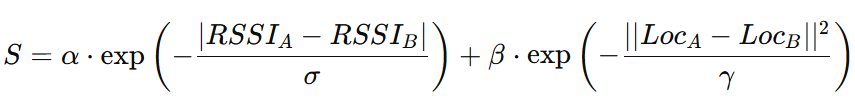
Where:
-
α, β are weighting coefficients
-
σ, γ are decay parameters
-
Loc refers to the physical BLE reader’s location
If S > θ, the two MACs are considered the same entity re-randomised.
Enhancing BLE Tracking with Visual Ground Truth
Role of Visual Analytics
Cameras placed at chokepoints (e.g. shop entrances, corridor transitions, gate access) are used to:
- Count individuals passing specific thresholds (ground truth)
- Capture physical attributes (clothing color, gait, group association)
- Generate anonymous path snapshots
This creates a complementary dataset that can be temporally aligned with BLE tracking for accuracy validation.
Fusion Approach
Each BLE-tracked path is aligned with the nearest visual-detected path based on:
- Timestamp proximity Δt < 2 seconds
- Movement vector similarity
- Dwell zone overlap
This hybrid method allows:
- BLE-only paths to be sanity-checked against known ground-truth flow
- Visual detections to confirm BLE device presence and distinguish individuals in proximity
- Correction of BLE dropout zones or ambiguous MAC pairings
Journey Reconstruction and Behavioural Aggregation
Individual Path Tracking
For each re-identified BLE entity, we construct a sequential record:
| Device ID | Time | Zone Entered | Dwell Time | Exit Time |
| 0xA17B… | 09:10 | Restaurant A | 12 min | 09:22 |
| 0xA17B… | 09:23 | Retail B | 5 min | 09:28 |
| 0xA17B… | 09:29 | VIP Lounge | 22 min | 09:51 |
This data can be visualised using a Sankey diagram, Gantt timeline, or path overlay on floor plans.
Grouping by Flight
Passengers heading to the same gate (e.g. Gate C6, flight EY025 to Abu Dhabi) are grouped by:
- Final detected zone (boarding area)
- Time window of boarding (e.g. 09:45–10:05)
- BLE device movement convergence
Once grouped, aggregate behaviours are derived:
| Metric | Value |
| Avg time in retail | 7.4 min |
| Avg time in F&B | 12.6 min |
| % visited Duty Free | 72% |
| Avg time at gate before boarding | 18.2 min |
This provides actionable intelligence for commercial planning.
Accuracy and Limitations
Accuracy Expectations
Under controlled deployments with overlapping BLE coverage and adequate visual checkpoints:
- BLE-only journey stitching: ~70–80% reliability
- Fusion-enhanced BLE pathing: ~85–90% journey coverage accuracy
- Zone-level dwell estimation: ±10s average temporal deviation
The largest factors influencing accuracy include:
- BLE device broadcast intervals
- Crowded zones with high device density
- Blind spots without overlapping readers
Visual alignment mitigates many of these weaknesses.
Limitations
- Cannot uniquely identify individuals; anonymous only
- BLE must be active (some users disable it)
- No guarantee that all travelers carry BLE devices
- Randomisation frequency varies across OS versions
Despite these, at a population level (100–500 concurrent devices), aggregate patterns remain statistically significant.
Practical Implementation Guidelines
| Task | Recommended Practice |
| BLE reader placement | 15m grid, <10m mounting height |
| Visual camera placement | Entrances, corridors, major commercial touchpoints |
| Data retention | Anonymous; store only pseudonymised path IDs |
| MAC re-identification | Use time-RSSI fusion with path continuity heuristics |
| Fusion pipeline | BLE → Preprocessed tracks → Align to visual ground truth |
| Output format | Table (CSV), Floorplan heatmaps, Flight-level dashboards |
Use Cases for Airport Operators
| Use Case | Benefit |
| Flight-level shopper profiling | Tailor ads and promotions by nationality/time slot |
| Zone popularity analysis | Optimise retail layouts and lease pricing |
| Queue bypass behaviour | Detect early gate rush or missed signage |
| VIP lounge utilisation | Understand dwell and dwell segmentation |
| Retail conversion insight | What % of a flight’s passengers entered Store X |
Future Development Roadmap
MAC Persistence Modeling
Investigating ML models (e.g., LSTM) to track “soft fingerprints” across randomised MACs, beyond just RSSI time-proximity.
Multi-modal Identity Matching
Extending to Wi-Fi, UWB, or device charging logs as auxiliary hints, where privacy policies allow.
Integration with Retail POS
(Optional and privacy-compliant) – Correlating foot traffic with purchase data, enabling full funnel conversion insight.
Summary
BLE tracking, despite its anonymity and randomisation, can be a powerful tool when combined with visual analytics. With adequate coverage, temporal granularity, and fusion alignment, airport operators can gain deep insights into how passenger cohorts behave by flight. This enables targeted operational improvements and commercial uplift, while remaining compliant with data privacy regulations.
#SmartAirports #OccupancyAnalytics #AirportTech #BLEReidentification #AirportAnalytics