Small Retailer


What Analytics Provides
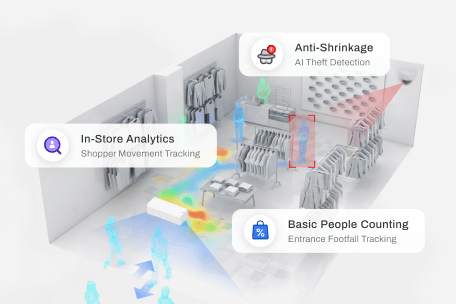
FootfallCam Analytics converts occupancy and movement data into clear usage reports for universities. The platform brings together data from building entrances, teaching spaces, libraries, laboratories, washrooms, and shared facilities into one reporting environment.
Who Uses This
Estates and Facilities
Review building usage and optimise space utilisation.
Timetabling Teams
Compare scheduled teaching activity with actual space usage.
Library Managers
Monitor study space demand, peak periods, and occupancy trends.
Campus Operations
Plan resources around actual usage patterns across buildings and facilities.
Senior Management
Review campus-wide utilisation and support strategic decisions.
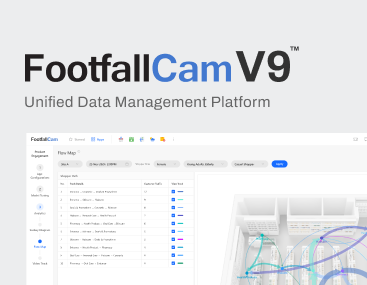
Analytics Layer
The analytics layer sits above the counting devices and sensors. It collects usage data, organises it by building, room, facility, and time period, then presents the results through dashboards and scheduled reports.
Universities can review usage at different levels:
- Campus level
- Building level
- Room level
- Facility level
- Session level
- Term level
This allows different teams to work from the same data, without creating separate reporting processes.
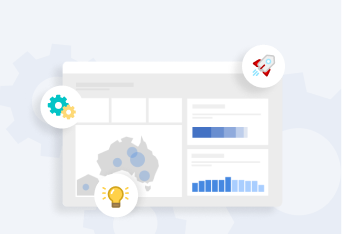
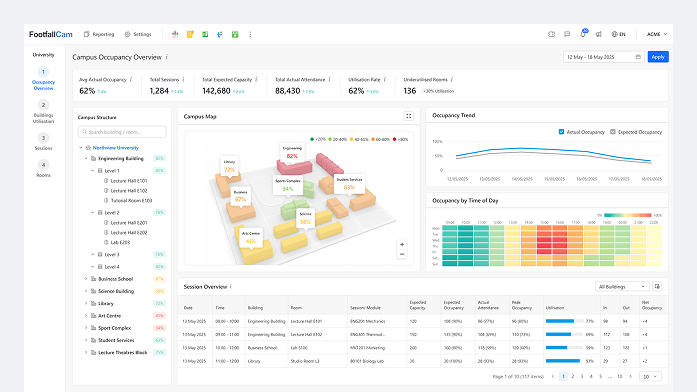
Campus Occupancy Overview
The campus overview provides a high-level view of usage across multiple buildings and facilities.
It shows:
- Total daily footfall
- Building usage trends
- Peak periods
- Occupancy levels
- Usage by building
- Month-on-month comparison
This view is designed for estates, facilities, and senior management teams that need a clear picture of campus activity across time.
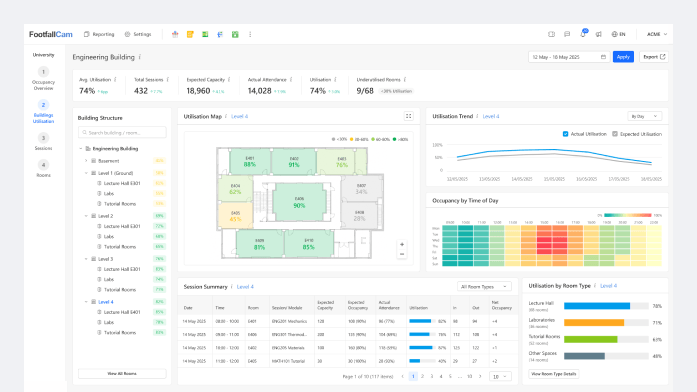
Building Utilisation
The building usage dashboard shows how each building is used through its entrances and access points.
It helps universities compare:
- Busy and quiet buildings
- Weekday and weekend usage
- Peak arrival periods
- Long-term usage trends
- Building-to-building performance
This is the most practical analytics view for campus estate planning. It provides a simple baseline before more detailed room-level measurement is required.
Sessions Analytics
Teaching space analytics compares scheduled teaching activity with actual room usage.
It can show:
- Scheduled capacity
- Actual attendance
- Average occupancy and peak occupancy
- Room capacity
- Underused sessions and over-capacity sessions
- Term-based attendance patterns
This helps timetabling and academic planning teams understand how lecture halls, tutorial rooms, and laboratories are used in practice.
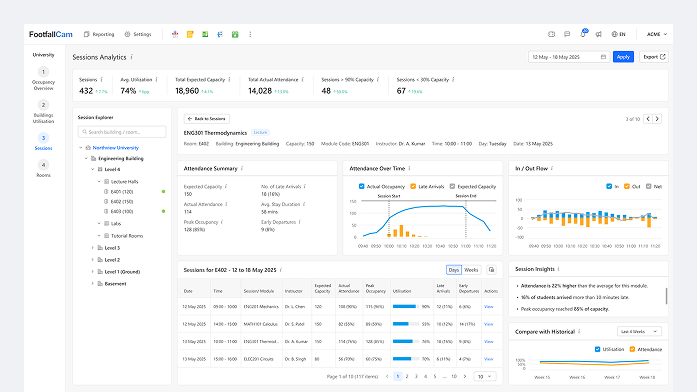
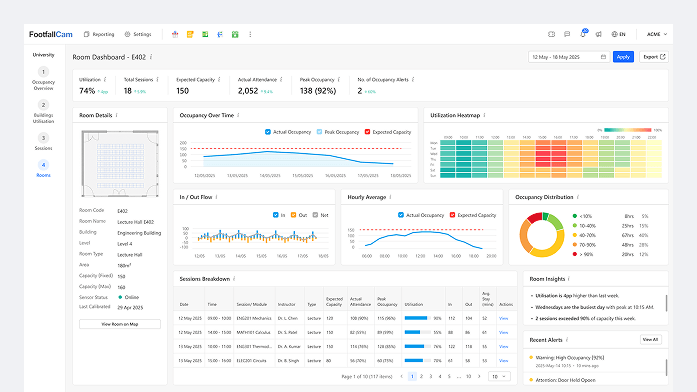
Room Usage
For teaching spaces, the system can compare timetable data with actual occupancy.
Example comparison:
- Scheduled session: 10:00–11:00
- Planned capacity: 180 students
- Actual peak attendance: 126
- Average attendance: 104
- Room capacity: 250
This gives universities a factual view of teaching space usage without relying only on booking data or manual surveys.
Designed for University Review
University analytics must be clear, consistent, and explainable.
FootfallCam Analytics is designed around:
Defined metrics
Comparable reporting periods
Building and room grouping
Term-based analysis
Exportable datasets
Historical trend review
The platform focuses on occupancy and utilisation data. It does not require demographic analysis or behavioural profiling.
Standard Metrics
FootfallCam uses defined metrics so data can be compared consistently across buildings, rooms, and time periods.
Daily footfall
Teaching Space Analytics
Peak occupancy
Utilisation rate
Idle periods
Scheduled versus actual usage
Session attendance
Room capacity usage
Facility usage count
Forecasted demand
How it Works
Stage 1
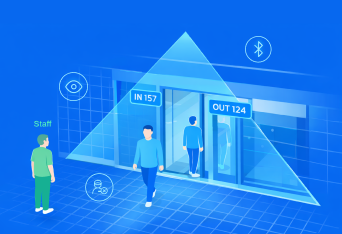
Count
FootfallCam devices measure entries, exits, and occupancy.
Stage 2
Organise
Data is grouped by building, room, facility, and time period.
Stage 3
Compare
Usage is compared across buildings, spaces, sessions, and academic periods.
Stage 4
Report
Dashboards and scheduled reports present the data in a structured format.
Stage 5
Forecast
Historical usage and timetable data can be used to estimate future demand.
Explore Further
Building Usage
Measure building-level footfall, peak periods, and campus usage trends.
Teaching Space Analytics
Compare schedules with actual usage in lecture halls, tutorial rooms, and labs.
Deployment Approach
See how universities can start with one building and expand across campus.