


Small Retailer


Border Control
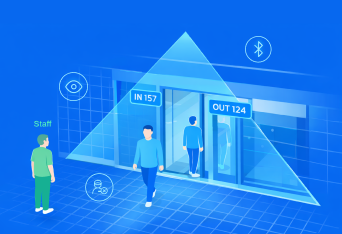
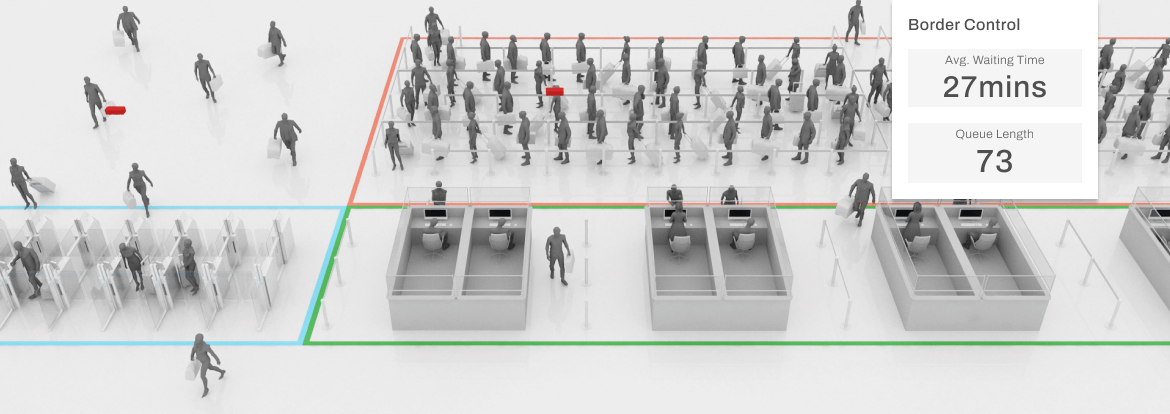
Immigration is a critical stabiliser in the curb-to-gate journey. A predictable, well-managed border control process protects passenger buffer time, reduces downstream congestion, and supports smoother airside operations. The challenge, however, lies not in hardware or staffing alone, it is the variability: sudden inbound surges, uneven lane productivity, fluctuating E-gate performance, and queues that behave differently at high load.
FootfallCam provides a unified operational view purpose-built for immigration teams. Every queue, counter, and E-gate is measured with minute-by-minute accuracy to reveal flow rates, cycle times, and stability across the zone. Designed for high-density environments, the system integrates seamlessly with existing infrastructure and delivers clear, real-time visibility that supports staffing decisions, peak management, and SLA compliance. This ensures a more reliable, consistent, and accountable immigration experience for all passengers.
Watch Video
The Dashboard for Immigration Authority
Immigration Performance Dashboard
Live Operations
Lane Regulation
Counter Performance
Immigration Performance Dashboard
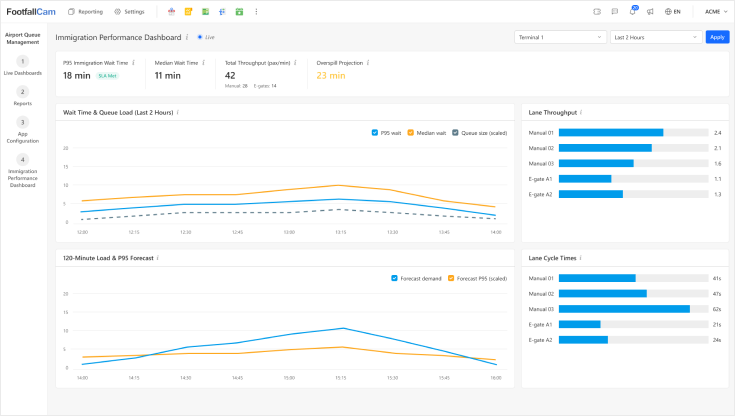
Immigration Performance Dashboard
Immigration teams need one thing: a live, unified operational truth. This dashboard consolidates queue length, P95 wait time, E-gate throughput, manual booth performance, and overspill alerts into a single real-time view. Every widget is designed to support fast, informed decisions, especially during peak-load periods.
Live Operations
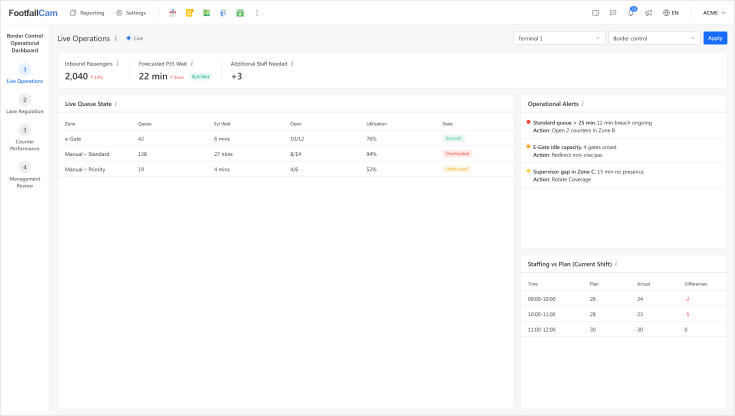
Live Operations Dashboard
Provides a real-time view of all border checkpoints, displaying current queue lengths, estimated wait times, lane utilisation, and critical alerts. It equips operations teams to react instantly to rising congestion or system issues, ensuring a smooth, continuous flow of inbound travellers and timely intervention when required.
Lane Regulation
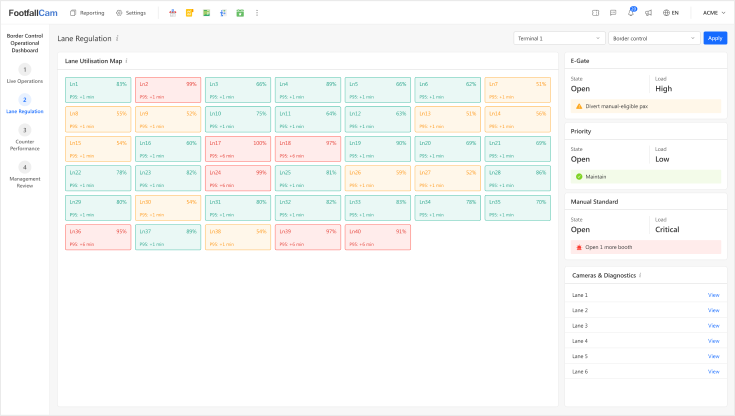
Lane Regulation Dashboard
Tracks performance of each immigration lane in use - lane occupancy, throughput, P95 waiting time, and lane-specific delays. Helps allocate lanes dynamically to balance load, reduce waiting times, and optimise lane utilisation.
Counter Performance
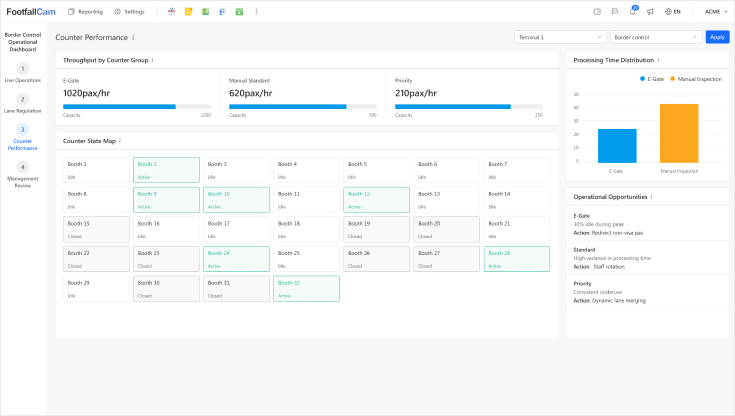
Counter Performance Dashboard
Monitors throughput at manual counters and e-gates, including travellers processed per hour, lane idle time, and developing backlogs. It provides a clear measure of staff efficiency and overall service performance, helping identify bottlenecks and guide decisions on balancing the opening or closing of different lane types.
Immigration P95 Wait Time
P95 wait time represents the experience of the slowest 5% of passengers - the group most affected by delays, service variability, and missed travel buffers. As the central KPI for immigration performance, it is refreshed every minute using live sensor data. All other metrics help explain, stabilise, and improve this number.
Key Metrics Captured at Immigration
Queue Heatmap (15-minute granularity)
Reveals flow surges, stability, and queue spillover patterns.
Manual vs E-Gate Throughput
Evaluates operational balance between lanes and quantifies processing gaps.
Lane Cycle Time Consistency
Shows counter efficiency and identifies inconsistent procedures.
Overspill Risk Projection
Predicts queue breaches before they occur, designed for APOC and real-time resourcing.
Hourly Demand Forecast (Next 120 Minutes)
Forecasts passenger load using flight mix and observed flow rates.
Airport Solutions for Immigration
Small Airports
Starting at
$8,000
Approx. 150 - 400m2
- Typical throughput: < 3 million passengers/year
- Possibly 1–2 e-gates (if available)
- Compact queuing zone
- Requires 9-10 devices to cover the area
Medium-Sized Airports
Starting at
$16,000
Approx. 400–1,200m2
- Typical throughput: 3–15 million passengers/year
- 6–16 manual counters, 4–10 e-gates
- Larger serpentine queue area
- Sometimes with fast-track or crew lane
- Requires around 20 devices
Large International Airports
Starting at
$24,000
Approx. 1,500-4,000m2 (or above)
- Typical throughput: > 20–40+ million passengers/year
- 20–50+ manual counters, 10–40 e-gates
- Multiple zones for nationality, transfer, crew, fast-track
- Requires 30-40 devices
Case Study
Peak Queue Stabilisation
Off-Peak Right-Sizing
Hidden Flow Bottleneck
Peak Queue Stabilisation
Case Study 1
Stabilising Peak-Hour Queues During Flight Banks
Context
An international airport with three daily arrival banks experienced volatile queue lengths at immigration. Despite adequate staffing, uneven distribution of passengers to counters resulted in sudden spikes.
Challenge
Supervisors could only respond after the queue had already formed, relying on manual observation and radio communication. This led to inconsistent P95 waiting times and passenger dissatisfaction during the morning peak.
Action Using the System
- Real-time dashboards highlighted Booth Group B repeatedly exceeding the 20-minute queue threshold.
- Lane utilisation heatmaps showed underused automated gates during the same window.
- The system recommended redeploying one marshal to redirect eligible passengers to e-gates.
Outcome
- P95 waiting time reduced from 28 minutes → 17 minutes within two days.
- SLA compliance (≤15 mins) increased from 84% → 94%.
- The airport established a new standard operating procedure based on the system’s continuous alerts.
Immediate Value
Operational teams gained a live, evidence-backed method to prevent queue build-up rather than reacting after failure.
Off-Peak Right-Sizing
Case Study 2
Eliminating Overstaffing in Off-Peak Periods Context
Context
A mid-sized Asian airport staffed immigration counters uniformly throughout the day, even during the low-traffic midnight hours.
Challenge
Actual processing demand after 23:00 was far lower than planned. The airport wanted to reduce cost without risking long wait times.
Action Using the System
- Historical path reconstruction showed hourly throughput dropping by 62% after 23:00.
- Staff utilisation dashboards revealed only 40% utilisation of open manual counters.
- Forecasting module recommended closing 3 counters while maintaining SLA protection.
Outcome
- Staff requirement reduced by 3 Full-Time Equivalent (FTE) per night shift.
- Annualised labour savings: USD 210,000.
- SLA compliance remained consistently above 96%.
Immediate Value
Operational teams gained a live, evidence-backed method to prevent queue build-up rather than reacting after failure.
Hidden Flow Bottleneck
Case Study 3
Identifying a Hidden Bottleneck in Queue Flow
Context
A European airport experienced fluctuating queues despite having many counters open. Operators assumed it was due to flight arrival variability.
Challenge
Passenger surveys highlighted frustration at slow-moving lines, but staff could not identify the exact cause. Queue length was manageable, but movement inside the queue was irregular.
Action Using the System
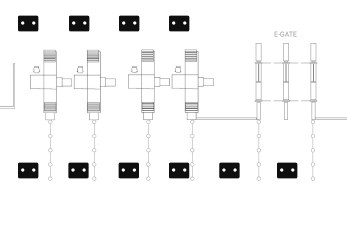
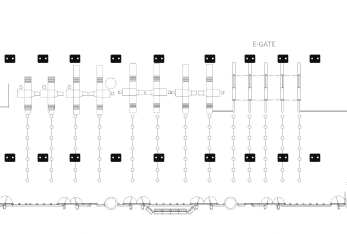
- The point-cloud playback and heatmap showed a stagnation zone caused by a poorly positioned stanchion.
- Movement density revealed a 30% slowdown where passengers converged before the queue split into manual and e-gate streams.
- Supervisors adjusted the barrier layout and added a directional marshal.
Outcome
- Average waiting time reduced by 9 minutes without opening any additional counters.
- Passenger flow became smoother, with 13% fewer stop-start movements.
- Complaints related to immigration queue dropped significantly during the following month.
Immediate Value
Operational teams corrected a structural bottleneck that was invisible to manual observation.
Baggage Reclaim
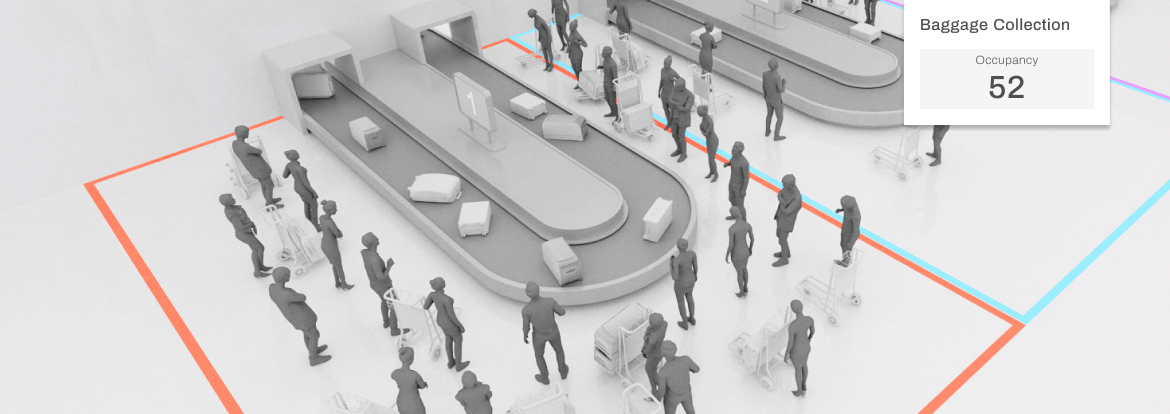
Baggage reclaim is the final phase of the passenger journey, where delays and congestion directly shape the airport's last impression. Issues such as late baggage delivery, carousel overcrowding, or operational slowdowns can quickly erode passenger satisfaction and disrupt the flow toward customs and exit.
FootfallCam Baggage Reclaim Analytics provides a unified view of what happens between aircraft on-blocks and passengers leaving the hall. Using Pro1/Pro2 devices and Centroid analytics, the system measures baggage delivery performance, passenger waiting time, area occupancy, and staffing efficiency. Operators gain real-time visibility of reclaim load, spot crowded zones or idle periods, and intervene early when bottlenecks emerge. The outcome: smoother baggage delivery, reduced waiting, optimised staffing, and a consistently positive end-of-journey experience.
Watch Video
The Dashboards for Baggage Handlers Authority
Executive Overview
Live Operations
Operational Review
Staffing Planner
Executive Overview
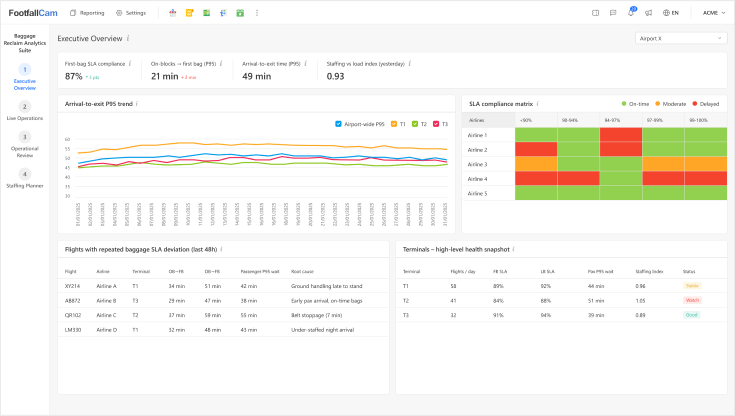
Executive Overview Dashboard
Executive overview: High-level baggage reclaim performance in a single view, showing first/last-bag SLA compliance, passenger waiting time and terminal health so executives can see if operations are on track at a glance.
Live Operations
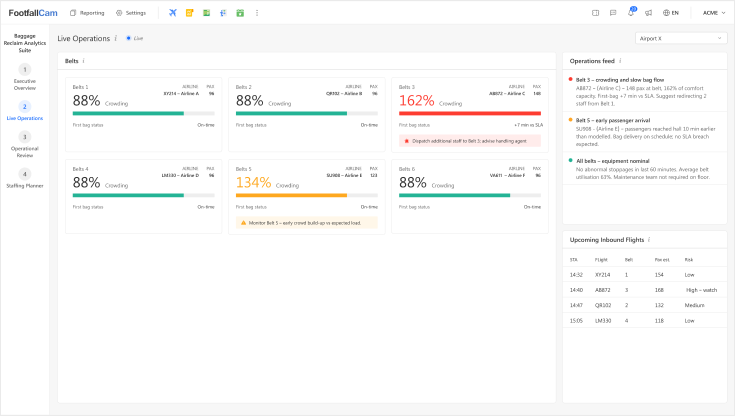
Live Operations Dashboard
Live operations: Real-time status of each belt, crowding and bag flow, with alerts and short recommendations to help duty staff act immediately during arrival waves.
Operational Review
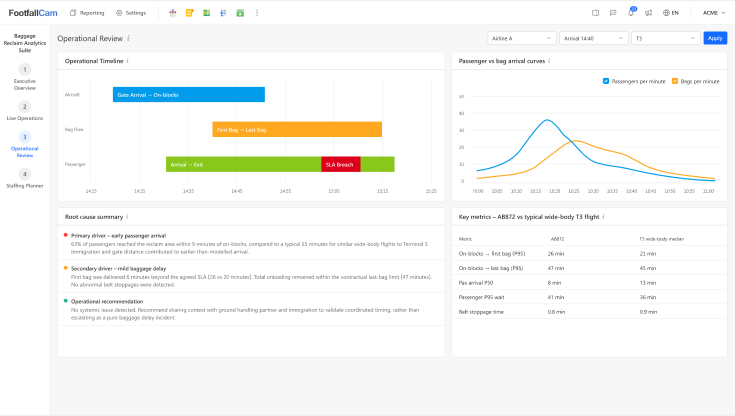
Operational Review Dashboard
Operational review: Flight-by-flight timelines of aircraft, bags and passengers, highlighting root causes of delays so supervisors can separate baggage issues from early passenger arrival, equipment faults or staffing.
Staffing Planner
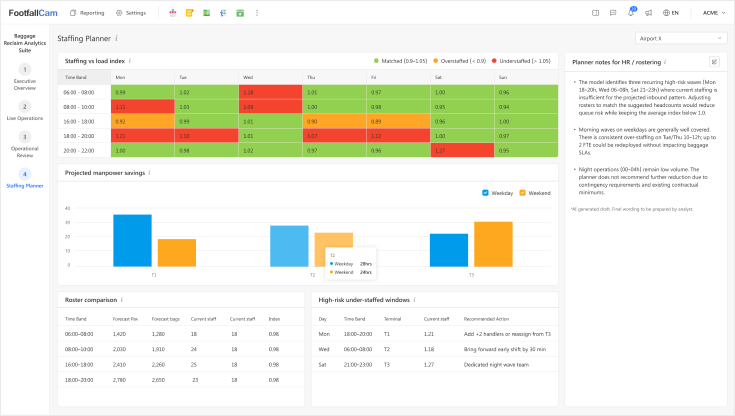
Staff Planner Dashboard
Staffing planner: Seven-day forecast of load versus rostered staff, identifying under- and over-staffed windows to support evidence-based manpower planning for baggage reclaim.
Passenger Arrival-to-Exit P95 Time
Measures the time from when a passenger enters the reclaim hall until they exit with their bags. It reflects the passenger experience end-to-end, capturing delays such as late belt activation, slow unloading, or oversized baggage waits. P95 highlights extreme delays, showing tail events beyond average times, making it the most passenger-focused metric for airport performance.
Key Metrics Captured at Baggage Reclaim
On-blocks → First Bag (P95)
Time from aircraft parking until first bag on belt, measuring SLA compliance and waiting time.
On-blocks → Last Bag (P95)
Time from aircraft parking to last bag delivery, tracking overall unloading efficiency.
Passenger Dwell P95
95% of the passenger waiting time at the belt, indicating passenger experience.
Bag Arrival Curve
Rate of bags arriving per minute on the belt, highlighting slowdowns or potential jams.
Belt Stoppage Time
Total duration the belt is inactive, monitoring equipment reliability and operational health.
Crowding Index
Percentage of time the belt area is overcrowded, helping control congestion and improve flow
Airport Solutions for Baggage Reclaim
Airports of Any Sizes
Starting at
$2,400
Approx. 300–600m² (or above)
- Typical throughput: 800–2,500 passengers/hour
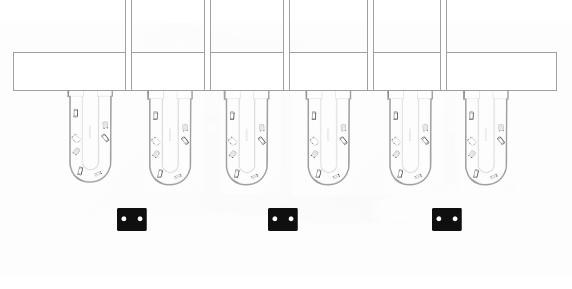
- Pro2 / Pro1 cameras positioned to monitor defined sections of each conveyor belt for bag flow, belt movement, and stoppage analysis.
- Deployment density: 1 device per 2–3 baggage belts, depending on belt length and visibility.
Case Study
Early Arrival Insight
Staffing Load Optimised
Hidden Stoppage Detection
Early Arrival Insight
Case Study 1
Identifying Early Passenger Arrival as the Root Cause
Context
Large European hub airport (35M pax/year) experiencing repeated complaints about long waiting times at two reclaim belts during evening wide-body arrivals.
Challenge
The airport experienced recurring complaints about long waiting times at two reclaim belts during wide-body evening arrivals. Ground handling insisted baggage delivery was on time.
Action Using the System
The Operational Review dashboard revealed passengers were reaching the hall 6–9 minutes earlier than the model baseline due to short walking routes and smooth immigration clearance.
Outcome
- Ground handling was cleared of blame; complaint escalations ceased.
- Airport updated staff positioning at the hall to manage early passenger surges.
- “Unexplained delays” dropped by over 60% because root causes became clear.
Immediate Value
Clear operational transparency and quick resolution of root-cause disputes.
Staffing Load Optimised
Case Study 2
Reducing Over-Staffing During Low-Load Waves
Context
Medium-sized Southeast Asian airport (18M pax/year) with historically conservative staffing in reclaim halls.
Challenge
The airport historically staffed reclaim halls conservatively, leading to high labour cost during quiet mid-day periods.
Action Using the System
The Staffing Planner heatmap revealed repeated over-staffed windows (index > 1.20) from 11:00–14:00 across all terminals.
Outcome
- Rosters were adjusted to reassign two handlers per shift.
- No reduction in SLA performance or congestion.
- Annualised manpower savings of 8–10% across reclaim operations.
Immediate Value
Measurable cost improvement without degrading passenger experience.
Hidden Stoppage Detection
Case Study 3
Detecting Hidden Belt Stoppages Impacting SLA
Context
A major Middle Eastern hub (40M pax/year) noted recurring first-bag SLA breaches for certain airlines.
Challenge
Airlines claimed normal offload times, yet first-bag delivery was consistently 5–7 minutes late, and staff could not visually identify the cause.
Action Using the System
The system detected short, repeated belt stoppages (20–40 seconds each) caused by a worn motor component. These stoppages were too small to be noticed visually by staff.
Outcome
- Maintenance replaced components proactively.
- First-bag SLA compliance improved from 82% → 94% within one week.
Immediate Value
Equipment issues surfaced quickly, preventing recurring SLA failures.
Check-In
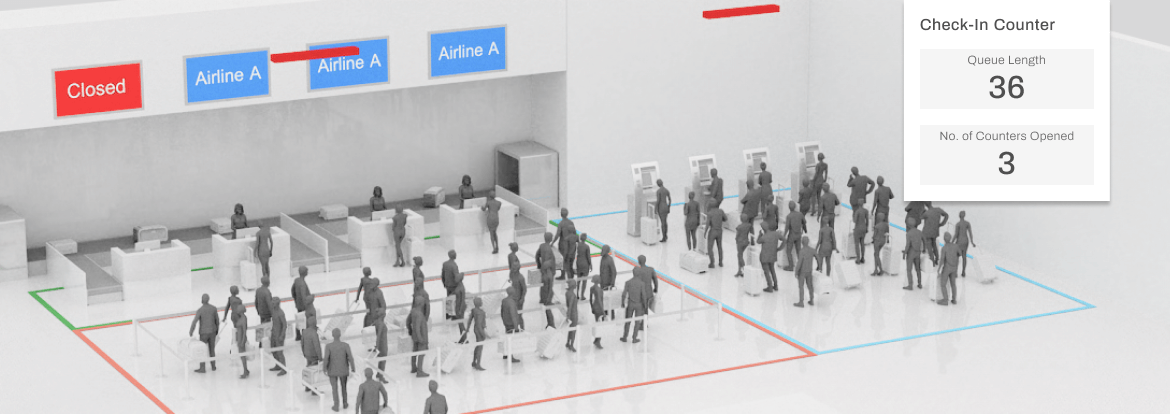
Airport check-in halls are some of the most complex and dynamic environments in the terminal. Large, unstructured spaces, open-plan layouts, high passenger volumes, and drifting queue formations make it nearly impossible for legacy queue systems to deliver reliable insights. Airports cannot manage what they cannot measure.
FootfallCam provides accurate, real-time visibility into queue formation, wait times, counter performance, and SLA compliance. By delivering ground-truth measurements, not estimates, the system enables airports to maintain service levels, optimise counter allocation, identify bottlenecks, and support operational decisions with factual evidence. This brings precision and control to an area where conventional tools consistently fail.
Watch Video
The Dashboards for Check-In Authority
Live Waiting Time
Check-In Hall Performance
Airport Management Review
Airline Weekly Check-In Performance
Live Waiting Time Dashboard
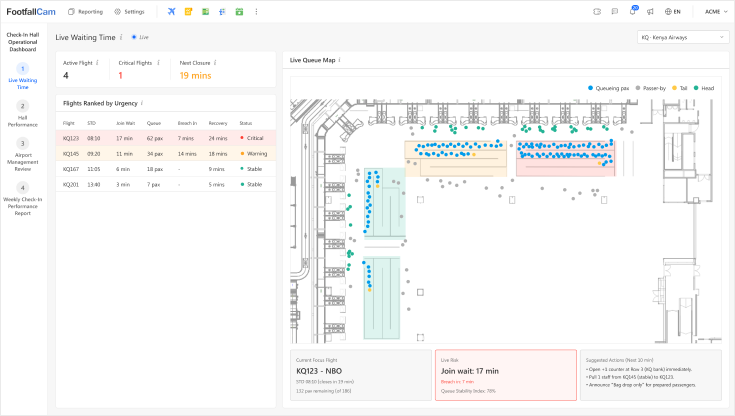
Live Waiting Time Dashboard
Optimised for real-time monitoring (updated every 3-5 secs).
- Join Wait (expected wait for a new entrant)
- Counter Service Rate & Capacity Deficit
- Recovery Time Estimate after backlog
- Breach-in-X-minutes prediction
- Active Airlines in Hall and their immediate performance windows
This view is role-aligned to ground staff responsible for immediate intervention and rapid counter deployment.
Check-In Hall Performance
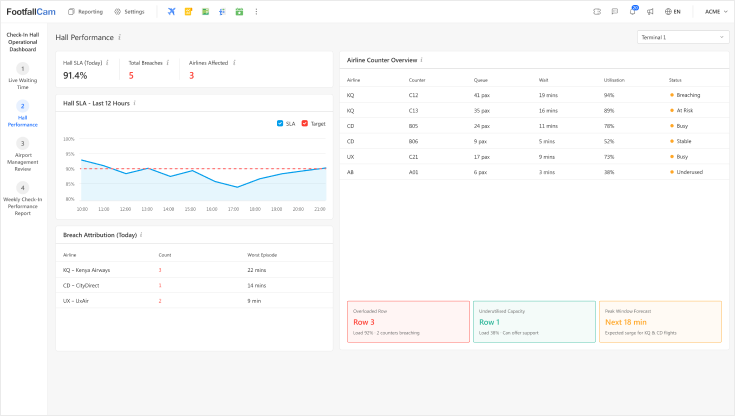
Hall Performance Dashboard
Designed for supervisory control of the entire hall (Updated every 30-60 secs.)
- Full hall queues - per airline / bank / row
- Counter opening discipline: late opens, early closes, under-staffed positions
- Service variance analysis (processing time deviations)
- Comparative airline performance baselines
- Rolling hourly demand curve vs capacity
This dashboard acts as the operational “black box” for the check-in hall, enabling consistent performance governance.
Airport Management Review
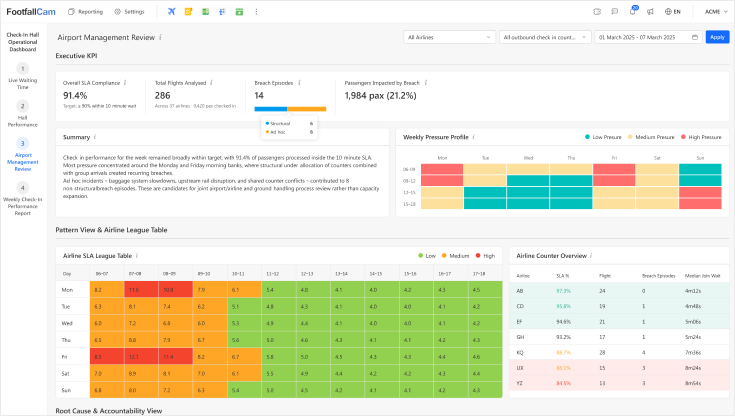
Airport Management Review Dashboard
A structured, neutral report summarising:
- SLA compliance
- Number, size, severity of breach episodes
- Passenger volume distribution vs allocated counters
- Recovery time behaviour
- Queue stability (QSI trends, drift episodes)
- Comparisons to peer carriers
- Root-cause analysis and recommendations
Designed to support constructive review between airport operator, ground handler and airline.
Airline Weekly Check-In Performance
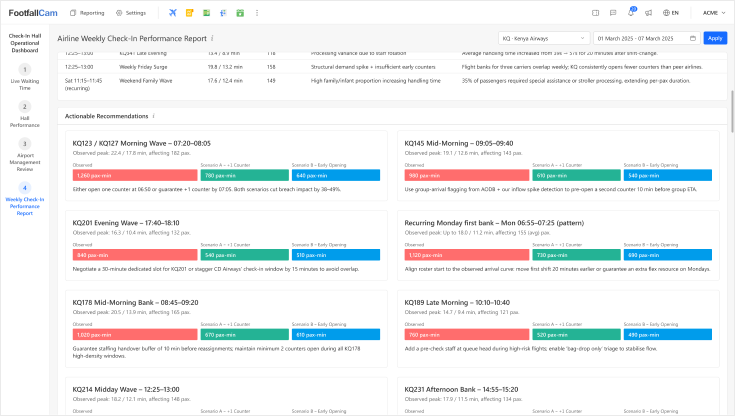
Airline Weekly Check-In Performance
Provides a comprehensive airline review:
- Flight-bank performance patterns
- Day-of-week behavioural differences
- Structural staffing issues (roster alignment)
- Shared-counter friction patterns
- Multi-week SLA heatmaps
- High-impact breach catalogue
- Recommendations for resource planning
This level is intended for infrastructure planning, contractual review, and operational assurance.
End-to-End Passenger Processing Time
This metric quantifies the total elapsed time from a passenger joining the check-in queue to the completion of counter processing. It integrates queue progression rate, service rate per counter, counter availability, queue geometry drift, and staffing assignment. By correlating passenger arrival curves with actual processing throughput, it exposes capacity shortfalls, micro-stoppages, lane imbalance, and counter under-utilisation. The metric acts as the governing indicator for forecasting congestion, validating SLA adherence, and detecting systemic inefficiencies across airlines, counter groups, and time periods. It provides a single, technical reference point for diagnosing whether the check-in hall is operating within planned operational capacity.
Key Metrics Captured at Check-In Hall
Queue Length
Measures number of passengers waiting in each airline queue at any moment.
Estimated Waiting Time
Predicts how long passengers will wait based on real-time forward progression.
Active vs Assigned Counters
Shows how many counters are staffed and processing passengers per airline.
Counter Throughput
Measures passengers processed per counter per hour for performance comparison.
Passenger Arrival Rate
Tracks how many passengers enter the check-in area per minute.
Processing vs Arrival Rate
Compares service capacity to incoming demand to identify imbalance.
Airport Solutions for Check-In Hall
Small Airports
Starting at
$8,000
Approx. 150 - 400m2
- Typical throughput: < 3 million passengers/year
- 2-6 Economy counters, 1-2 Business-Class counter if available
- Compact single-zone check-in
- Requires 8–10 devices
Medium-Sized Airports
Starting at
$12,000
Approx. 400–1,200m2
- Typical throughput: 3-15 million passengers/year
- 6-16 Economy counters, 4-10 Business-Class/First Class counters
- Multi-island hall with dynamic counter allocation
- Requires 15–30 devices
Large International Airports
Starting at
$32,000
Approx. 1,500-4,000m2 (or above)
- Typical throughput: > 20 million passengers/year
- 20-50+ Economy counters, 10-20 Business-Class/First Class/Frequent Flyers counters
- Full terminal coverage with multi-zones
- Requires 40-50 devices
Case Study
Improving Predictability
Strengthening Governance
Improving Predictability
Case Study 1
APOC receiving late escalation from security
Challenge
Airports with centralised operations centres rely on security to provide early warnings. However, the checkpoint team often escalated only after a queue breached the SLA, limiting the APOC’s ability to rebalance flows or coordinate with airlines.
What FootfallCam Measured
- Short-horizon wait-time projections (15–30 minutes)
- Demand–capacity mismatch indicators
- Impact of inbound flight banks on checkpoint load
- Trends across multiple days showing repeatable patterns
Outcome
Monthly performance reviews became more structured:
- Issues were categorised into forecast, staffing, process, equipment, or external
- Management could see which corrective actions had the highest return
- Stakeholders could differentiate avoidable issues from those driven by circumstances
Strengthening Governance
Case Study 2
Monthly SLA reports lacked granularity
Challenge
Senior management received a high-level SLA figure (“% processed within 10 minutes”), but root causes were unclear. Some breaches appeared unavoidable; others seemed operational. Without detailed attribution, improvement efforts were difficult to target.
What FootfallCam Measured
- Each breach window with precise queue metrics
- Staffing levels vs planned rosters
- Lane performance against expected service rate
- Correlation with equipment downtime and security alerts
- Airline exposure and impact windows
Outcome
Monthly performance reviews became more structured:
- Issues were categorised into forecast, staffing, process, equipment, or external
- Management could see which corrective actions had the highest return
- Stakeholders could differentiate avoidable issues from those driven by circumstances
This led to fewer escalations, clearer planning discussions, and a more stable checkpoint environment.
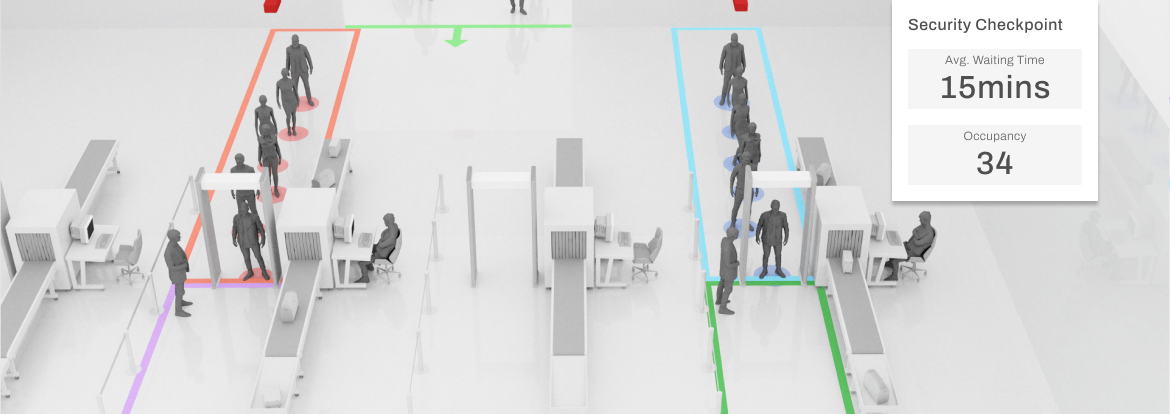
Security Checkpoint
Security screening is a mandatory step in the departure journey, governed by national aviation regulations and international standards. Airports must balance two conflicting priorities: strict compliance with security procedures and maintaining stable passenger flow to prevent excessive queues, missed connections, and operational disruptions.
FootfallCam provides airports with a measurement and monitoring layer across the security checkpoint, enabling operators and contractors to make informed, timely decisions based on objective data. The system does not alter security protocol. Instead, it gives full visibility of throughput, lane performance, demand patterns, staff deployment, and service levels, allowing both the airport and the contracted security provider to maintain consistency and meet service obligations.
Watch Video
The Dashboards for Security Checkpoint Authority
Live Security Control
Terminal Supervisor
Management & Governance Report
Live Security Control

Security Screening: Live Security Control
Each lane is measured individually to highlight operational characteristics:
- Service rate (pax/hr)
- Utilisation level
- Impact of alarms and secondary checks
- Timing of lane opening and closing
- Changes in performance during peak periods
Support a clearer understanding of operational constraints, allowing supervisors to respond quickly and allocate resources effectively.
Terminal Supervisor

Security Screening: Terminal Supervisor
Supervisors can view live conditions at each checkpoint and anticipate upcoming peaks. The system provides:
- Live queue status and expected wait times
- Forecasts for the next 15–30 minutes
- Alerts when demand approaches capacity
- Indicators for lane optimisation and load balancing
This enables quicker decisions during high-traffic periods and supports the smooth flow of passengers through the terminal.
Management & Governance Report

Management & Governance Report
Comprehensive reporting tools summarise checkpoint performance:
- Daily and monthly SLA compliance
- Time periods with elevated wait times
- Attribution of performance impacts (staffing, demand, equipment)
- Process-level insights for divest, screening and recomposure
- Airline impact summaries
Support routine operational reviews and long-term planning discussions with contractors, airlines and regulatory bodies.
Operational Visibility Across the Checkpoint
FootfallCam monitors passenger movement throughout the screening area, delivering real-time and historical insights for:
- Queue length and wait times
- Passenger arrival patterns
- Throughput per lane
- Divest, screening and recomposure timing
- Lane utilisation and availability
This provides a consistent view of checkpoint performance, helping teams maintain stable service levels throughout the day.
Configured Around Real Checkpoint Operation
Airport checkpoint operations change by flight wave, season, lane configuration and service model. FootfallCam allows airport teams to configure measurement zones, queue rules, lane states, alert thresholds, SLA targets, dashboards and passenger-facing displays. Data is captured automatically, while interpretation remains controlled by the airport, creating a repeatable operations layer for live decisions, passenger experience management and long-term performance modelling.
Airport Security Checkpoint Analytics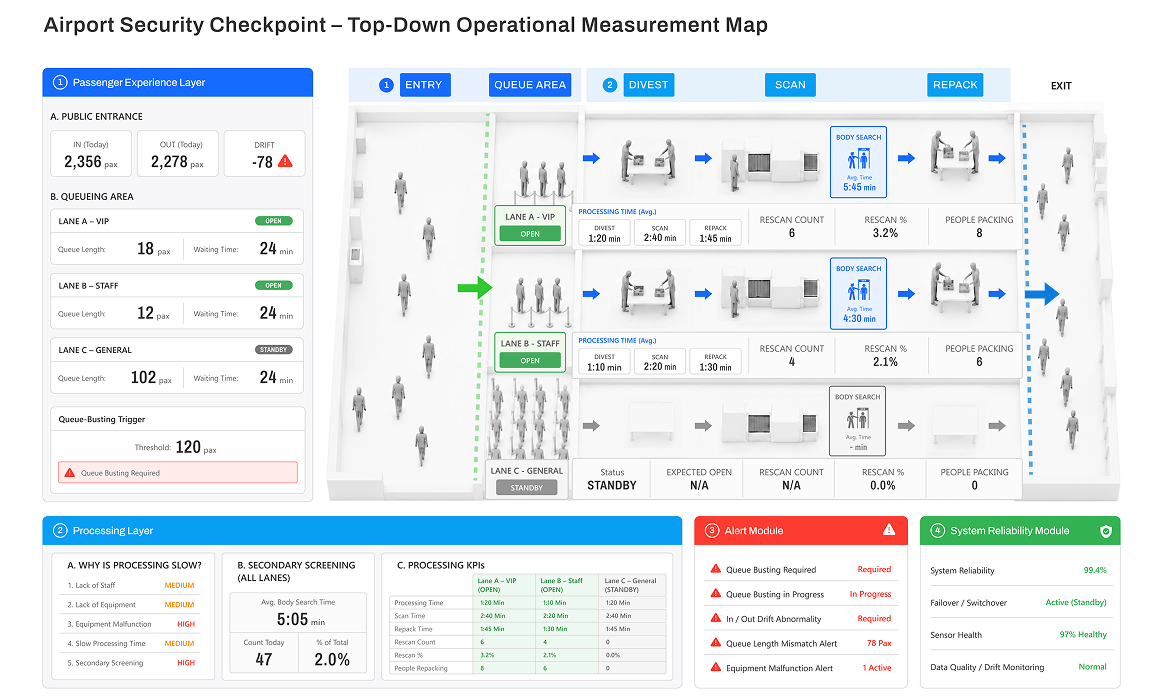
Key Metrics Captured at Security Checkpoint
Queue Length
Measures the number of passengers waiting to be processed at any moment.
Average Waiting Time
Tracks how long passengers typically wait before reaching the processing point.
Incoming Passengers
Counts all arriving passengers entering the immigration or checkpoint area.
Throughput per Lane
Measures how many passengers each lane processes within a set timeframe.
Divest Processing
Tracks the time passengers spend preparing items before screening.
Lane Utilisation
Shows how actively each processing lane is used throughout operations.
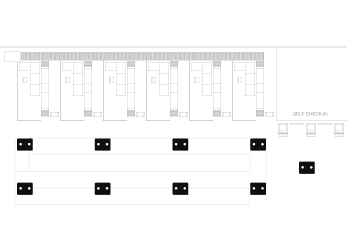
Airport Solutions for Security Checkpoint
Small Security Checkpoints
Starting at
$9,000
Approx. 100 - 300m2
- Typical throughput: Up to ~3 million passengers/year
- 2-4 manual lanes and 1-2 priority lanes
- Single queuing zone, minimal lane separation
- Around 6–10 sensors covering lanes and queue entry/exit points
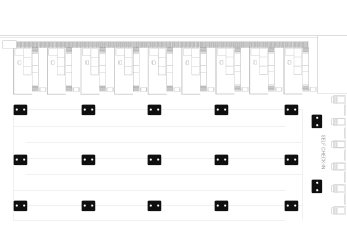
Medium‑Sized Security Zones
Starting at
$18,000
Approx. 300–1,000m2
- Typical throughput: 3–15 million passengers/year
- 6-16 security lanes with priority and crew lanes
- Staff presence vs lane performance
- Requires around 15 devices depending on ceiling height and layout complexity
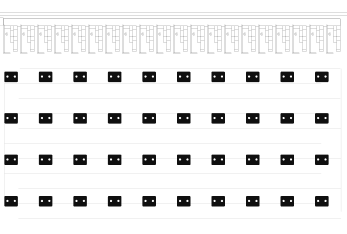
Large International Checkpoint Solution
Starting at
$28,000
Approx. 800-2,500m2 (or above)
- Typical throughput: > 15–40+ million passengers/year
-
16–32+ security lanes, including:
- Priority, transfer, crew, PRM & staff lanes
- Multiple divest islands & screening areas
- Typically 25–40 devices, optimised per lane cluster and height profile
Case Study
Stabilising Morning Peaks
Separating Contractor Issues from Constraints
Identifying the True Bottleneck
Stabilising Morning Peaks
Case Study 1
Unpredictable surges and limited operational headroom
Challenge
A major international terminal experienced recurring congestion between 06:30–08:00. The airport already operated with a full complement of security lanes and had little flexibility to expand the checkpoint footprint. Operational teams reported that queue build-up “varied day to day” despite similar schedules.
What FootfallCam Measured
- Passenger arrival curve vs actual staffing profile
- Lane-by-lane service rate during the first 90 minutes of operations
- Divest occupancy and tray turnover
- Timing of lane openings relative to arrival surges
Outcome
- The data clarified that the issue was not overall staffing volume, but asymmetry in the first 20 minutes of the wave. A subset of lanes opened later than scheduled, reducing early throughput and causing knock-on queue build-up. With this visibility, the airport adjusted the lane activation sequence.
- No new staff were hired.
- No process rules were modified.
- Performance became more consistent and morning queues stabilised.
Separating Contractor Issues from Constraints
Case Study 2
Disputes over SLA breaches
Challenge
An airport experienced recurring SLA exceedances on two non-consecutive days per week. The contracted security provider attributed the cause to unexpected passenger volumes, while airport planning believed staffing inconsistencies were contributing factors.
What FootfallCam Measured
- Live headcount and staff presence at each lane
- Lane utilisation and inactive time
- Passenger arrival patterns correlated with A-CDM schedule data
- Frequency and duration of equipment slowdowns
Outcome
- The report showed that half the breaches coincided with under-forecasted demand peaks, and the other half corresponded to delayed lane openings caused by staffing gaps.
- Both parties accepted the findings as neutral evidence.
- The airport refined its forecasting parameters; the contractor adjusted deployment discipline.
- This reduced disagreement and improved service continuity.
Identifying the True Bottleneck
Case Study 3
High alarm rate blamed for queueing
Challenge
Supervisors believed that X-ray machine alarms were causing excessive manual searches, slowing down the checkpoint. However, the OEM logs did not correlate clearly with queue patterns.
What FootfallCam Measured
- Divest timing per passenger
- X-ray throughput independent of alarm frequency
- Recompose occupancy and delays
- End-to-end dwell time through each zone
Outcome
- The report showed that half the breaches coincided with under-forecasted demand peaks, and the other half corresponded to delayed lane openings caused by staffing gaps.
- Both parties accepted the findings as neutral evidence.
- The airport refined its forecasting parameters; the contractor adjusted deployment discipline.
- This reduced disagreement and improved service continuity.
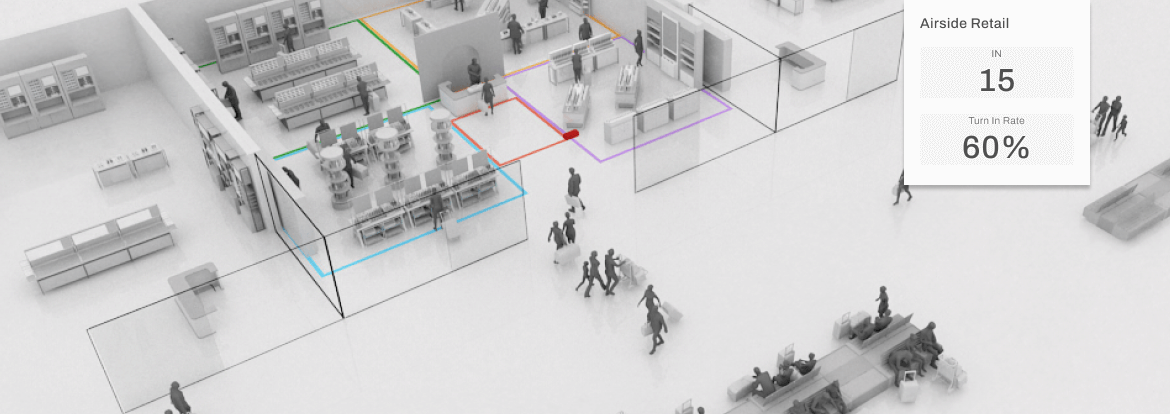
Airside Retail
Airport retail areas are part of the curb-to-gate passenger flow, not a separate system. Congestion, queues, and overcrowding in retail and food & beverage areas affect:
- circulation speed,
- passenger comfort,
- downstream queues,
- and overall terminal stability.
This solution provides airport operators with a live operational dashboard to monitor passenger density, congestion, and queues in retail areas, using a targeted, cost-controlled deployment. It is designed to deliver immediate operational value, without requiring full terminal coverage or advanced analytics.
Watch Video
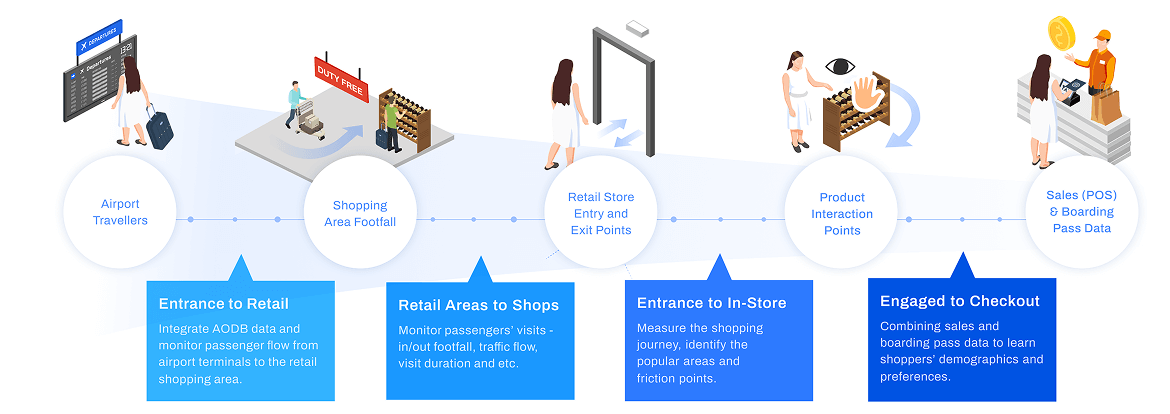
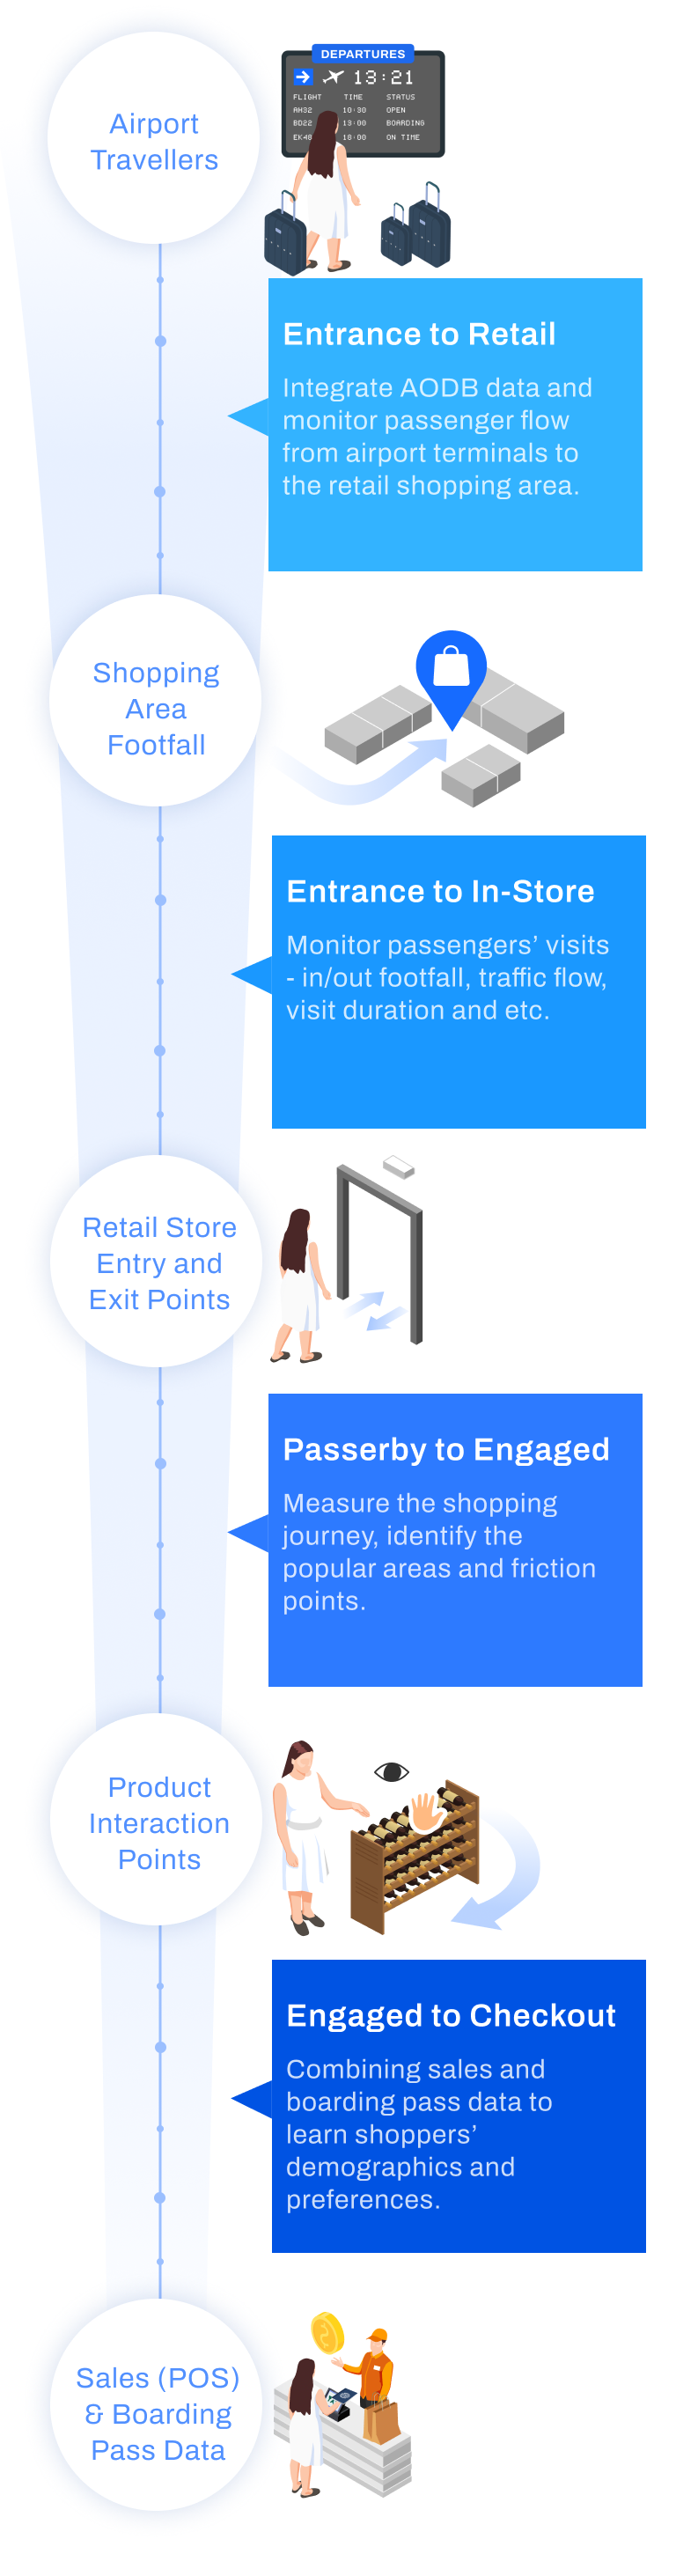
“From Terminal to Transaction: Mapping the Complete Airport Shopper Journey”
The Dashboards for Airside Retail
Live Retail Flow & Queue Monitor
Live Bottleneck Detector
Daily / Weekly Retail Performance Review
Monthly CEO Dashboard
Zonal Utilisation & Geometry Review
Live Retail Flow & Queue Monitor
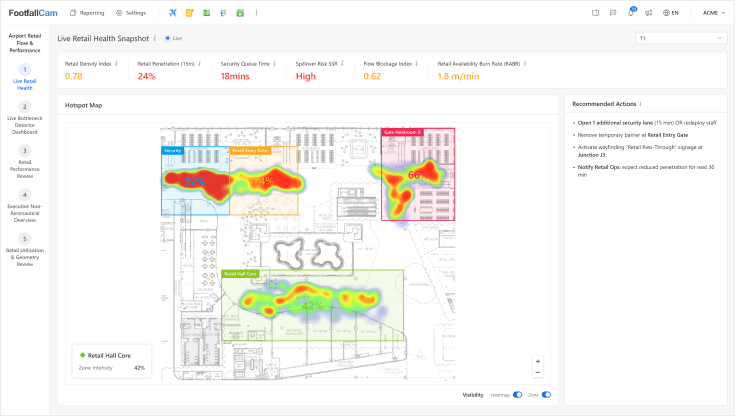
Live Retail Flow & Queue Monitor
- Real-time monitoring of passenger flow, queue status, and retail zone density.
- Detects bottlenecks, spillovers, and anomalies, enabling duty managers to act immediately to protect retail access and discretionary passenger time.
- Key metrics include Retail Zone Density, Retail Penetration, Queue Waiting Time, Flow Blockage Index, and Spillover Risk.
- Operators can annotate incidents, record interventions, and adjust staffing or signage to maintain operational efficiency.
Live Bottleneck Detector
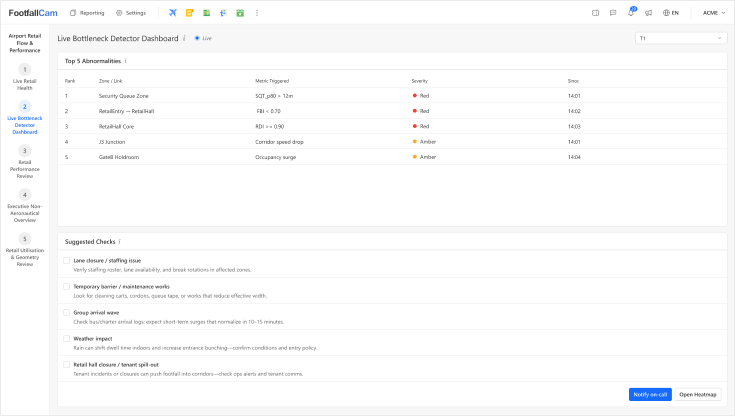
Live Bottleneck Detector
- Focuses on detecting sudden operational disruptions in retail corridors and entries.
- Highlights the top flow anomalies, high-risk queues, and density surges.
- Supports rapid response by security, operations, and retail staff.
- Metrics tracked include Flow Blockage Index, Corridor Speed, and Spillover Risk, with color-coded thresholds.
- Each event is logged for audit, post-event review, and identification of recurring structural or operational issues.
Daily / Weekly Retail Performance Review
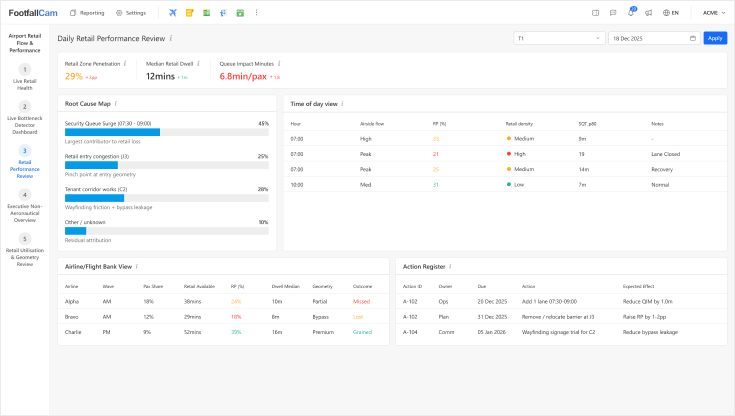
Daily / Weekly Retail Performance Review
- Provides post-event analysis of retail performance and operational impact.
- Measures Retail Penetration, Retail Dwell, and Queue Impact Minutes. Breaks down losses by root causes - queue surges, corridor blockages, tenant works, and identifies actionable interventions.
- Supports operations and commercial teams in prioritising corrective actions, validating effectiveness, and planning staffing or layout adjustments for the next operational period.
Monthly CEO Dashboard
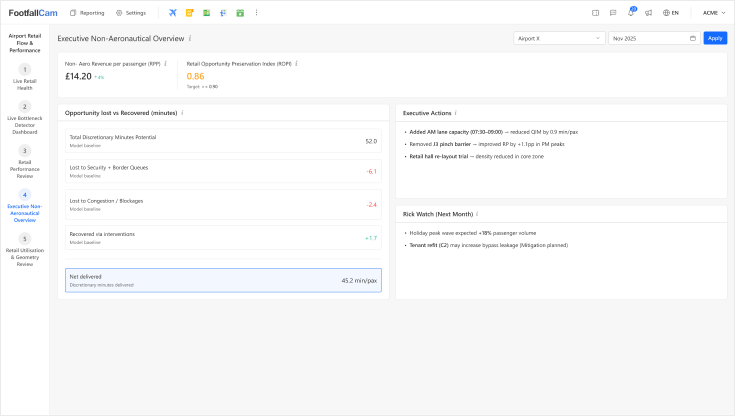
Monthly CEO Dashboard
- Executive-level overview linking operational efficiency to non-aeronautical revenue potential.
- Key metrics include Retail Opportunity Preservation Index (ROPI) and Non-Aero Revenue per Passenger (RPP).
- Highlights discretionary time lost or recovered, the impact of interventions, and emerging risks.
- Enables informed strategic decisions for resource allocation, revenue protection, and operational planning, without tracking individual passengers.
Zonal Utilisation & Geometry Review
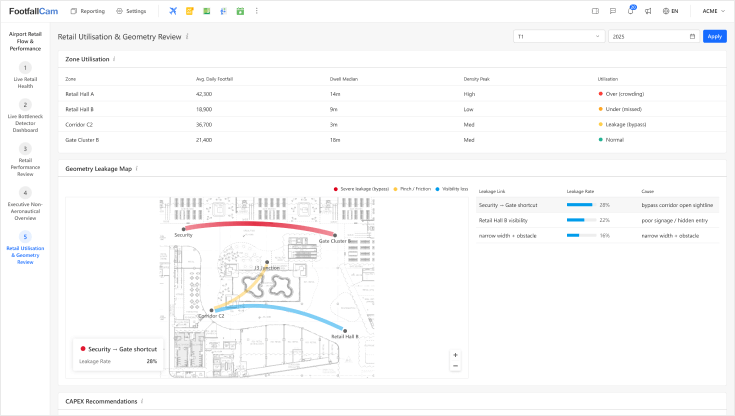
Zonal Utilisation & Geometry Review
- Long-term analysis of retail space performance, layout, and passenger flow patterns.
- Measures zone utilisation, density peaks, and structural leakage.
- Supports capital planning, corridor redesign, and tenant mix decisions.
- Provides evidence-based recommendations for congestion reduction, retail penetration improvements, and seating/amenity placement, ensuring maximum discretionary passenger engagement and revenue opportunity.
Airport Retail Flow & Performance Analytics
The Airport Retail Flow & Performance Analytics solution delivers a zone-based measurement and control layer focused on:
- Passenger movement between terminal zones
- Queue formation, duration, and spill over
- Density and congestion within retail spaces
- Access and exposure to retail areas
- Operational anomalies affecting circulation
The system operates independently of passenger identity and does not require individual tracking.
Key Metrics Captured at Airside Retail
Retail Zone Penetration
Percentage of passengers entering and browsing defined retail areas.
Queue Waiting Time
Passenger wait duration at key operational bottlenecks, measured percentile-based.
Retail Zone Density
Real-time occupancy and crowding levels within retail zones.
Store Frontage Pass-By & Turn-In Rate
Number of passengers passing storefront versus those entering the store.
In-Store Engagement
Distribution of passenger activity across store areas and product zones.
Idle Dwell Time
Duration passengers spend stationary in circulation or seating areas outside retail shops.
Airport Solutions for Airside Retail
Airports of Any Sizes
Starting at
$14,400
Typical coverage: Retail zones of 150–600 m² per store or section, scalable for larger areas
- Passenger throughput: 800–2,500 passengers/hour per zone
- Deployment: Pro2 cameras installed at each retail store entrance to monitor passenger entries, turn-in rate, queue formation, and zone density
- Deployment density: 1 device per store entrance, scalable for multiple retail zones depending on layout and visibility
Case Study
Protecting Retail Access
Identifying Structural Retail Bypass
Detecting Retail Bottlenecks
Protecting Retail Access
Case Study 1
Protecting Retail Access During Peak Security Congestion
Situation
A large international airport experienced recurring security queue congestion during morning peak hours. Although security KPIs were monitored, the commercial team reported unexplained drops in retail engagement during the same periods.
What FootfallCam Measured
- Queue waiting time and queue spillover at security
- Retail zone entry counts
- Density and congestion at retail hall entrances
Findings
Queue spillover extended beyond designated queue zones and partially blocked access to the main retail hall. Retail penetration dropped by more than 10% during peak congestion windows, despite stable passenger volumes.
Action Taken
- Temporary reallocation of security staff during peak periods
- Removal of movable barriers that narrowed the retail entry corridor
Outcome
Retail access was restored during peak hours, with retail penetration returning to baseline levels. The airport established a recurring review process linking queue performance to retail access.
Identifying Structural Retail Bypass
Case Study 2
Identifying Structural Retail Bypass Caused by Terminal Geometry
Situation
A terminal retail area consistently underperformed compared to similar terminals, despite comparable passenger volumes and tenant mix.
What FootfallCam Measured
- Zone in/out counts at retail hall entrances
- Zone-to-zone flow transition rates
- Density distribution across circulation corridors
Findings
Passenger flow analysis showed that a significant proportion of passengers bypassed the retail hall via a shortcut corridor leading directly from security to gates. The underperformance was structural rather than operational.
Action Taken
- Reclassification of the retail hall as “partial exposure”
- Wayfinding adjustments and minor circulation changes were trialled
Outcome
Retail penetration increased without changes to tenant operations. The analysis provided evidence to support future layout redesign during terminal refurbishment.
Detecting Retail Bottlenecks
Case Study 3
Detecting Temporary Bottlenecks Affecting Retail Circulation
Situation
An airport reported irregular drops in retail engagement with no clear operational incidents recorded.
What FootfallCam Measured
- Flow blockage detection between circulation zones
- Retail penetration (rolling window)
- Density spikes at specific junctions
Findings
Flow anomalies were traced to temporary obstructions caused by cleaning activities and ad-hoc maintenance works near retail corridors.
Action Taken
- Adjustment of cleaning schedules outside peak passenger waves
- Clear definition of no-obstruction zones near retail entrances
Outcome
Unplanned bottlenecks were reduced, and retail access stabilised. Operations teams adopted anomaly logs as part of daily review.
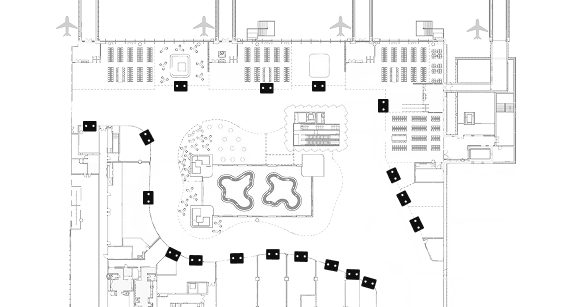
Gate Hold Room & Boarding Analytics
Boarding gates and hold rooms are among the most sensitive areas in an airport terminal. They operate within limited physical space, are highly time-dependent, and are directly exposed to passenger behaviour, airline boarding processes, and upstream variability.
Unlike security or border control, congestion at the gate is rarely caused by a single failure. It is usually the result of timing, behaviour, and space constraints interacting together. When unmanaged, this leads to queue spill over into circulation areas, discomfort for passengers, and operational disruption across neighbouring gates.
FootfallCam provides objective, real-time and historical visibility into how boarding gates actually perform in practice, enabling airport operators and airlines to manage flow, respond early, and address recurring issues.
Watch Video
The Dashboards for Boarding Gates
Live Gate Dasboard
Supervisor & Floor Manager View
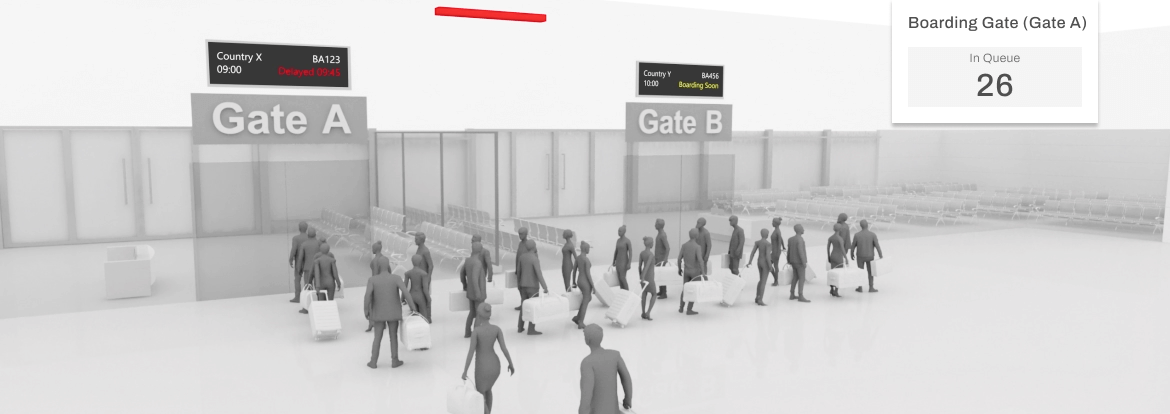
Live Gate Dasboard
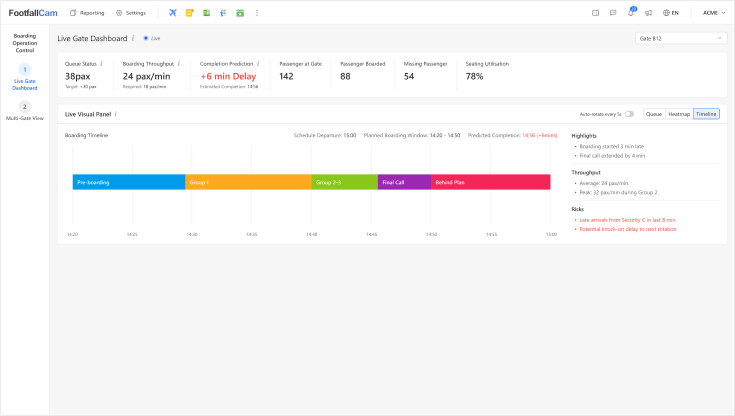
Boarding Gates
Live Gate Dashboard
The live dashboard is designed for gate staff and duty teams. It provides:
- Immediate visibility of passenger overflow into circulation areas
- Early warning when congestion is building
- Real-time boarding throughput and completion prediction
- Current comfort and seating stress indicators
This allows teams to act before congestion escalates, rather than reacting after spillover occurs.
Supervisor & Floor Manager View
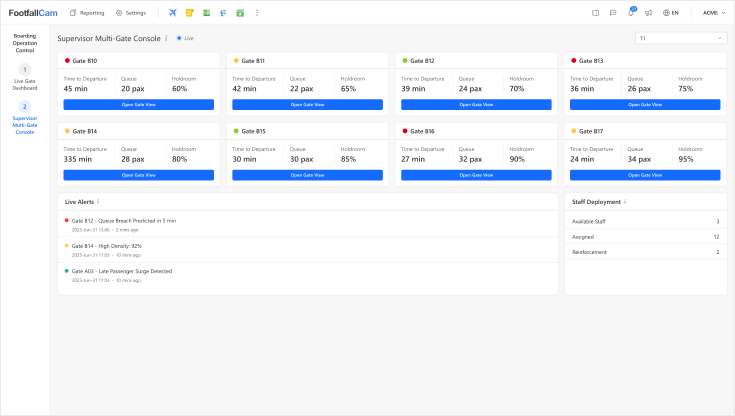
Supervisor & Floor Manager View
For supervisors managing multiple gates or an entire pier, FootfallCam provides a consolidated operational view. This enables:
- Identification of gates approaching congestion thresholds
- Early detection of recurring pressure points
- Prioritisation of staff deployment and intervention
- Clear differentiation between isolated incidents and systemic issues
Supervisors can focus attention where it is most needed, while maintaining overall terminal flow.
Supporting Planning with Real Operational Data
While aircraft type and gate size are typically known during planning, actual passenger behaviour often deviates from assumptions.
FootfallCam provides empirical data to:
- Validate whether gate and holdroom layouts perform as expected
- Identify where theoretical capacity differs from real-world usage
- Highlight gates that consistently operate close to tolerance limits
This information supports planning decisions without replacing existing airport systems.
Key Metrics Captured at Boarding Gates
Queue Length
Measures the number of passengers currently within the boarding queue zone.
Boarding Throughput
Passengers processed through gate per minute of boarding activity.
Holdroom Occupancy
Total passengers present inside the gate hold room.
Peak Overflow Duration
Longest continuous period of queue overflow in last interval.
Seating Utilisation
Percentage of seats occupied in boarding hold area.
Predicted Completion Delay
Estimated minutes beyond scheduled boarding completion time.
Airport Solutions for Boarding Gates
Airports of Any Sizes
Starting at
$12,800
Approx. 300–1,000m2
- Typical throughput: 3–15 million passengers/year
- 8-16 boarding gates
-
Requires around 16 devices, depending on ceiling height and layout complexity
(typically 1 device per boarding gate)
Case Study
Preventing Queue Spillover
Managing Recurrent Congestion
Improving Passenger Comfort
Preventing Queue Spillover
Case Study 1
Preventing Queue Spillover at a Busy International Boarding Pier
Challenge
During peak departure waves, multiple boarding gates experienced queue spillover into adjacent concourses. Although boarding procedures and gate assignments were well defined, small delays in boarding start time or temporary interruptions caused passengers to accumulate outside designated queue areas. This frequently blocked circulation routes and interfered with neighbouring gates, creating operational stress and negative passenger perception. The airport required a way to detect congestion early, before queues extended beyond acceptable limits
What FootfallCam Measured
- FootfallCam was deployed at selected boarding gates to monitor passenger movement within the holdroom, queue zones, and surrounding circulation areas. The system measured real-time passenger overflow into non-designated areas and tracked how long congestion persisted.
- Gate staff and supervisors were provided with live visibility of queue build-up, boarding throughput, and predicted completion time, enabling timely intervention when congestion was forming.
Outcome
- Early detection of queue spillover risks before concourse blockage occurred
- Improved coordination between gate staff and floor supervisors
- Reduced interference with adjacent boarding gates
- More stable passenger flow during peak departure periods
The airport was able to manage congestion proactively rather than reacting after circulation was already compromised.
Managing Recurrent Congestion
Case Study 2
Managing Recurrent Congestion at High-Load Boarding Gates
Challenge
Certain boarding gates consistently experienced crowding and discomfort, particularly during peak travel seasons. Although aircraft and gate assignments followed planning guidelines, passenger behaviour, such as early arrival, clustering near the podium, and delayed boarding start, resulted in repeated congestion. The operations team needed to understand why the same gates repeatedly became congested, and whether the causes were operational or behavioural.
What FootfallCam Measured
- FootfallCam provided continuous measurement of passenger density, seating utilisation, and queue overflow at affected gates. Boarding flow data was analysed alongside congestion events to identify patterns related to boarding timing, throughput interruptions, and arrival surges.
- Supervisors used these insights to adjust boarding coordination and staffing response at specific gates and time windows.
Outcome
- Clear identification of gates with chronic congestion patterns
- Improved understanding of operational versus behavioural causes
- Reduced frequency and duration of crowding events
- More consistent boarding performance across peak periods
The airport gained objective evidence to support targeted operational adjustments rather than broad, disruptive changes.
Improving Passenger Comfort
Case Study 3
Improving Passenger Comfort in Limited Holdroom Space
Challenge
Passenger feedback indicated discomfort and dissatisfaction during boarding, particularly at gates with limited seating. While queues remained mostly within designated areas, high standing density and clustering reduced perceived comfort and created stress for passengers waiting to board. The airport wanted to maintain a calm and comfortable waiting environment without changing existing gate layouts.
What FootfallCam Measured
- FootfallCam measured seating utilisation, standing passenger counts, and density hotspots within the holdroom. Real-time and historical data allowed the operations team to understand how passengers actually used the space during different phases of boarding.
- This information supported better boarding timing coordination and enabled staff to intervene when seating stress or excessive standing occurred.
Outcome
- Improved visibility of seating and comfort pressure points
- Reduced standing congestion during boarding peaks
- More consistent passenger experience at constrained gates
- Better alignment between boarding activity and available space
The airport was able to improve passenger comfort using operational adjustments rather than physical expansion.
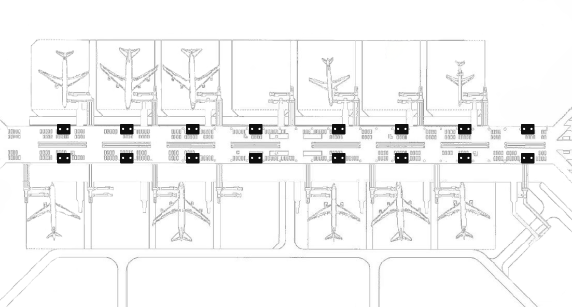
Passenger Amenity Spaces
Passenger amenity spaces such as washrooms, prayer rooms, and premium lounges are integral to overall passenger experience, yet they are rarely managed with the same level of operational visibility as core processing areas. These spaces are capacity‑constrained, sensitive to short‑term demand surges, and prone to localised congestion that can quickly affect passenger comfort, circulation, and service perception.
This solution provides a structured, measurable, and operationally accountable approach to managing amenity spaces as part of the wider airport operating model. It complements existing passenger flow management at check‑in, security, and border control, extending situational awareness to areas that are typically managed reactively.
Watch Video
The Dashboards for Passenger Amenity Spaces
Live Occupancy & Queue Monitor
Operational Response Tracking
Utilisation & Demand Patterns
Management Review Summary
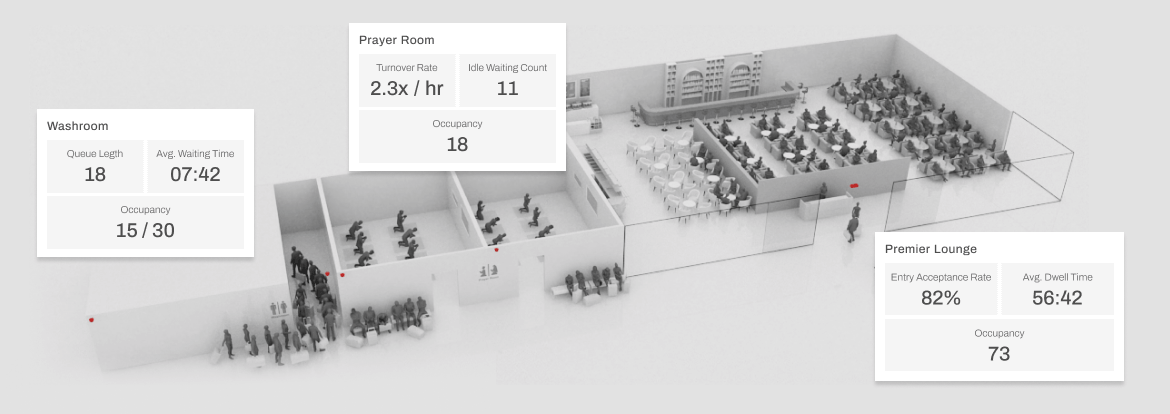
Live Occupancy & Queue Monitor
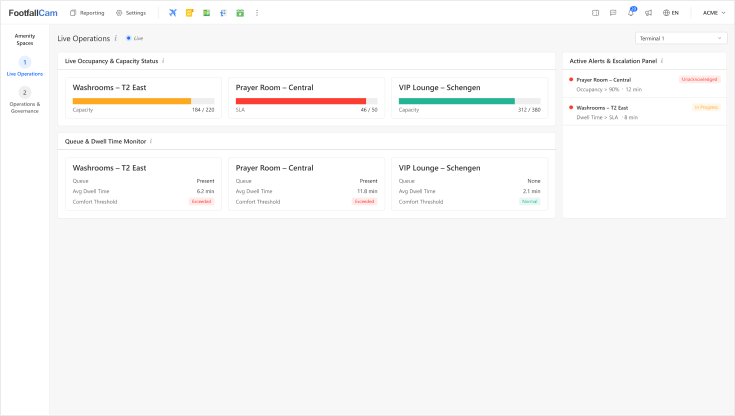
Live Occupancy & Queue Monitor
Each amenity space is measured individually to highlight real-time conditions:
- Occupancy level versus comfort thresholds
- Queue presence and waiting duration
- Dwell time behaviour within the space
- Rate of occupancy change during demand surges
- Localised congestion and spill-back risk
Supports early detection of comfort degradation, allowing operations teams to intervene promptly and prevent downstream passenger impact.
Operational Response Tracking
Operational Response Tracking
Each alert is tracked individually to document operational response:
- Time of threshold breach and alert generation
- Assigned owner and mitigation action taken
- Time to first response and resolution
- Effectiveness of intervention applied
- Recurring response patterns and delays
Supports accountability and continuous improvement, enabling supervisors to assess response discipline and refine escalation procedures.
Utilisation & Demand Patterns
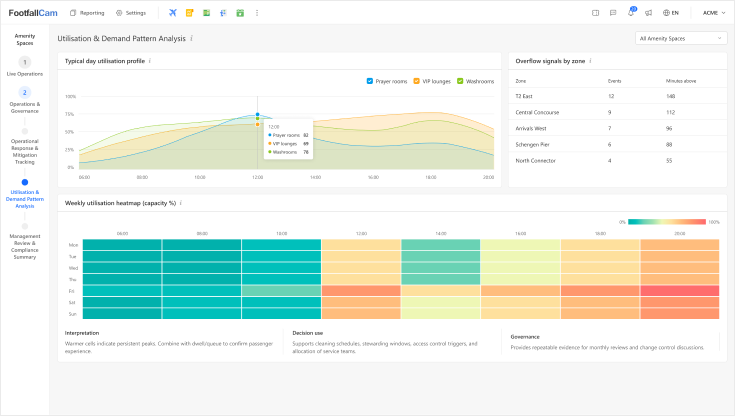
Utilisation & Demand Patterns
Each amenity space is analysed over time to identify demand behaviour:
- Peak and off-peak utilisation profiles
- Frequency and duration of over-capacity events
- Dwell time distribution trends
- Under-utilised capacity windows
- Recurring demand surges by time and location
Supports evidence-based planning decisions, allowing teams to optimise staffing, cleaning cycles, and access policies.
Management Review Summary
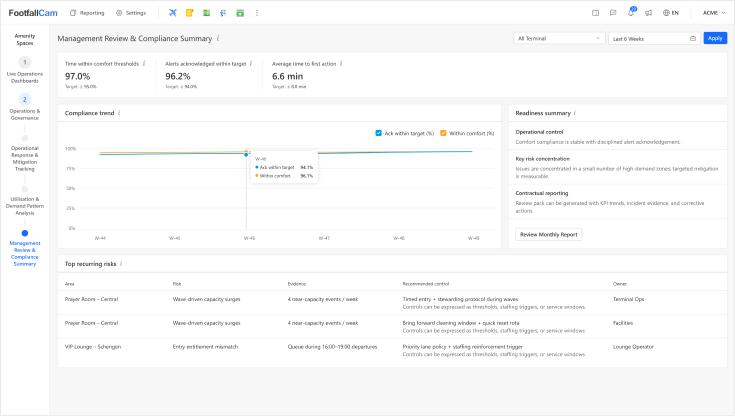
Management Review Summary
Each reporting period is summarised to support governance oversight:
- Compliance with defined comfort thresholds
- Alert frequency and response performance
- Repeated operational risks and hotspots
- Trend comparison across terminals and operators
- Exceptions requiring management attention
Supports structured reviews and audit readiness, enabling management to maintain service standards and operational assurance.
Amenity Spaces, Managed with the Same Discipline as Core Operations
FootfallCam’s Passenger Amenity Spaces solution extends operational visibility beyond checkpoints and processing zones into washrooms, prayer rooms, and premium lounges. It transforms traditionally reactive, comfort-sensitive spaces into measurable, governable assets within the airport operating model.
By providing real-time occupancy, dwell behaviour, and congestion risk indicators, the solution enables airport operators to anticipate pressure, intervene early, and document outcomes, protecting passenger comfort while maintaining terminal flow stability.
Key Metrics Captured at Passenger Amenity Spaces
Queue Presence & Length
Detects queue formation and growth at entrances before visible spill-back occurs.
Average Dwell Time
Measures passenger stay duration to identify congestion, queuing, or overstaying behaviour.
Occupancy Level
Real-time headcount versus comfort-based capacity thresholds for each amenity space.
Utilisation Rate
Percentage of time the space operates within optimal comfort and service conditions.
Over-Capacity Duration
Total minutes spent beyond defined comfort thresholds within a reporting period.
Alert Response Time
Tracks time taken from threshold breach to first operational mitigation action.
Airport Solutions for Passenger Amenity Spaces
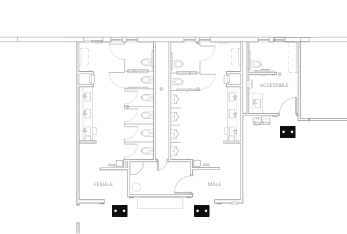
Washroom Entrance Monitoring
Starting at
$800
Approx. 50-150m2 per washroom cluster
- Typical throughput: peak-driven, short-duration surges aligned to flight waves
- 2-6 access points (male / female / accessible)
- Typically 1 device per corridor entrance for accurate IN/OUT occupancy tracking, depending on entrance width and ceiling height
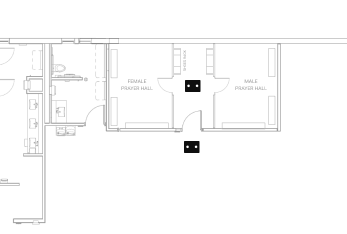
Prayer Room Monitoring
Starting at
$1,600
Approx. 150-600m2
- Typical throughput: time-based surges linked to prayer schedules and flight clustering
- 1–3 entrances with adjacent waiting or overflow zones
- Requires around 1-3 devices (entrance devices for occupancy, corridor devices for dwell and congestion zones)
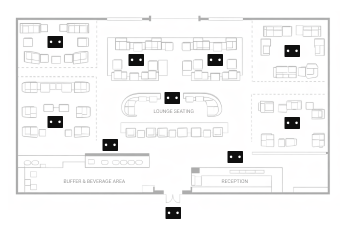
Premium Lounge Monitoring
Starting at
$6,400
Approx. 300-1,000m2
- Typical throughput: entitlement-driven, moderate dwell, high comfort sensitivity
- 1–2 controlled entrances with multiple interior seating and service zone
- Requires around 8-16 devices, depending on store size and ceiling height (entrance devices for entitlement flow, interior devices for dwell, utilisation, and congestion)
Case Study
Passenger Satisfaction Decline
Managing Seasonality Without Overstaffing
Supporting Quality & Compliance
New Terminal Planning Support
Passenger Satisfaction Decline
Case Study 1
Investigating Passenger Satisfaction Decline
Airport profile: Central Europe · Network carrier hub · ~38 million passengers per annum
Situation
Passenger satisfaction scores declined unevenly across certain airlines and time periods, without clear correlation to security or border control performance. Management suspected that non-core areas were contributing to the issue but lacked objective evidence.
Approach
Amenity space analytics were correlated with airline schedules and terminal usage. The airport identified that certain flight banks created temporary congestion in prayer rooms and adjacent washrooms, disproportionately affecting specific passenger segments. Dwell and queue metrics were reviewed alongside complaint data.
Outcome
Targeted mitigation measures were introduced, including temporary access control and adjusted cleaning cycles aligned with flight banks. Subsequent surveys showed improved satisfaction among affected passenger groups. The airport gained a deeper understanding of how amenity spaces influence overall perception, beyond primary processing checkpoints.
Managing Seasonality Without Overstaffing
Case Study 2
Managing Seasonal Variability Without Overstaffing
Airport profile: Southern Europe · Leisure-heavy international airport · ~28 million passengers per annum
Situation
The airport experienced pronounced seasonal variability driven by holiday travel and charter operations. During peak summer weeks, washrooms and prayer rooms became congested for short but intense periods, while the remainder of the day operated comfortably. Historically, the airport responded by increasing staffing and cleaning coverage across entire shifts, leading to elevated operating costs and inefficient resource utilisation.
Approach
Amenity space analytics were deployed to distinguish sustained pressure from transient peaks. Occupancy duration and dwell time metrics were analysed across multiple seasons to identify recurring high-risk windows. Threshold-based alerts were configured only for periods where congestion persisted beyond defined comfort limits. Staffing and cleaning schedules were then adjusted to target these windows rather than full-day coverage.
Outcome
The airport achieved improved comfort compliance during peak periods while reducing unnecessary staffing outside of risk windows. Seasonal cost increases were controlled without compromising passenger experience. Management gained confidence that operational decisions were evidence-based rather than precautionary, enabling more disciplined seasonal planning year-on-year.
Supporting Quality & Compliance
Case Study 3
Supporting Service Quality Audits and Compliance Reviews
Airport profile: Western Europe · Regulated international airport · ~26 million passengers per annum
Situation
The airport faced increasing scrutiny from regulators and airline partners regarding service quality commitments. While core processes were well documented, amenity spaces lacked formal performance evidence. Audits relied heavily on manual inspections and post-event reports.
Approach
Amenity KPIs were formalised, including comfort compliance, response times, and overflow duration. Dashboards were configured to produce periodic summaries suitable for audit and service review. Incident registers provided traceable evidence of mitigation actions and outcomes.
Outcome
The airport improved audit readiness and reduced the effort required to support compliance reviews. Amenity performance became part of routine service reporting, increasing transparency with stakeholders. The data-driven approach reduced reliance on manual inspections and subjective assessments.
New Terminal Planning Support
Case Study 4
Supporting Planning for a New Terminal Opening
Airport profile: Northern Europe · Expanding international gateway · ~30 million passengers per annum
Situation
The airport was preparing to open a new terminal while continuing operations in existing facilities. Planning assumptions for washrooms, prayer rooms, and premium lounges were based on design models rather than observed passenger behaviour. Management required evidence to validate capacity planning and operational readiness.
Approach
Amenity usage data from existing terminals was analysed to establish real-world utilisation patterns. Peak dwell times, overflow frequency, and recovery duration were reviewed across seasons. These insights were applied to refine staffing models, cleaning schedules, and access policies for the new terminal prior to opening.
Outcome
The terminal opened with fewer post-launch adjustments than previous expansions. Early weeks of operation showed amenity spaces operating within comfort thresholds despite higher-than-expected passenger volumes. The airport reduced the need for reactive operational changes and gained confidence in future infrastructure planning.