


Small Retailer


Built for Physical Spaces
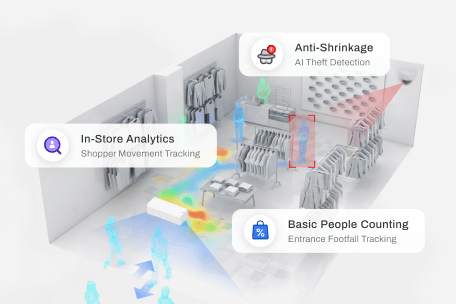
Most analytics tools visualise raw data. V9 visualises real-world behaviour. From live occupancy to movement heatmaps and performance trends, analytics is designed around how people move through stores, buildings, and public spaces.
Analytics Pillars
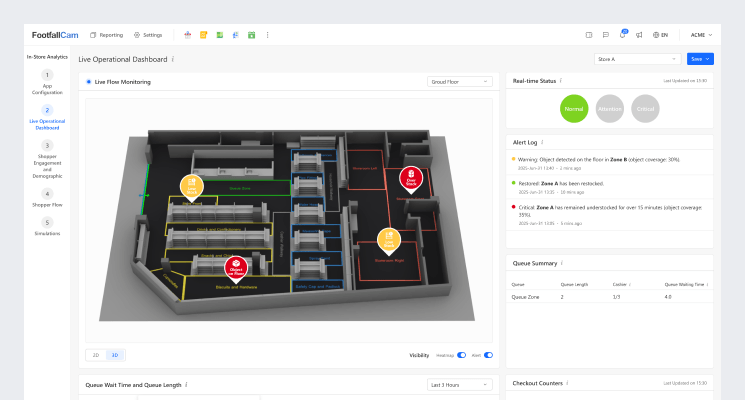
Live Operational View
Monitor what is happening right now. Live dashboards show visitor counts, current occupancy, queue length, and device health across locations. Managers can immediately detect congestion, unusual traffic patterns, or operational issues, enabling faster responses and better control of daily operations.
Live Operational DashboardSpatial Map Intelligence
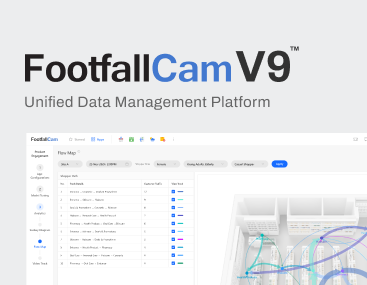
Visualise activity directly on your floorplan. Interactive maps display heatmaps, shopper flows, and zone engagement across physical spaces. Instantly identify busy areas, underperforming zones, and movement patterns that traditional charts cannot reveal.
Shopper Flow Map Dahboard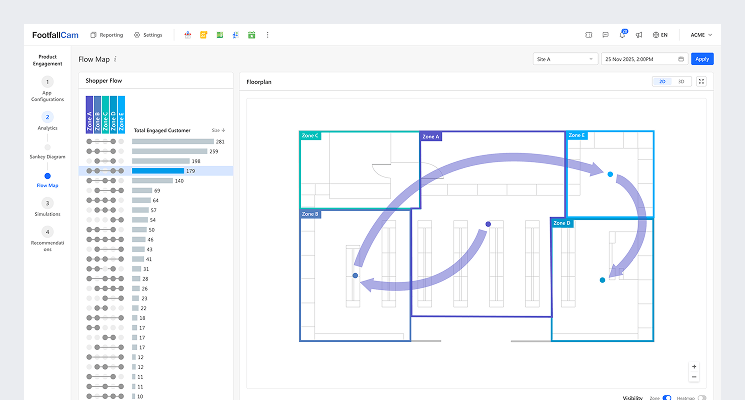
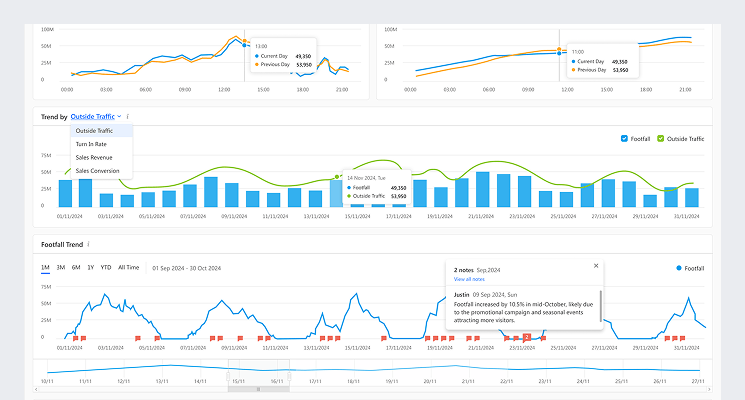
Trend & Pattern Graphs
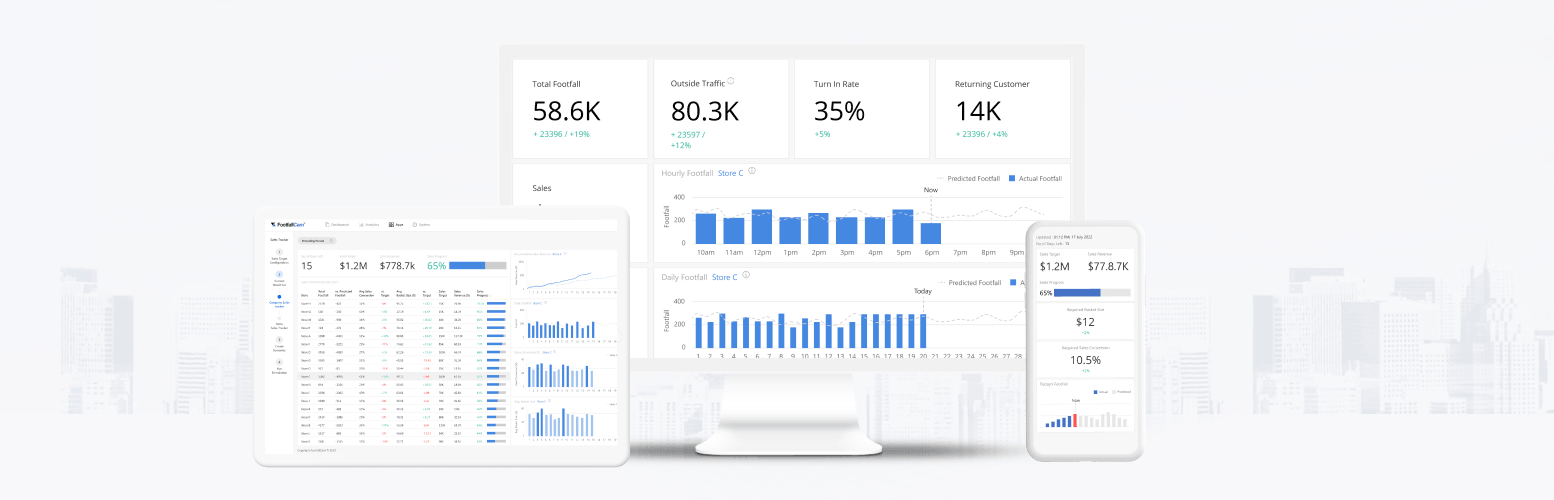
Modern entrance systems provide more than directional counts. Demographic estimation and visit patterns add useful context, allowing retailers to understand not only how many people enter, but who visits and when.
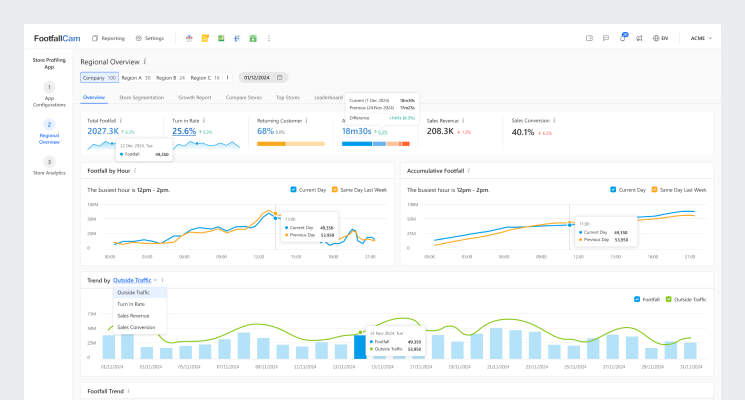
Company Overview DashboardCustom KPI Dashboards
Entrance data becomes meaningful when aggregated across stores. Centralised dashboards reveal seasonal trends, marketing impact, and store performance comparisons, allowing managers to evaluate operational decisions using consistent traffic intelligence.
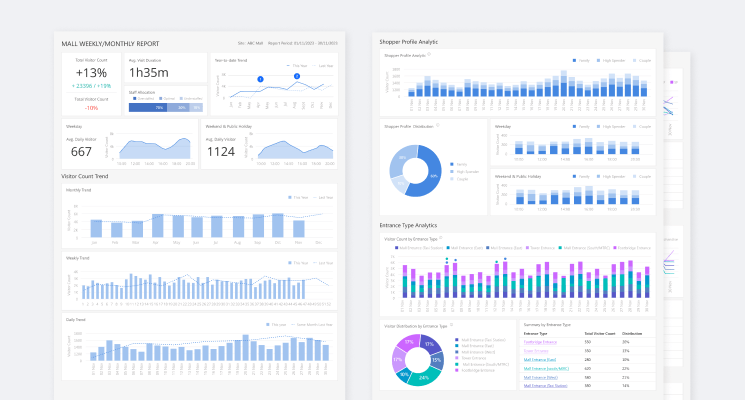
Automated Business Reports
Generate structured reports for management and stakeholders. Daily, weekly, or monthly summaries highlight key performance indicators, traffic patterns, and operational insights. Reports can be exported, shared automatically, or integrated with enterprise reporting tools for deeper analysis.
Designed for People Flow
Traditional analytics tools analyse numbers. V9 analyses movement, space usage, and real-world behaviour. It transforms sensor data into visual insights that operations teams can understand instantly.
Movement
Space
Behaviour
Ready for Enterprise Reporting
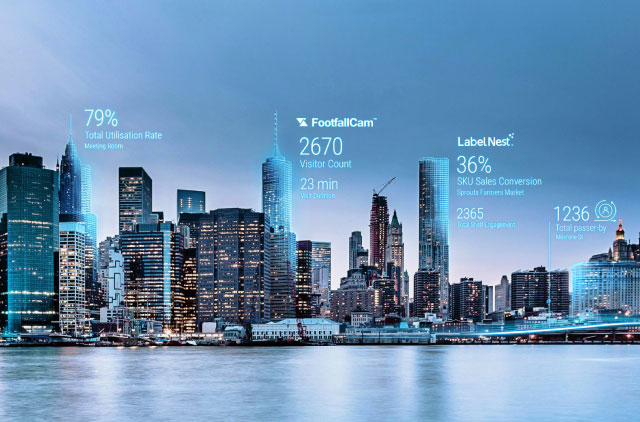
V9 turns raw operational data into refined metrics and KPIs, ready for export to enterprise BI platforms. Use these insights for corporate reporting, forecasting, and cross-business analysis, helping teams and executives make informed, data-driven decisions across multiple locations or business units.
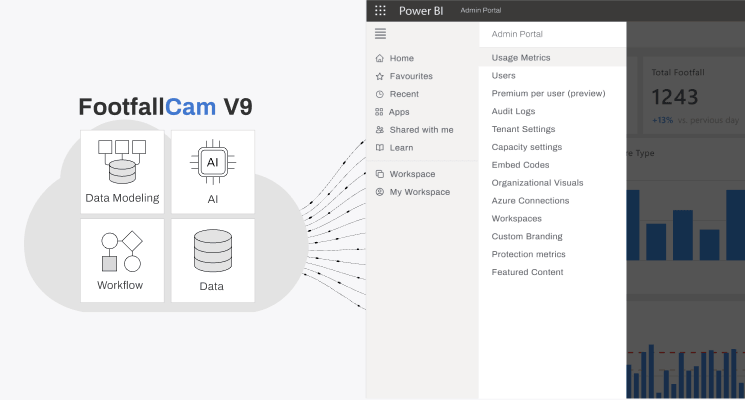
Flexible Visual
Widgets
Operational analytics inside V9 prepares the data. Export refined metrics and KPIs to enterprise BI platforms for corporate reporting, forecasting, or cross-business analysis.