In a fast-food environment, speed is everything. Long queues, kiosk abandonment, or an unbalanced kitchen workflow can directly translate into lost revenue and frustrated customers. To stay competitive, restaurant operators need real-time visibility into customer journeys and operational efficiency — from the moment a guest approaches a kiosk to when they collect their meal.
Key Challenges
- Kiosk Abandonment – Customers start an order but drop off midway, often due to unclear UX, long queues, or complex menus.
- Queue Bottlenecks – High throughput locations suffer from unpredictable rushes, leading to longer wait times and increased walkouts.
- Counter-to-Kitchen Imbalance – Orders pile up unevenly across kitchen stations, overwhelming staff and delaying service.
Core Functions
1. Kiosk Conversion Funnel Analysis
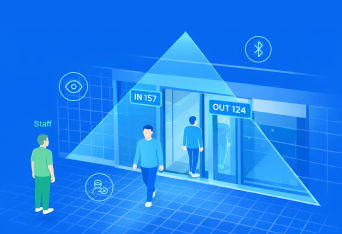
- Track how many customers approach, start, and complete an order at the kiosk.
- Identify drop-off points in the ordering process.
- Pinpoint issues with menu navigation or payment delays.
- Benchmark conversion rates across locations.
2. Zone Engagement Heatmaps
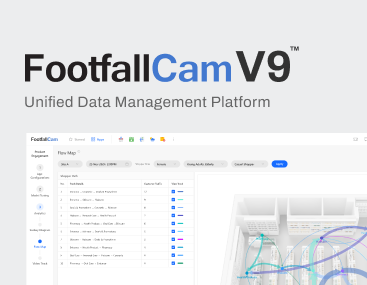
- Visualise customer flow in the restaurant.
- Understand whether customers head to kiosks, counters, or pickup points.
- Redesign layouts to improve accessibility and reduce congestion.
- Optimise staff placement based on actual engagement zones.
3. Queue Abandonment Tracking
- Measure how many customers leave after joining a line.
- Detect pain points at ordering or pickup counters.
- Quantify lost revenue due to long wait times.
- Trigger real-time alerts when queues exceed SLA thresholds.
Service Efficiency Optimisation
1. Queue Length and Waiting Time Monitoring
Continuously track queue buildup at kiosks, counters, and pickup stations.
→ Action: Alert staff when SLA thresholds are breached to prevent abandonment.
2. Counter-to-Kitchen Load Balancing
Analyse order handoff volume and staff distribution across kitchen workstations.
→ Action: Reassign staff in real time to balance workloads and maintain speed of service.
Kiosk Usage vs Drop-Off Rates
- Measure how many customers use kiosks vs counters.
- Track abandonment trends across time of day and demographics.
- Use insights to simplify menu design or deploy staff assistance during peak hours.
Business Impact
- Reduce Lost Sales: Minimise kiosk and queue abandonment.
- Boost Throughput: Serve more customers in peak periods without sacrificing experience.
- Optimise Staffing: Shift from guesswork to data-driven workforce allocation.
- Enhance Customer Experience: Faster service times = stronger loyalty and repeat visits.
See the live blob in action at a fast-food restaurant — watch the video on our YouTube here: Fast Food Restaurant Live Blob Showcase
#footfallcam #peoplecounter #peoplecounting #QSR #fastfood #restaurants #retailanalytics #customerexperience #dataanalytics

