Occupancy Monitoring and Management
Real Time Crowd Monitoring
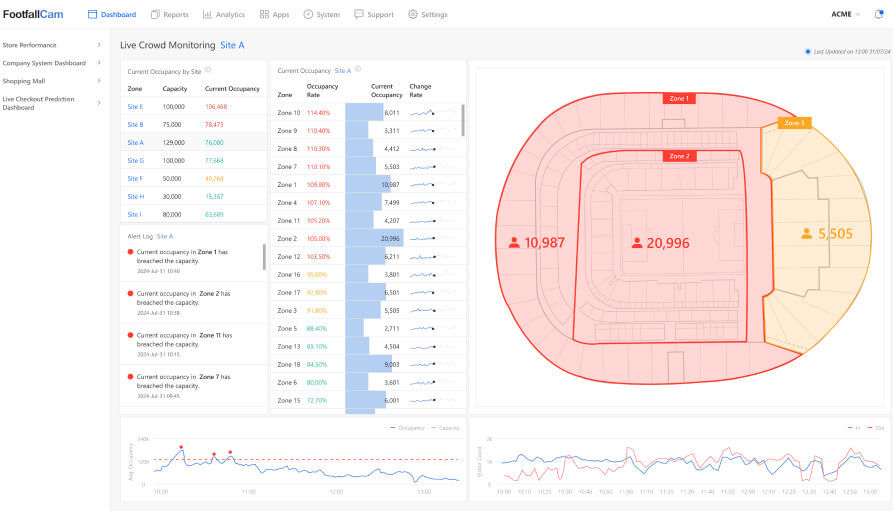
Real Time Crowd Monitoring
Offers live data for real-time response, a rule engine for customised alerts, and the ability to drill down into different areas for detailed inspection
Detailed Hotspot Analysis
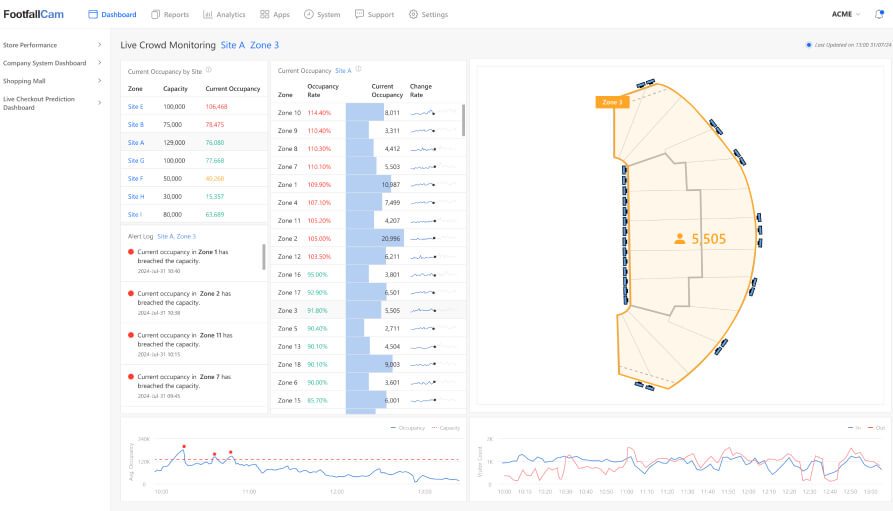
Monitor the visitor flow across all gates in real-time from the Command Centre
Provides live occupancy per area, enables drill-down into congested zones, monitors traffic flow, and facilitates traffic flow management.
Footfall Management Review Report
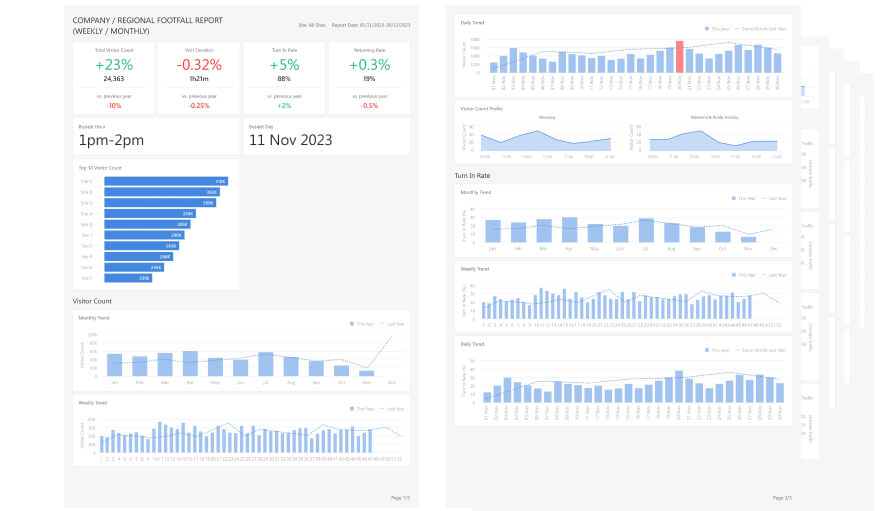
Analyse Visitor Behaviour: Gain insights into visitor patterns, including peak hour and busiest entrances.
Review historical data to understand visitor trends, identify areas needing improvement, and assess overcrowding to optimise staff allocation and enhance visitor flow and experience.
Occupancy Management Review Report
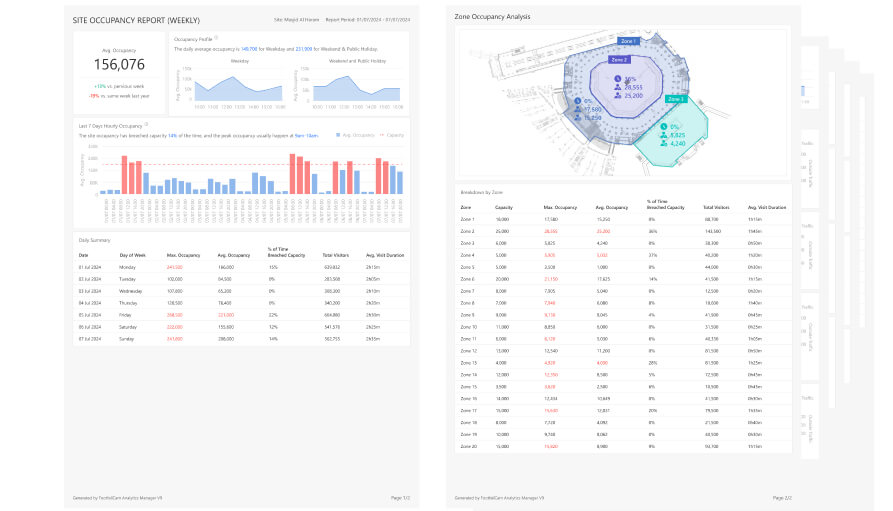
Evaluate occupancy levels, identify the busiest days, and measure visit duration.
Analyse historical occupancy trends, identify crowded zones, review capacity usage, and ensure compliance with reports for authorities.
Event Performance Evaluation
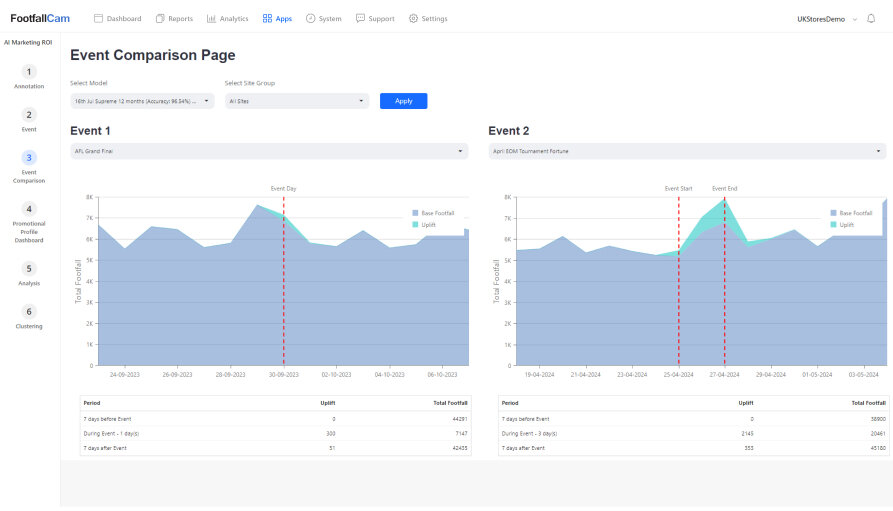
Workspace for Occupancy Management and Event Performance Evaluation
Analyse occupancy trends, assess intervention impacts, and compare event performance. Generate reports for internal review and submission to authorities, ensuring effective occupancy management.
Event Effectiveness Review
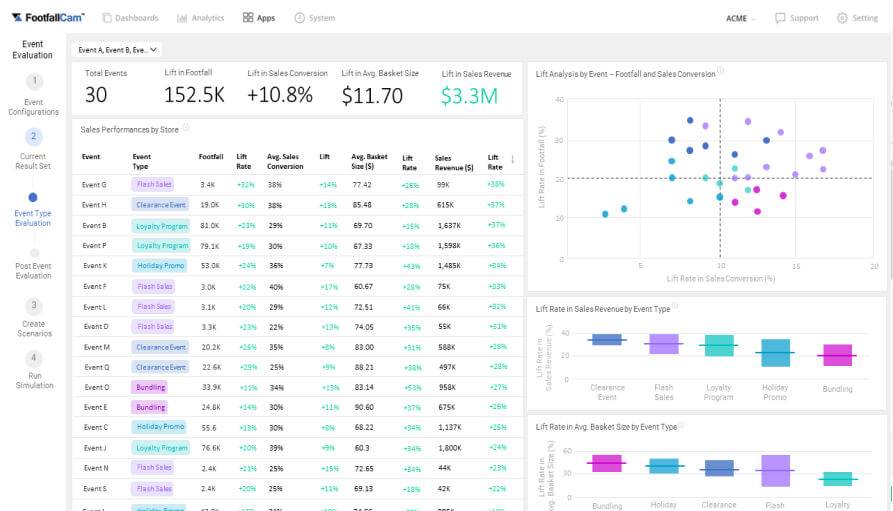
Event Footfall and Occupancy Analysis
Evaluate differences in footfall and occupancy levels across events. Analyse marketing impacts on traffic to key zones, assess campaign effectiveness, predict future ROI, and optimise strategies using historical data.
Rule Engine
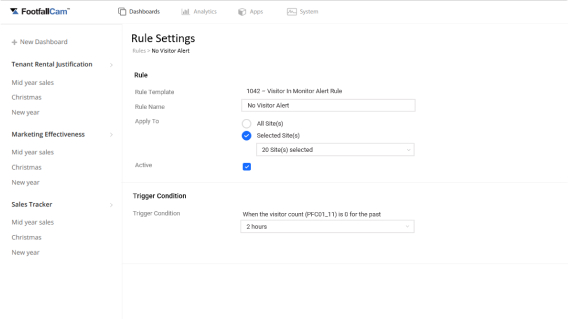
Real-time Alerts with Rule Engine
Powered by an advanced rule engine, this feature delivers immediate notifications based on predefined criteria and dynamic conditions. Continuously monitoring occupancy data, it triggers alerts when thresholds or anomalies, such as crowd limits or sudden congestion, are detected. By integrating these alerts into the operational workflow, stadium stewards receive timely updates, enabling prompt responses to emerging situations. This proactive approach enhances crowd safety and operational efficiency. The rule engine's flexibility allows for customisable alert parameters, tailored to different scenarios and event types, ensuring optimal responsiveness and control.
Rule EngineAnalytics Features
Aid retailers in customising data views with drill-up and drill-down capabilities
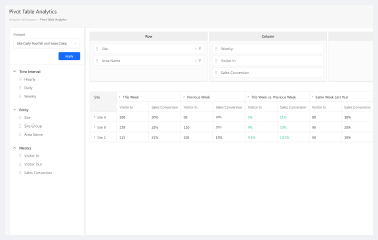
Pivot Grid
Provides flexibility to drag and drop business metrics into an unified view and slice-and-dice the data to explore and analyse it from multiple dimensions.
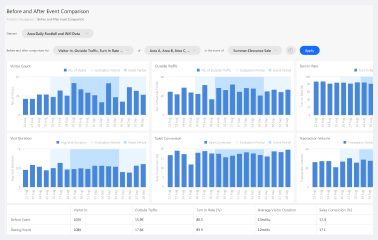
Analytics Centre
Create widgets with desired business metrics and customise reports or dashboards using mix-and-match widgets available, save the customised view for future usage
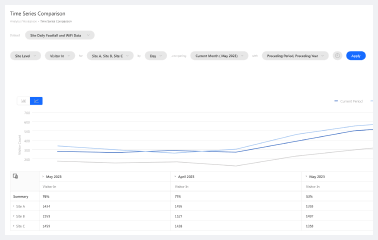
Time Series Comparison
Particularly valuable during festive seasons, analyses footfall patterns between current and preceding periods, using various data granularity levels.
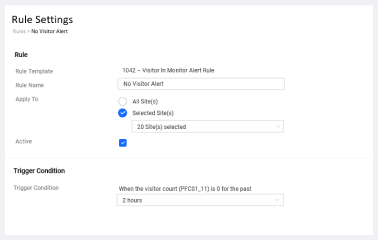
Rule Engine
Use rule engine to configure thresholds, notifications, and business rules for automated real-time alerts
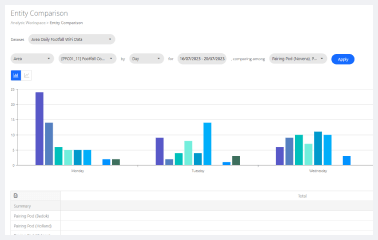
Entity Comparison
A tool to compare and analyse data from different entities, identifying similarities and differences for insights.
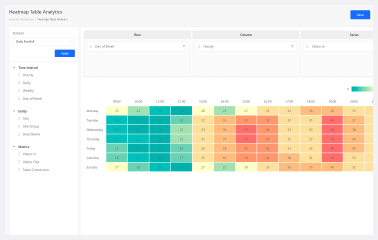
Heatmap Table
Visually represent data with colour-coded intensity, enabling quick understanding of footfall patterns, trends, and relationships within the dataset.

