


1.1 Footfall Counting
Different counting algorithms are used under different circumstances. The types and difference of the several algorithms used by FootfallCam are stated in the following sections.
1.1.1 Standard 3D Algorithm
Under normal circumstances, FootfallCamTM uses a standard 3D algorithm to count at its optimal level. The most optimal height for FootfallCamTM is 2.5m to 4.5m.
Standard 3D Algorithm works by:
-
Differentiating between human's head and shoulder point, forming a 3D blob and trail line that tracks their movement.
-
It will exclude a person that makes a U-turn and did not enter the store from being counted by using a start-end zone.
-
It will differentiate between kids, adults, inanimate objects through height detection and form a depth map.
-
It can work well in cases of high traffic since the blob and head point will be clear.
-
It may apply an exclusion line at a specific part of the tracking line which is frequently used by staffs to avoid the counting of staffs.
1.1.2 Area Counting Algorithm
The Area Counting algorithm functions by using 3D Blob Tracking Technology to trace every individual person in an area to support multiple counting when more than one person enters the zone. It also prevents over counting of an individual. The algorithm automatically tracks the duration (adjustable) a person enters the zone and once the person exceeds the threshold of duration, the person will be considered as In, if the person leaves the zone, it will be considered as Out.
Area Counting is mostly suitable for
- Stores with no specific entrances. This means that any visitor can enter and exit from any direction of the store.
- Stores where the visitor would walk in a random pattern rather than just In and Out. This is usually caused by the stock displays near the counting area, causing visitors to interact with the displays.
- Tracking area is very limited and does not have enough walking distance for standard 3D counting algorithm to work fine.
Limitation of Area Counting
- Exclusion line is not applicable as it does not use counting line.
1.1.3 Data Collection
For standard 3D algorithm, once a visitor entered and exited the tracking zone of a device while triggering the in-out line in between will trigger the counting. As for area counting, once a visitor has been staying in the tracking zone of a device longer than the set threshold, that will trigger the counting.
The data will then be saved in the following form:
| Device Serial | Timestamp | Line ID |
| 00000000xxxxxxxx | 12/2/2017 1:00pm | 1 |
| 00000000xxxxxxxx | 12/2/2017 1:03pm | 1 |
| 00000000xxxxxxxx | 12/2/2017 2:09pm | 2 |
Device serial indicates from which device is the data from, timestamp indicates when a visitor is being counted and line ID indicates which line was triggered by the corresponding visitor.
1.1.4 Data Upload Process
The data collected by each device is then uploaded to the server at a 15-minutes interval which will be cleared after 7 days. However, the data uploading process is very dependent on the internet connection of the site. If the speed is slow, data upload speed will also be slowed down which further affect data display in reports.
Once the data has been uploaded to the server, it will later be aggregated into hourly and daily basis depending on the requirement of the report of a specific area or site. Aggregated data will not be deleted until the device is deallocated from its site.
Data Processing, Personal Data and Data Subjects
1. Processing by the Contractor
1.1 Subject Matter of Processing:
The processing covers video analytics data generated by FootfallCam devices installed within the client's premises. All video processing operations are performed entirely on the edge device. The processed output is strictly aggregated statistical data (e.g., footfall counts, dwell time distributions, browsing metrics) and contains no personal or identifiable information.
1.2 Nature of Processing:
The processing involves real-time computer vision algorithms such as object detection, tracking, and counting. These operations are transient and memory-resident only--raw video frames are not persistently stored, transmitted, or used for external training. The only data outputted from the device are numerical aggregates and timestamps representing anonymised behavioral metrics.
1.3 Purpose of Processing:
The purpose of the processing is to generate anonymised business intelligence metrics for occupancy analytics, queue management, and space utilisation. No facial recognition, biometric profiling, or re-identification is performed or supported. All analytics are compliant with GDPR principles of data minimisation and purpose limitation.
1.4 Duration of the Processing:
Video data is processed in real time and immediately discarded post-processing. Aggregated statistical results are retained only for the duration necessary to meet contractual analytics objectives, after which they are securely deleted or anonymised.
2. Types of Personal Data
No personal data is collected, processed, or stored. All outputs are anonymised, aggregated statistics such as count values, event durations, and activity timestamps. Even if the device were compromised, there are no images, videos, or personal identifiers retrievable.
3. Categories of Data Subject
None. The system design ensures that all individuals remain anonymous. The analytics are derived solely from aggregated motion and object-level metadata, not from identifiable personal data.
GDPR Compliance and Security by Design:
-
All processing occurs on-device (edge computing). No live video feeds or personally identifiable data are transmitted to external servers.
-
Only system administrators under strict role-based access control can enable temporary upstreaming of masked video clips for diagnostic or verification purposes. Such operations are logged, auditable, and restricted to authorised maintenance personnel.
-
The system architecture implements encryption in transit (TLS 1.3) and at rest (AES-256) for all control and telemetry channels.
-
FootfallCam does not use customer data for model training or any other secondary purposes. The customer remains the sole data owner.
-
Aggregated data is hosted within secure data centers that adhere to ISO 27001, SOC 2, and GDPR compliance frameworks.
This structure ensures complete alignment with privacy-by-design and security-by-default principles, providing technical reassurance for IT architects reviewing system compliance.
Processing, Personal Data and Data Subjects
1.1.5 Sales Conversion
Sales Conversion is a simple matter of dividing the number of transactions that are made within a period of time by the visitor for the store in that same time period. This result allows the manager to see a deeper insight of the store performance. For example, high footfall will mean the store is attracting a lot of customers from outside traffic but a low conversion rate will indicate that it is not doing a good job of maximising sales opportunities.
1.1.6 Metrics Codes
The key metrics used for footfall counting will be:
-
PFC01 - Footfall Count IN
-
PFC02 - Footfall Count OUT
-
SFC03 - IN OUT Discrepancy
-
PFC07 - Total Transaction Count
-
PFC08 - Total Sales Volume
-
SFC09 - Visitor Count to Sales Conversion
1.2 Wi-Fi Analytics
Besides the counting, which is triggered by the tracking algorithm, there is also counting which can be triggered by Wi-Fi signals.
1.2.1 Data Coverage
The Wi-Fi module in Footfall Counter works like any other Wi-Fi-enabled device as it can pick up Wi-Fi signal from other Wi-Fi enabled device nearby. The Wi-Fi module can collect the Wi-Fi signals emitted by the Wi-Fi-enabled devices within the radius of 100m. However, the actual working range might be reduced due to the setup of the internal walls in the stores.
Smartphones which do not have their Wi-Fi capabilities switched off are either connected to a Wi-Fi access point or searching for one to connect to. To do so, they emit Wi-Fi messages -- if connected, transmitting data messages, and if searching, probe messages that signal an access point to respond. The frequency of these signals varies, depending on smartphone vendor and device status, but in general, they average two to nine signals each minute.
1.2.1.1 About MAC Randomization & How they are detected
MAC Randomization has been a part of the network industry for a while and involves changing a device's MAC address when it sends out Probe Requests. This helps prevent the tracking of unconnected devices. However, this is changing with the release of the latest operating systems such as iOS 14/WatchOS 7, Android 10+, and some versions of Windows 10. These systems now randomize MAC addresses not only during the discovery phase, but also while the device is connected to the network.
For smartphones that are equipped with MAC Randomization technology, it will not affect the counting accuracy of data generated through means of Wi-Fi analytics. The randomization of the MAC Address will only affect mobile devices that are not connected to a mobile network. In addition, when the MAC Address is randomized, it is turned into a meaningless MAC Address that is different from genuine MAC Address.
Recognizing randomized MAC addresses is simple. The OUI section of a MAC address has a set bit to indicate a randomized or locally administered address. Simply check the second character in a MAC address and if it's 2, 6, A, or E, it's a randomized address. For instance, the Wi-Fi address 92: B1:B8:42: D1:85 is randomized because its second character is 2. Our footfall counter will filter out the meaningless MAC Addresses that are picked up by the Wi-Fi sensor and exclude it from the counting data.
1.2.2 Statistical Sampling
The main function of Wi-Fi counting is to use Wi-Fi signals emitted from visitors' smartphones to approximate the traffic flow of people within a given area. However not every person carries a smartphone, and some people may carry more than one Wi-Fi devices such as iPads.
Our Wi-Fi counting algorithm can overcome the above limitations and provide an accurate traffic approximation by using Statistical Sampling. This ensures that even if not every visitor will contribute to Wi-Fi data since not every visitor will carry a mobile phone, these users are a small proportion of the total number of visitors and does not contribute to a large margin of error.
Statistical Sampling is widely used in many different industries such Television Rating and Election Polling. The Nielsen Company uses sophisticated sampling techniques to measure and report on ratings and viewership in the television industry around the world. In the United States, for example, the company selects homes in which to install small devices that monitor viewing habits.
Another example was used in election poll. Opinion polls for many years were maintained through telecommunications or in person-to-person contact. Methods and techniques vary, though they are widely accepted in most areas. Some polling organizations, internet survey, where a sample is drawn from a large panel of volunteers and the results are weighted to reflect the demographics of the population of interest.
1.2.3 Wi-Fi Data Normalization
Normalization is often used to convert the statistical data into real life numbers; for example, normalization factor is applied to the number of Wi-Fi devices detected to convert it into the number of people in the area.
By correlating the number of people walking into the site using Video Counting and the number of Wi-Fi devices detected to have walked through the door, the counter uses the last two week's data to build a statistical profile and approximate the percentage of people carrying smartphones.
This statistical model is counter based; that is each counter has its own statistical model which is auto tuned based on the demographics of the people and its surrounding Wi-Fi characteristics.
1.2.4 Data Collection
The data which has been collected will then be saved into our database, including device serial, signal strength, Mac address and timestamp.
Below is the data collection method of Wi-Fi data:
-
The Wi-Fi data will be collected from the crowd around the location where the device is installed.
-
Wi-Fi dongle plugged in the device will be the module that constantly grabs the Wi-Fi signal sent by the Wi-Fi enabled devices such as smartphones, tablets etc.
-
Mac ID is processed in the device with the signal strength and timestamp as the table shown:
|
Hashed Wi-Fi Mac Address |
Detected Time |
Signal Strength |
|
aaa |
12/2/2017 1:00pm |
-65 |
|
bbb |
12/2/2017 1:03pm |
-66 |
|
ccc |
12/2/2017 2:09pm |
-100 |
The raw MAC address of these devices will be stored in the database and constantly uploaded to the central server (every hour) for further aggregation in the reporting. FootfallCam gathers this data, and then forwards it securely to the FootfallCam Cloud in hourly basis for processing and analysis.
The hashing algorithm for MAC address used is PBKDF2WithHmacSHA256, which is designed for password hashing hence it is a slow algorithm. This is good for password hashing as it reduces the number of passwords by second an attacker could hash when crafting a dictionary attack. Having a salt added to the password reduces the ability to use precomputed hashes for attacks and means that multiple passwords have to be tested individually, not all at once. The standard recommends a salt length of at least 64 bits. The US National Institute of Standards and Technology recommends a salt length of 128 bits, and FootfallCam is using 256bits in this instance.
1.2.5 Data Processing and Classification
As data streams into the FootfallCam Cloud hourly, all detected devices are classified in a time series database, with robust algorithms applied to profile all detected devices and further classified the data in a few values:
-
Differentiate the Mac ID collected as "walk by" and "entered into store" by the signal strength Wi-Fi probes and confidence.
-
Further map "visit duration" by get the "first seen" and "last seen" with the condition highest signal strength detected from probes received at 2 different time stamps.
Signal strength alone is a crude approximation method and is inaccurate, as Wi-Fi signals tend to vary in different environmental settings. Additionally, signal strength is dependent on many real-time environmental conditions.
Adding with the number of probes, timestamp, confidence level, and the threshold will increase the accuracy of the Wi-Fi data. There are two Wi-Fi thresholds: threshold 1 filter weak signal that far away from the counter. Threshold 2 capture strong signal strength which is in store traffic. All probe request details below threshold 1 will be stored in a raw mac database table in the device. Server side will process the mac address list to calculate dwell time and returning customer values by aggregate the daily data to the analytics.
1.2.5.1 Multiple Counters Installed in a Store
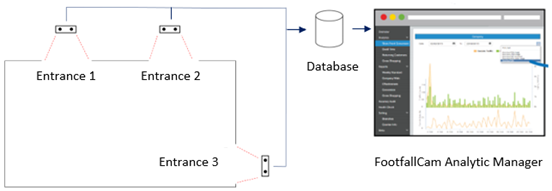 When there are multiple counters installed in a single store, the counting data from the counters will be uploaded into the database for further processed to prevent the over counting of a single individual. This process will ensure that the counting data generated by the FootfallCam will be genuine and ready for further analytical processing by the user's business intelligence system.
| Counting Data | Counter 1 + Counter 2 + Counter 3 |
When there are multiple counters installed in a single store, the Wi-Fi counting data will be uploaded to the central database in order to filter out duplicate entries of MAC addresses. The duplicated MAC addresses will not be used in the aggregation of the data. This method prevents the over counting of a single MAC address from being counted twice.
| Wi-Fi Data | Counter 1 + Counter 2 + Counter 3 |
 When there are multiple counters installed in one wide entrance, the tracking zone and counting lines will need to be drawn conservatively. The tracking zone and counting lines drawn on one counter must not overlap the counting zone and tracking lines drawn on another counter. This is necessary in order to prevent the over counting of visitor data, while can lead to inaccurate visitor count and falsified sales turn in rate data.
1.2.5.2 Staff's Device MAC Address Exclusion
If the staff is carrying devices with WiFi turned on, it's MAC address also will be captured by footfall devices as well. You may manually exclude the staff's devices MAC address at the site page. Refer Part 15.5 for step-by-step guide.
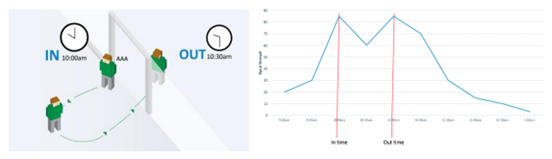
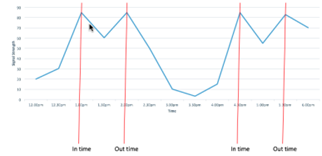
1.2.5.3 Average Visit Duration
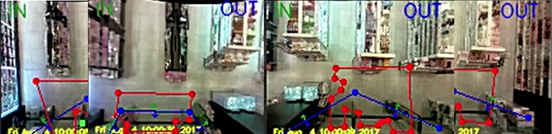
We can obtain the customer visit duration by using the 2 peaks of the Wi-Fi signal strength, as they are the nearest location from the entrance with device installed. If the profile has two peaks that are above a defined signal strength threshold, they are identified as the IN time and the OUT time of the visitor.
Maximum visit duration - Some visitors may visit the site multiple times in the same day. Maximum visit duration is the maximum reasonable visiting a visitor can expect to stay on the site for one single visit. The default value is 2 hours.
For example,
Visitor A: first visit => 1:05pm to 1:30pm second visit => 4:05pm to 5:43pm
Result: 2 visits. The first visit is 25 minutes. The second visit is 98 minutes.
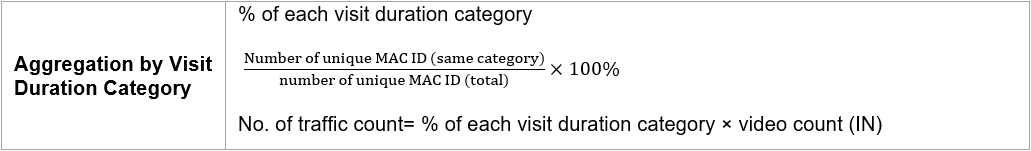
First, visit duration is measured based on unique identifier (MAC ID probes) from user's smartphone.
|
Visit Duration |
Time (In) − Time (out) |
Condition:
-
Defining the boundary of Wi-Fi tracking
-
Excluded Staff list and Device List
Aggregation of Visit Duration Categories
FootfallCam further classified the visit duration data collection into 3 categories. By default, there are 15 minutes below, within 15 minutes to 30 minutes and above 30 minutes.
Visit Duration for Sites with Multiple Counters
By uploading the Wi-Fi tracking information of all devices of Site Entrance to a central server, the server would carry out the analysis and estimate the IN and OUT times of the Wi-Fi devices. The system would aggregate the Wi-Fi tracking information from all counters within the site.
1.2.6 Wi-Fi Metrics Codes
The key metrics used for Wi-Fi Module will be:
-
A05 - Outside Traffic
-
B01 - Turn-In Rate
-
A04 - Average Visit Duration
-
B02 - Returning Rate
1.3 Space Occupancy
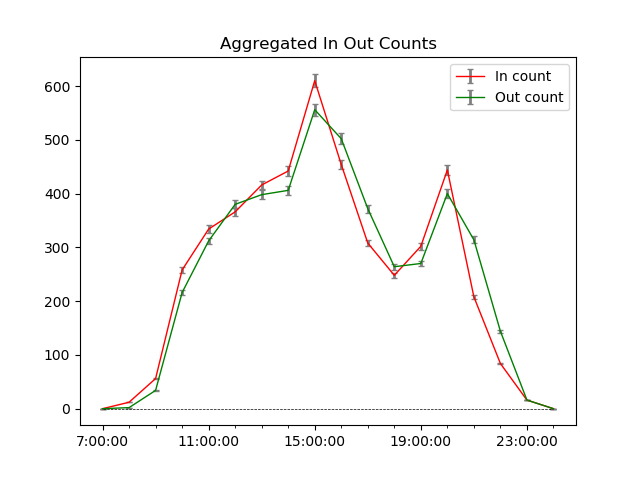
Space occupancy is the number of people stayed in a site at a given time. It is equivalent to Accumulative IN count deduct Accumulative OUT count.
|
Occupancy |
(Accumulative IN − Accumulative OUT) |
Accumulative IN count is the summation of all IN count from the start of the operating hour to the current time. This data is updated instantaneously. Likewise for Accumulative OUT count.
1.3.1 Accumulative Error
No people counter is 100% accurate. It would have accumulative errors as the day goes on.
1.3.2 Occupancy Modes
There are two occupancy modes: Naive Occupancy and Smart Occupancy.
| Comparisons |
Naive Occupancy | Smart Occupancy |
| Formula | IN - OUT | IN - OUT + error correction |
| Error correction | × | √ |
| Requires history data sample collection | × | √ (automatic) |
| Real time dashboard | √ | √ |
| Historical data report | √ | √ |
| Site level metric | √ | √ |
| Area level metric | √ | √ |
| Accuracy | High | Higher |
| Sum of area level data equal branch level data | √ | × (see note) |
| Modes | × | Mode 1 & Mode 2 |
| Details | Section 15.3.1.4 | Section 15.3.1.5 & Section 15.3.1.6 |
1.3.2.1 Recommended Use Cases
Generally, Smart Occupancy is the preferred option for almost all situations except low traffic volume sites.
| Use Cases | Naive | Smart |
| Supermarkets or grocery stores with high traffic volumes | × | √ |
| Toilet occupancy | × | √ |
| Restaurants or canteens | × | √ |
| Occupancy capacity control via dashboard or automatic gate | × | √ |
| Library or jewellery shops with low traffic volumes | √ | × |
| Exhibitions | × | √ |
| Cinemas | × | √ |
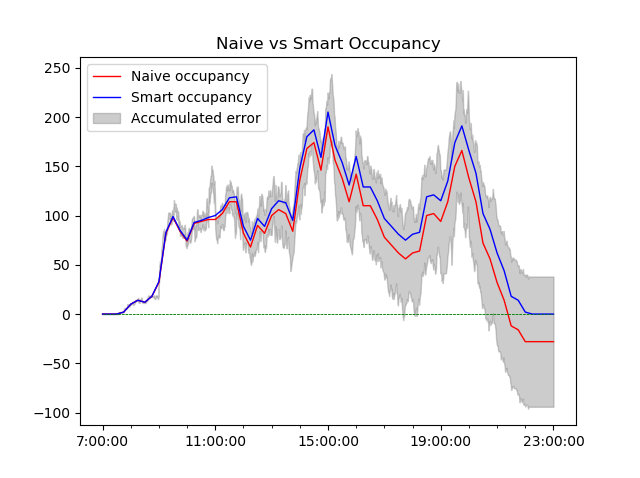
1.3.2.2 Naive Occupancy
Occupancy graph generally looks like a bell shape curve, with occupancy peak somewhere in between the operating hours. Some may have multiple peaks, indicating multiple peak hours.
Due to accumulative error, Naive Occupancy can have significant error towards the end of operating hours.
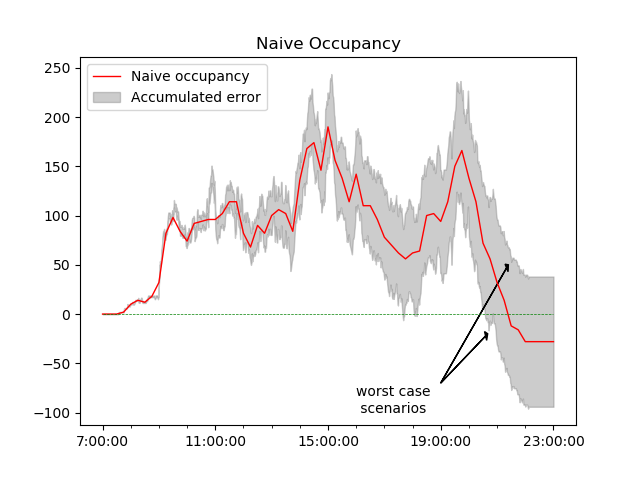
Naive Occupancy = IN - OUT. Accumulated error grows as the day goes by.
1.3.2.3 (Smart Occupancy) Real Time Error Correction
Since occupancy is updated instantaneously and shown on Live Occupancy Dashboard, real time error correction is applied to Naive Occupancy to minimize the accumulated error. This ensures that:
-
Occupancy is more accurate towards the actual count
-
Occupancy never drops beyond 0 to negative numbers
-
Occupancy approaches close to 0 at the end of operating hours
Behind the scenes, the system uses Advanced AI modelling to encapsulates the occupancy trend from the past 14 days or more and generates a predictive model that accurately reduces the accumulative occupancy error.
|
Live Occupancy |
Naive Occupancy + Real Time Error Correction |
There are 2 modes for Smart Occupancy.
| Mode 1 | Mode 2 |
| Uses Advanced Statistical Modelling to generalize occupancy patterns of a site/ area. | Expires the occupancy of a person if exceed the configured expiry period. |
| Does not require user input. | User has to set expiry period. |
| Requires collection of historical data (automatic). | Does not require collection of historical data. |
| Suitable for high traffic volume sites, eg: grocery stores, supermarkets, restaurants, exhibitions. | Suitable for situations where visit duration is known and quite constant, eg: toilet occupancy, cinema occupancy. |
1.3.2.4 (Smart Occupancy) Post Processing Error Correction
For occupancy of previous day data in Space Occupancy Report, post processing error correction is applied to Occupancy based on the overall daily In Out discrepancy. This has the same effects as Real Time Occupancy Error Correction, except that it is now in post processing.
|
Historical Occupancy |
Live Occupancy + Post Processing Error Correction |
1.3.3 Metrics Codes
The key metrics used for Space Occupancy will be:
-
PSO01 - Naive Occupancy
-
SSO02 - Occupancy vs. Capacity
-
PSO05 - Smart Occupancy
1.4 Group Counting
Group counting identifies one or more individuals as one collective unit and clusters them together. The tracking trajectory of individual is being analyzed with respect to other individual, and advanced filtering logic based on person-to-person distance threshold, trajectory speed, direction, and duration, are applied to ensure accurate group counting.
Group counting opens up possibilities for better data and metrics:
-
In retail, 1 family group is considered as 1 purchase unit. Group counting provides more accurate sale conversion metric.
-
For queue waiting times calculation, 1 couple pair is considered as 1 waiting unit. Group counting provides more accurate waiting time metric.
Requirements:
-
Applicable to counter firmware v3.4.2 and above, which is upgradable from minimum v3.3.0.
-
Group counting is currently available to standard footfall counting only. It is compatible with staff exclusion. Availability to area counting, queue counting and heatmap counting are still work in progress.
Group counting is designed to work alongside with other counting algorithms as an add-on separate processing.
This means, if the counter is configured for standard entrance counting + group counting, there will be 2 separate sets of data collected:
-
entrance counting data
-
additional group counting data
For example, if there is 1 visitor coming in through the entrance, counter will collect both:
-
1 visitor IN
-
1 group IN
Therefore, it is not advisable to combine standard footfall counting data and group counting data as it will cause data duplication.
1.4.1 Grouping Logic
In group counting, clustering algorithms are adopted to process the 3D location coordinates of people appeared in the tracking zone and generate groups of people who stay close to each other. A distance threshold is used to govern the grouping logic such that a person will be assigned to an existing group if the relative distance of the person from the group is within the distance threshold. Below are two example scenarios that illustrate how groups are formed when group counting is running.
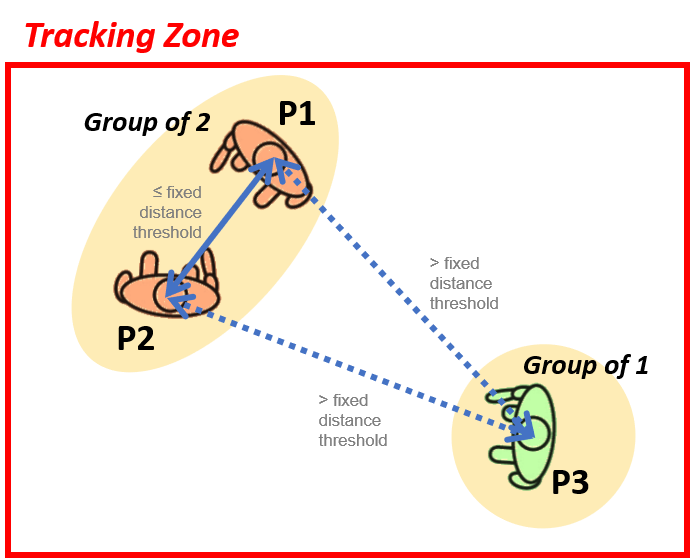
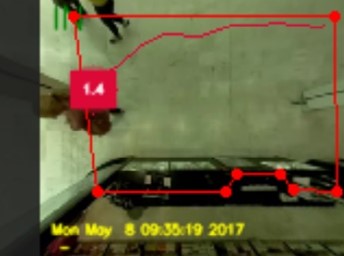
For scenario with ≤ 3 persons in the tracking zone, people who stay within a fixed distance threshold from each other will be considered as a group. As shown in figure 15.4.1, P1 & P2 are sufficiently close to each other (i.e. distance between them is ≤ distance threshold) and form a group of 2 persons whereas P3 who is located at a distance greater than the fixed distance threshold from both P1 and P2 forms a group of 1 person himself. Commonly used distance threshold value is ranging from 1m to 1.5m (can be adjusted based on the installation site environment).
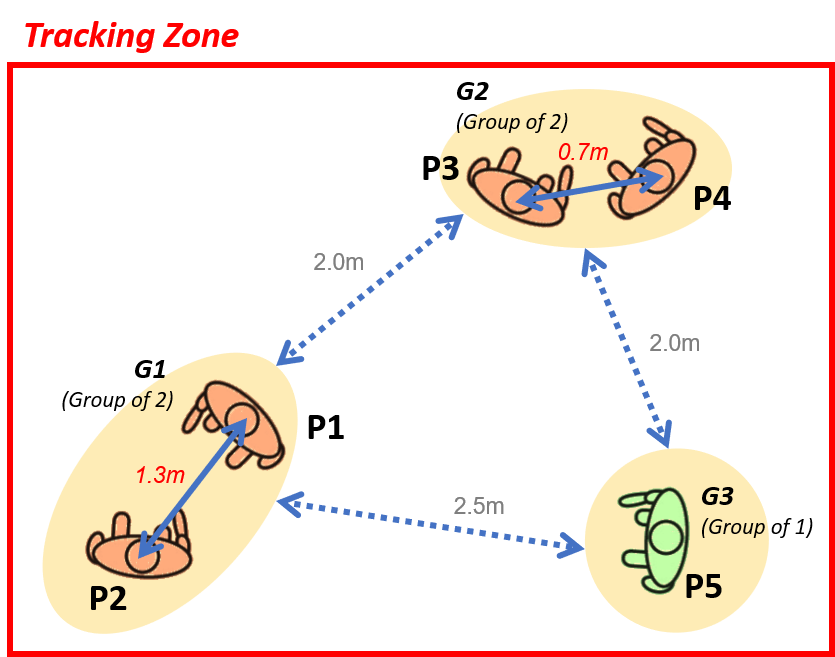
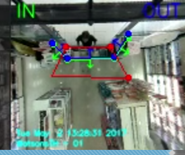
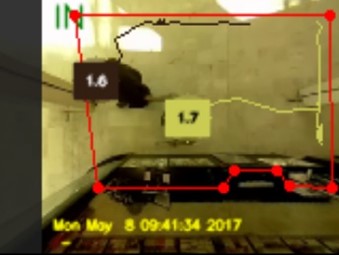
For scenario with more than 3 persons in the tracking zone, a more advanced clustering technique is adopted to identify groups of people in a hierarchical manner using multiple levels of distance threshold that are determined dynamically based on the location distribution of all persons in the tracking zone. For instance, as shown in Figure 15.4.2 with a total of 5 persons, our grouping logic will identify 3 unique groups described below:
-
P1 & P2 are 1.3m from each other and form group G1 of 2 persons,
-
P3 & P4 are 0.7m from each other and form group G2 of 2 persons,
-
P5 is 2.5m away from group G1 and 2.0m away from group G2, thus form group G3 of 1 person.
Group G1 & G2 which are 2m away from each other DO NOT form a group. Notice that the distance threshold is no longer a fixed value (as in the scenario of ≤ 3 persons) but is determined dynamically to adapt to the changing location distribution of all persons in the tracking zone, thereby capable of forming group with varying density level.
1.4.2 Filtering Logic
Filtering logic is applied on the output of grouping logic to further refine the grouping results. Unlike grouping logic which only takes the latest location coordinates of people as input to perform grouping, filtering logic takes in the tracking trajectory of each person in the tracking zone to analyze their movement direction and speed to allow fine-grained grouping and remove false grouping. There are two types of filtering mechanism being implemented, namely direction filtering and speed filtering, which are applied to the grouping results in sequential manner, with direction filtering precedes speed filtering.
A. Direction Filtering
The purpose of direction filtering is to split up one large group of people into multiple smaller groups by comparing the angle difference between each person in the group. New subgroup will form if there is at least one person with his angle difference exceeds a preset threshold value after comparing with other persons in the group.
One basic example where direction filtering helps in group counting is it will identify groups of people travelling in opposite direction and prevent them from being assigned to one large group when they come close to each other and remain relatively static for certain period of time within the tracking zone.
B. Speed Filtering
For speed filtering, which is applied on the output of direction filtering, its primary function is to identify outlier (a person whose movement speed is significantly different from another person in the group) in a group and exclude the outlier from the group. In the occasion where an outlier temporarily come close to an existing group that has been remained static for some time, speed filtering will help to prevent the outlier from joining the group immediately, but instead treat the outlier as another group.
On top of the direction and speed filtering, group counting also makes use of a duration threshold that can be adjusted to control how fast a new group can be formed and how fast an existing group can be disbanded.
1.4.3 Group Count Triggering Logic
Group counting data will be triggered when:
-
Group has triggered a counting event. For example, group has crossed the IN-counting line, and
-
All members of the group have left the tracking zone.
Note: This triggering logic does not affect the normal individual footfall counting as group counting is a separate running process. Individual footfall counting will be triggered as per outlined in this section.
Group counting data will be saved in the following illustrated* format.
| Device Serial | Timestamp | Line ID | IsGroup |
| 00000000xxxxxxxx | 12/2/2017 1:00pm | 1 | Yes |
| 00000000xxxxxxxx | 12/2/2017 1:03pm | 1 | Yes |
| 00000000xxxxxxxx | 12/2/2017 2:09pm | 2 | Yes |
Note: Group size information is not stored.
Group counting data will then be uploaded to server as per outlined in this section.
* For illustration purpose only.
1.4.4 Group Counting Metrics
The key metrics used for footfall counting will be:
-
PFC21 - Footfall Group IN
-
PFC22 - Footfall Group OUT
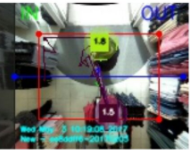
1.4.5 Indication of Group Counting Results in LiveView
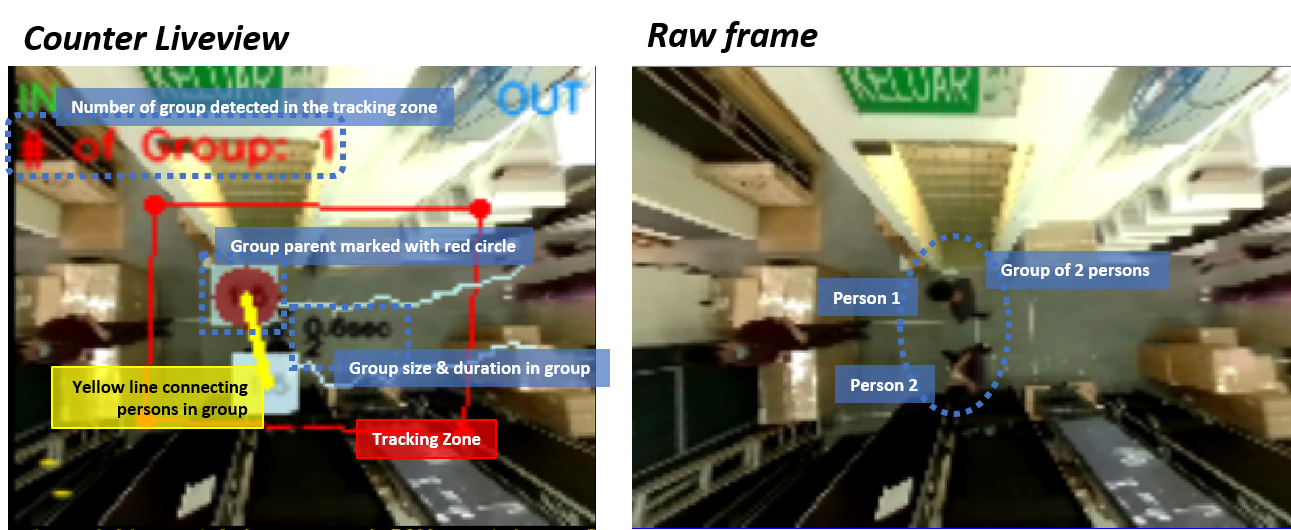
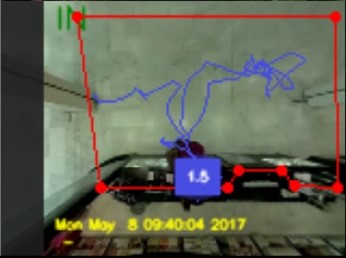
Figure 15.4.3 depicts some general information that will be displayed on the counter live view when group counting is enabled, which includes:
-
Number of groups detected in the tracking zone (at top left corner of live view)
-
Group parent (i.e. the person who has been in group for the longest period of time, marked with red circle)
-
Duration of each person in a group (in seconds)
-
Group size (only shown under the duration text of group parent)
-
Yellow line connecting all persons in the same group
1.4.6 General Data Protection Regulation (GDPR)
-
No PII (Person Identifiable Information), such as biometric or faces, is collected for processing or analysis purpose.
-
No guarantee or assumption that people clustered in a group has any form of social or biological relationship.
-
Analysis is purely based on trajectory and time.
-
One person of a group will be tagged as group leader, for the sole purpose of better group counting accuracy. Anyone can be group leader, as opposed to (for example) only the elder of the group can be group leader.
1.4.7 Limitations
-
Relationship of people in the same group cannot be inferred with group counting at current stage as we did not collect biometric, gender or facial information of people.
-
It is not advisable to enable group counting at site with relatively small tracking zone because there will be insufficient tracking trajectory data of people for group counting to process and generate grouping results. Recommended minimum size of tracking zone should be at least 3m x 3m for satisfactory group counting accuracy.
1.5 Video Analytics Counting
Video Analytics uses AI algorithm to perform human detection and tracking. It is used in FootfallCam Centroid to produce footfall data. Below is a full flow diagram of a typical Centroid setup with IP cameras, from how the device gets input from the cameras, to processing the data and upload to the server.
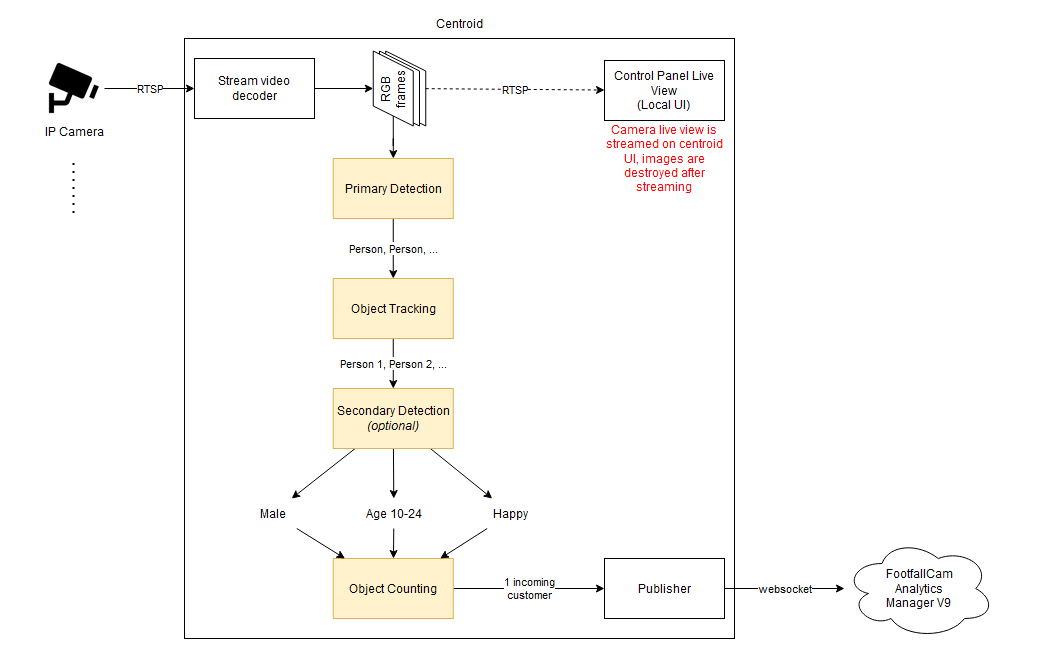 Flow Diagram of Video Analytics
1.5.1 AI Algorithm
AI algorithm uses Deep Neural Network trained by Machine Learning techniques to identifies and detects human. It only tracks human which has high confidence from the algorithm. Thanks to the advanced technology, it has low false negative rate. It rarely wrongly detects trolleys or objects as human because they are visually distinct.
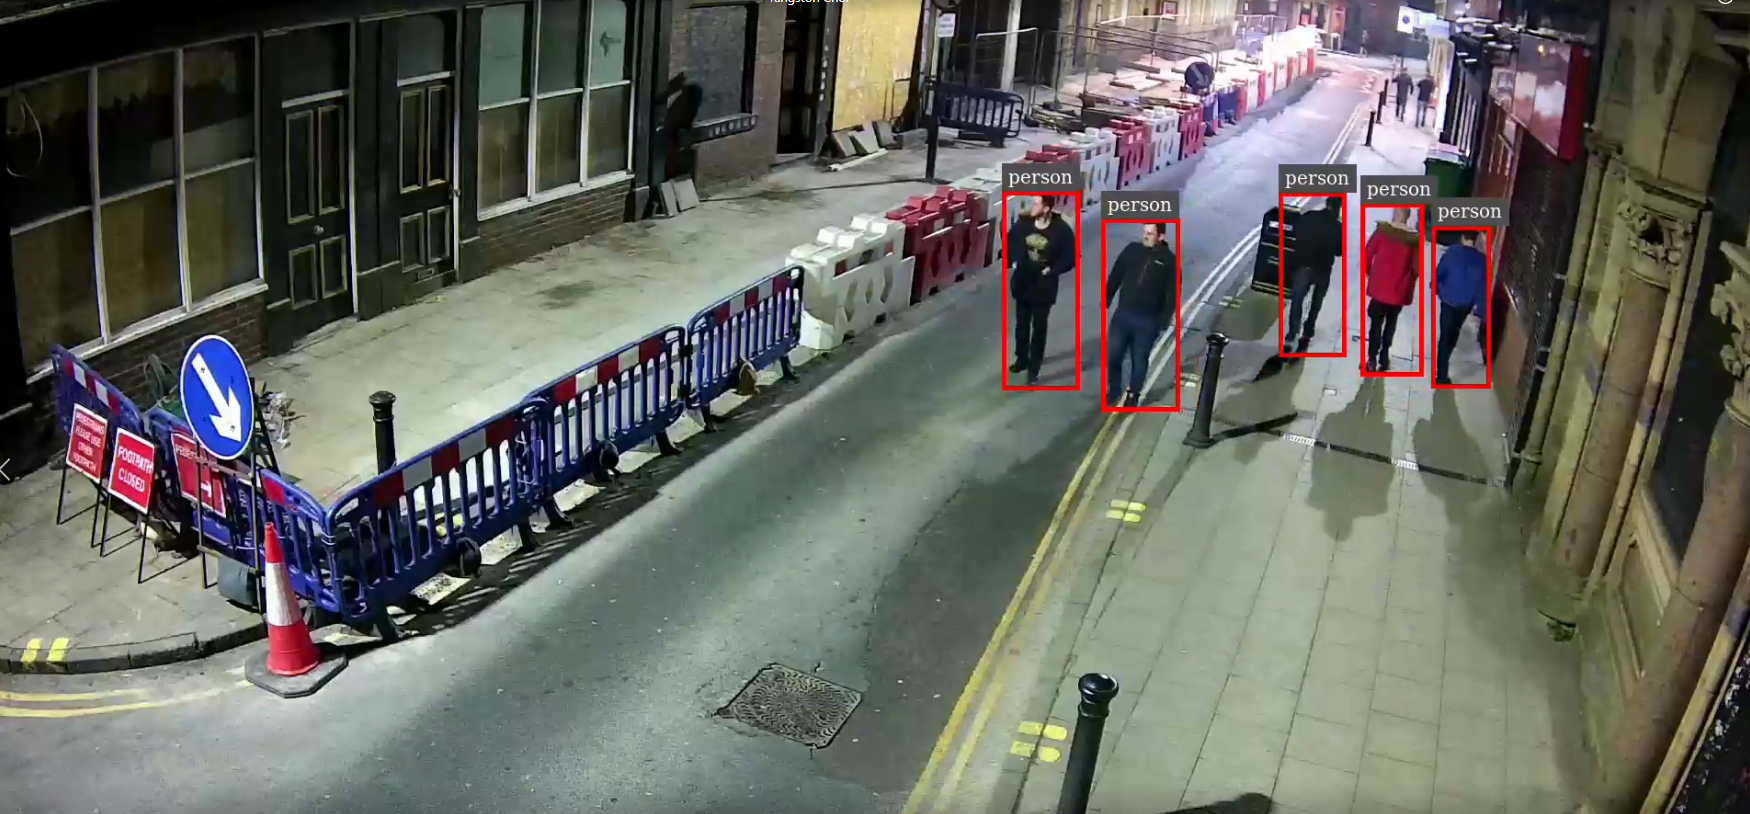 Human Detection
Optionally, demographic analysis can be done on each human detected to obtain more insights based on the person's face, such as Age, Gender and Emotion. This can give a good statistical segmentation of the person characteristics, and is useful for measuring promotional campaign effectiveness, understanding customer base, getting expressive feedback, etc.
Limitations:
-
May wrongly detect human-like structures, such as paintings or humanoids
-
May not detect children
-
May not detect blocked or occluded human, when in a crowd
-
May not detect if human is too far or too blurry
-
Enabling demographic analysis may impact normal people counting accuracy
-
Demographic analysis only works on person's front faces without any mask
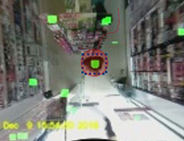
1.5.2 Counting Modes
1.5.2.1 In Out Counting (Centroid)
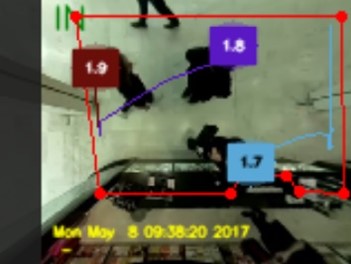
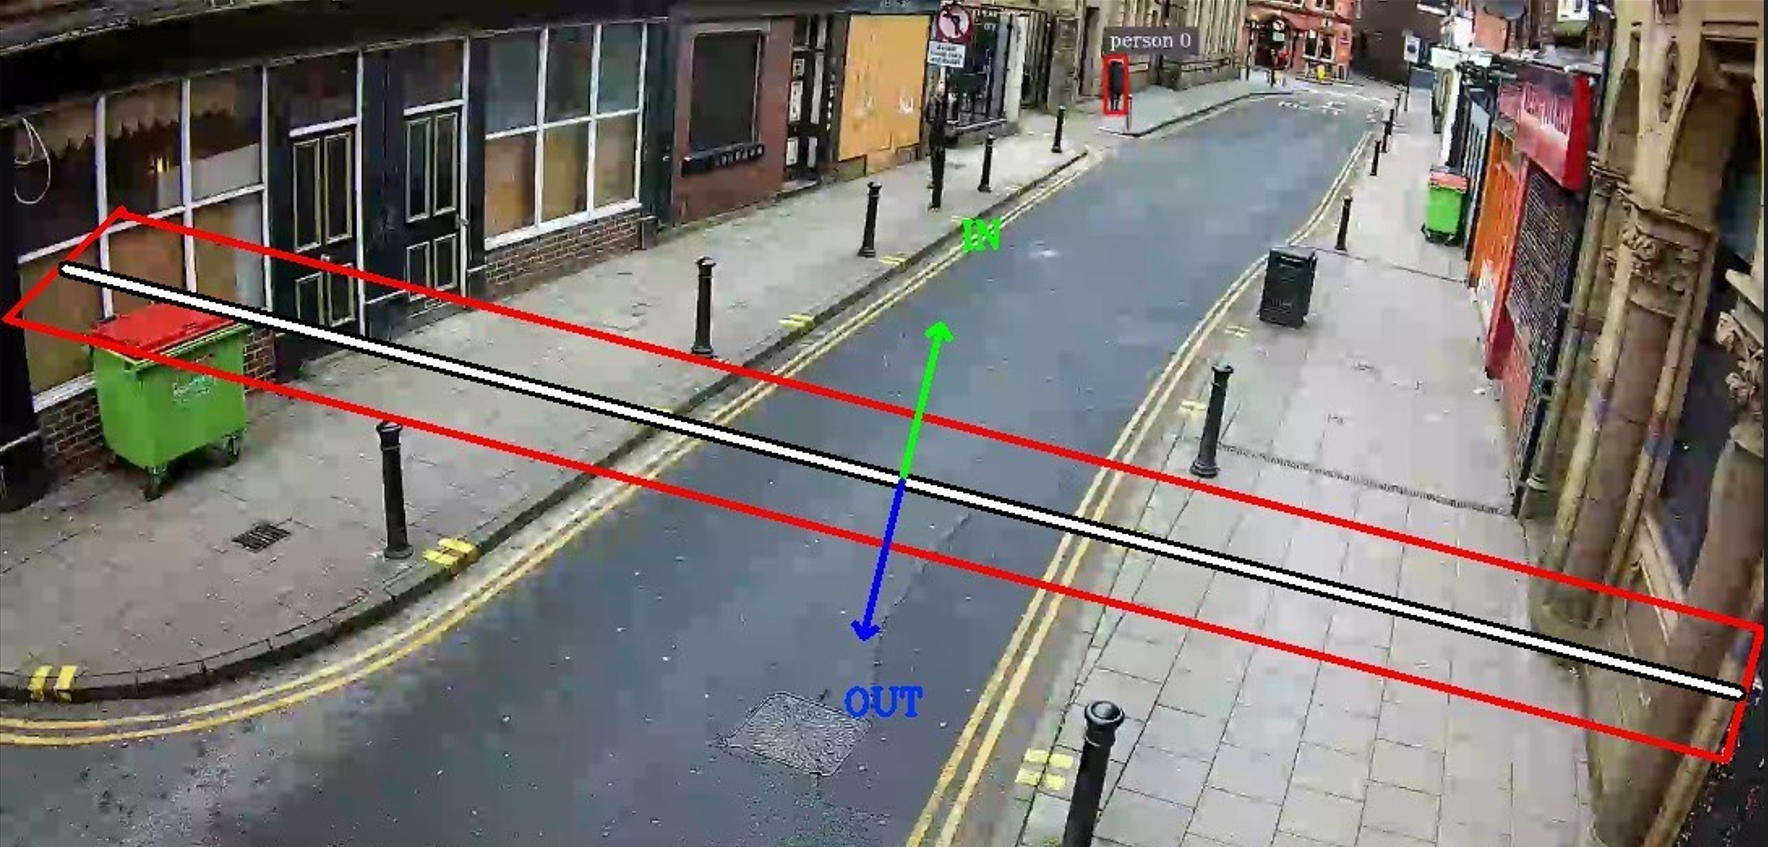 Tracking zone (red) and In-Out line
In Out Counting works by:
-
Tracking each human detected by AI algorithm
-
Constantly checking if the human is within the tracking zone
-
If the human crosses either the In-line or Out-line, a counting event is registered.
-
However, the event is ignored if the human makes a U-turn.
-
When the human leaves the tracking zone, the event is collected and sent.
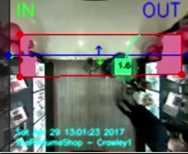
1.5.2.2 In Out Counting (Pro2)
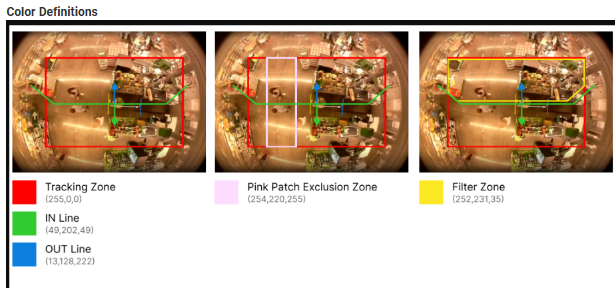 Color Definitions
(Last updated on 23-Aug-2024)
| Counting Line / Zone | Description |
| Tracking Zone | A designated area to detect and monitor the presence and movements of individuals within its boundaries. |
| IN Line | A boundary that detects IN count when people cross it as they enter a specific area. |
| OUT Line | A boundary that detects OUT counts when people cross it as they go out a specific area. |
| Pink Patch | A special covering used to block or hide stationary objects of a certain height that might be mistakenly counted by the sensor, preventing unnecessary noise or incorrect counting. |
| Filter Zone | A special area that helps to make sure only the right objects get counted. For example, in a store or with a swinging door, it can filter out any extra movements that shouldn't be counted as people coming in or going out. It works by only counting people whose path starts or ends inside the filter zone. If both the start and end of the path are either inside or outside the filter zone, the person won't be counted. |
1.5.3 Data Collection
Once a visitor enters and exits the tracking zone of a device while triggering the in-out line in between, the device triggers a counting event.
The data will be saved in the following format:
| Device Serial | Timestamp | Metric ID | Roi ID | Combine Object Type ID |
| 142xxxxxxxxxx | 12/2/2022 1:00pm | 1 | 1 | 23311 |
| 142xxxxxxxxxx | 12/2/2022 1:03pm | 1 | 2 | 14511 |
| 142xxxxxxxxxx | 12/2/2022 2:09pm | 2 | 1 | 12311 |
Definitions:
-
Device Serial
-
the serial number of the device
-
-
Timestamp
-
the time when the event happens
-
-
Metric ID
-
1: when a visitor crosses the In-line
-
2: when a visitor crosses the Out-line
-
-
Roi ID
-
the ID of CCTV camera where the event happens
-
-
Combine Object Type ID
-
a combination of ID that encodes the details of person such as demographic analysis
-
Data is stored in device database for up to 14 days.
No Person Identifiable Information (PII) sensitive image data of person or face is stored in the device.
1.5.4 Data Upload Process
The data collected by each device is uploaded to the server instantaneously via websocket protocol. Data will also be processed in real time on the server, therefore it is possible to view live dashboard of data on the Portal. One example is the live occupancy dashboard.
Once the data reach the server, it is immediately aggregated to site or area level granularity, and readily available for end users to query via Counting Data API. Users can retrieve the data in multiple time granularities, such as 1-minute, 15-minute, 30-minute, hourly, daily, weekly, monthly or yearly.
Data are also available for historical reporting. See Appendix B Metrics Definition for how long the data is stored on the server.
No Person Identifiable Information (PII) sensitive image data of person or face is sent to the server.
1.5.5 Metric Codes
The metric codes are exactly the same as Footfall Counting Metric Codes.
1.6 Airport Waiting Time
1.6.1 Methodology of Calculating Average Waiting Time Based on Out-Count and Occupancy Data
The methodology employed for calculating the average waiting time is uniformly applied across both areas. Below is a general outline of the calculation process:
- Data Collection and Session Identification
- Minute-level out data and occupancy data are collected for each area.
- For each area, a period is considered to be in session if there is any recorded out count within the past 20 minutes. Only those areas and time periods identified as being in session are used in the calculation of the average waiting time.
- Data Filtering and Weighted Averaging:
- The calculation focuses on the most recent 30 minutes of data for each area. Areas not in session during this period are excluded, and any missing out counts are filled with zeros.
- A weighted average is computed based on the proximity of data to the current time, where more recent data has a greater impact on the average than older data. The current formula to calculate the average for each area is:
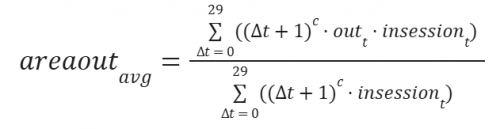
where Δt is the proximity of data to the latest time, c = - 0.8, outt is the out count at minute t, and insessiont is either 1 or 0 depending if it's in session or not.
- Aggregation and Calculation:
- The weighted averages for all areas are aggregated. The occupancy is then divided by this aggregated weighted average out count to obtain the average wait time in minutes. In scenarios where at least one area is in session, the weighted average out count will not be zero.
- Edge Case Handling:
- Initial Occupancy with No Session Areas: When occupancy is recorded but no areas are in session (typically at the start of the day before counters are operational), a threshold of 30 seconds per occupancy is applied, and the waiting time is calculated by multiplying the occupancy by 30 seconds.
- Out Data without Occupancy: If out data are available but no occupancy is recorded (indicative of miscalculated occupancy), the average waiting time is set to zero, as the actual occupancy cannot be determined.
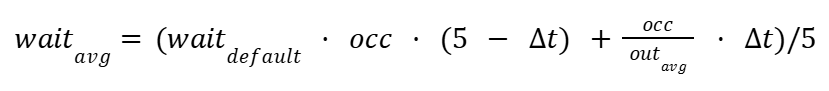
- Opening of First Counter with Existing Occupancy: When the first counter opens with existing occupancy, there is a significant shift between the pre- and post-opening out counts. To address this, the average out count for the first 5 minutes is adjusted to align more closely with the threshold and subsequently with the actual data points. Below is the formula used:

where waitdefault = 0.5, Δt is the time from when it starts operating, and outavg is the resulting average out count.
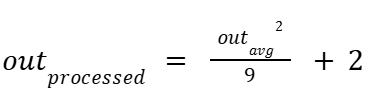
- Weighted Average Tending Toward Zero: If the aggregated weighted average out count over all areas approaches zero while occupancy remains, it may indicate that the device is miscounting some ins or outs. In such cases, the aggregated weighted average out count is adjusted to approach the threshold value mentioned above rather than zero. We currently map the average from [0, 3] to [2, 3] (This is to tally with the threshold of 30 seconds as in bullet 1) using the following formula:


This methodology ensures accurate and reliable calculation of average waiting times, accounting for various edge cases and anomalies.
1.6.2 Impact of Changes in Out-Count and Occupancy Data on Average Waiting Time
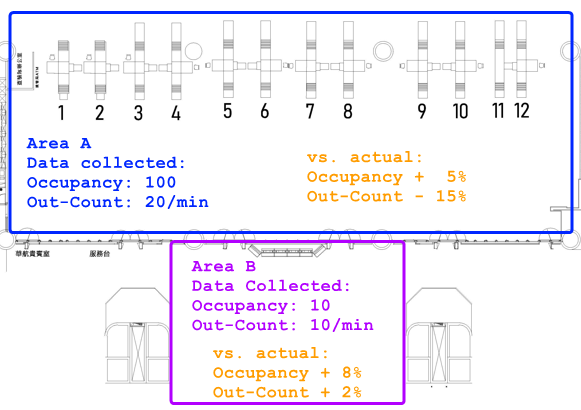
We have conducted a comparison between the data stored in the database and the actual observed data, resulting in the calculated error percentage as shown above. In this section, we will demonstrate that this error corresponds to a deviation within 1.05 minutes from the actual average waiting time using the examples shown above.

1.7 Car Counting
Car Counting uses AI-based Video Analytics to detect and track vehicles passing through a designated area. It is typically used in traffic monitoring, parking management, and retail car park analysis. The AI algorithm is trained using Deep Neural Networks to recognize cars based on their shape, movement patterns, and distinguishing features. Only vehicles with a high detection confidence score are counted, ensuring minimal false positives from unrelated objects such as pedestrians, bicycles, or roadside structures.

Car Detection