


2.0 Occupancy dashboard
Users that are interested in reviewing the current occupancy count of visitors in a compound will be able to access the occupancy dashboard available from the FootfallCam Analytic Manager to review the current occupancy in the confined area. The occupancy dashboard will be updated on seconds basis. For users to access the occupancy dashboard:
-
Navigate to the occupancy dashboard by selecting Occupancy on the tab under Reports.
How does occupancy counting works?
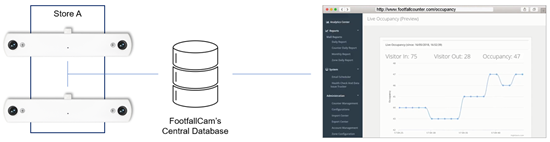
The occupancy dashboard works by performing three steps within a time frame of one second to showcase the data from what the counter retrieve and into the FootfallCam Analytic Manager. The three steps are as follow:
-
Data will be streamed from the FootfallCam into the FootfallCam central database every second.
-
Data streamed to the FootfallCam central database will be aggregated before it will be displayed in the occupancy dashboard. This step is crucial as it will aggregate the visitor counts if there are multiple counters installed in one store.
-
Once all visitor counts have been aggregated, the current occupancy will be live and available in the Occupancy dashboard. Users may choose to connect the dashboard to an external monitor or display by copying the URL link provided and pasting it to the video wall.
2.1 Setting up Live Occupancy
2.1.1 Request for Live Occupancy Solution
STEP 1 - Access to FootfallCam Analytic Manager V9™: https://v9.footfallcam.com via browser.
STEP 2 - Click on Maintenance > Support Portal to access the Support Portal page.
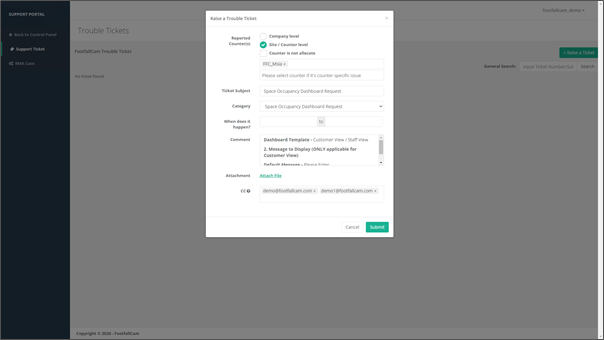
STEP 3 - Click on +Raise a Ticket button to access the Raise a Trouble Ticket page.
STEP 4 - Complete the process by entering all the required fields and click on Submit button.
| Item | Description |
| 1. Reported Counter(s) | Select the specific Site that had created for dashboard setup. (Info: Multiple site(s) can be selected.) |
| 2.Ticket Subject | Enter the subject of issue faced as Space Occupancy Dashboard Request. |
| 3. Category | Select the category of issue faced as Space Occupancy Dashboard Request. |
| 4. When does it happen? | N / A |
| 5. Comment | Provide information as below: 1. Dashboard Template - Both / Customer View / Staff View (Info: User may refer to Dashboard Template in Section 2.0.) 2. Message to Display (ONLY applicable for Customer View) Default Message - Please Enter. Alternative Message - Do not Enter. |
| 6. Attachment | N / A |
| 7. CC | Enter the email address to receive latest ticket updates. (Info: Multiple email address can be added.) |
2.1.2 Dashboard Template
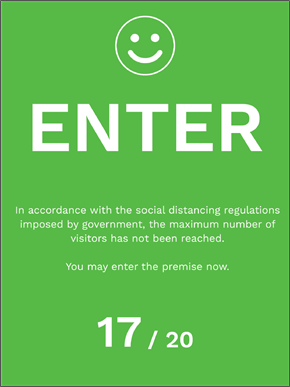
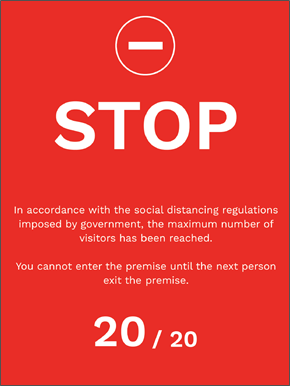
2.1.2.1 Customer View
  |
|
| Space Occupancy Dashboard - Customer View | |
| Features | Compatible with CM1 / CM3. |
| Allow to set threshold. | |
| Allow to apply customise message in multi-language. | |
| Video Link | Click here to view the video for Covid-19 Automated Occupancy Control System. |
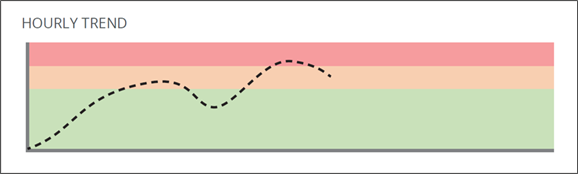
2.1.2.2 Staff View
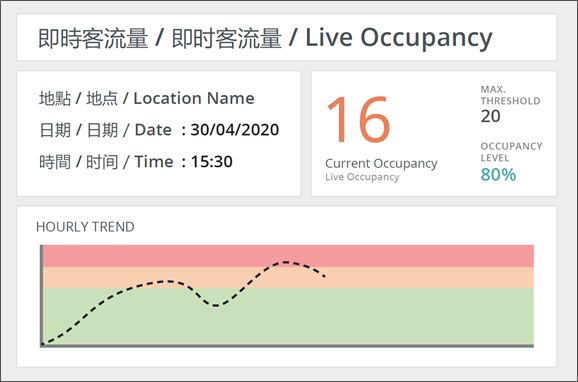
| Space Occupancy Dashboard - Staff View | |
| Features | Compatible with CM1 / CM3. |
| Allow to set threshold. | |
| Video Link | Click here to view the video for Covid-19 Automated Occupancy Control System. |
2.1.3 Report Setting
2.1.3.1 Change Threshold
Threshold used to define the occupancy limit and user able to define in two level which are:
-
Threshold 1 - Warning occupancy value.
-
Threshold 2 - Maximum occupancy of the premise and turn dashboard to RED when threshold is met.
2.1.3.2 Embedded URL
Users allow to embed in two level shown as below:
Option 1 - Embed the whole dashboard.
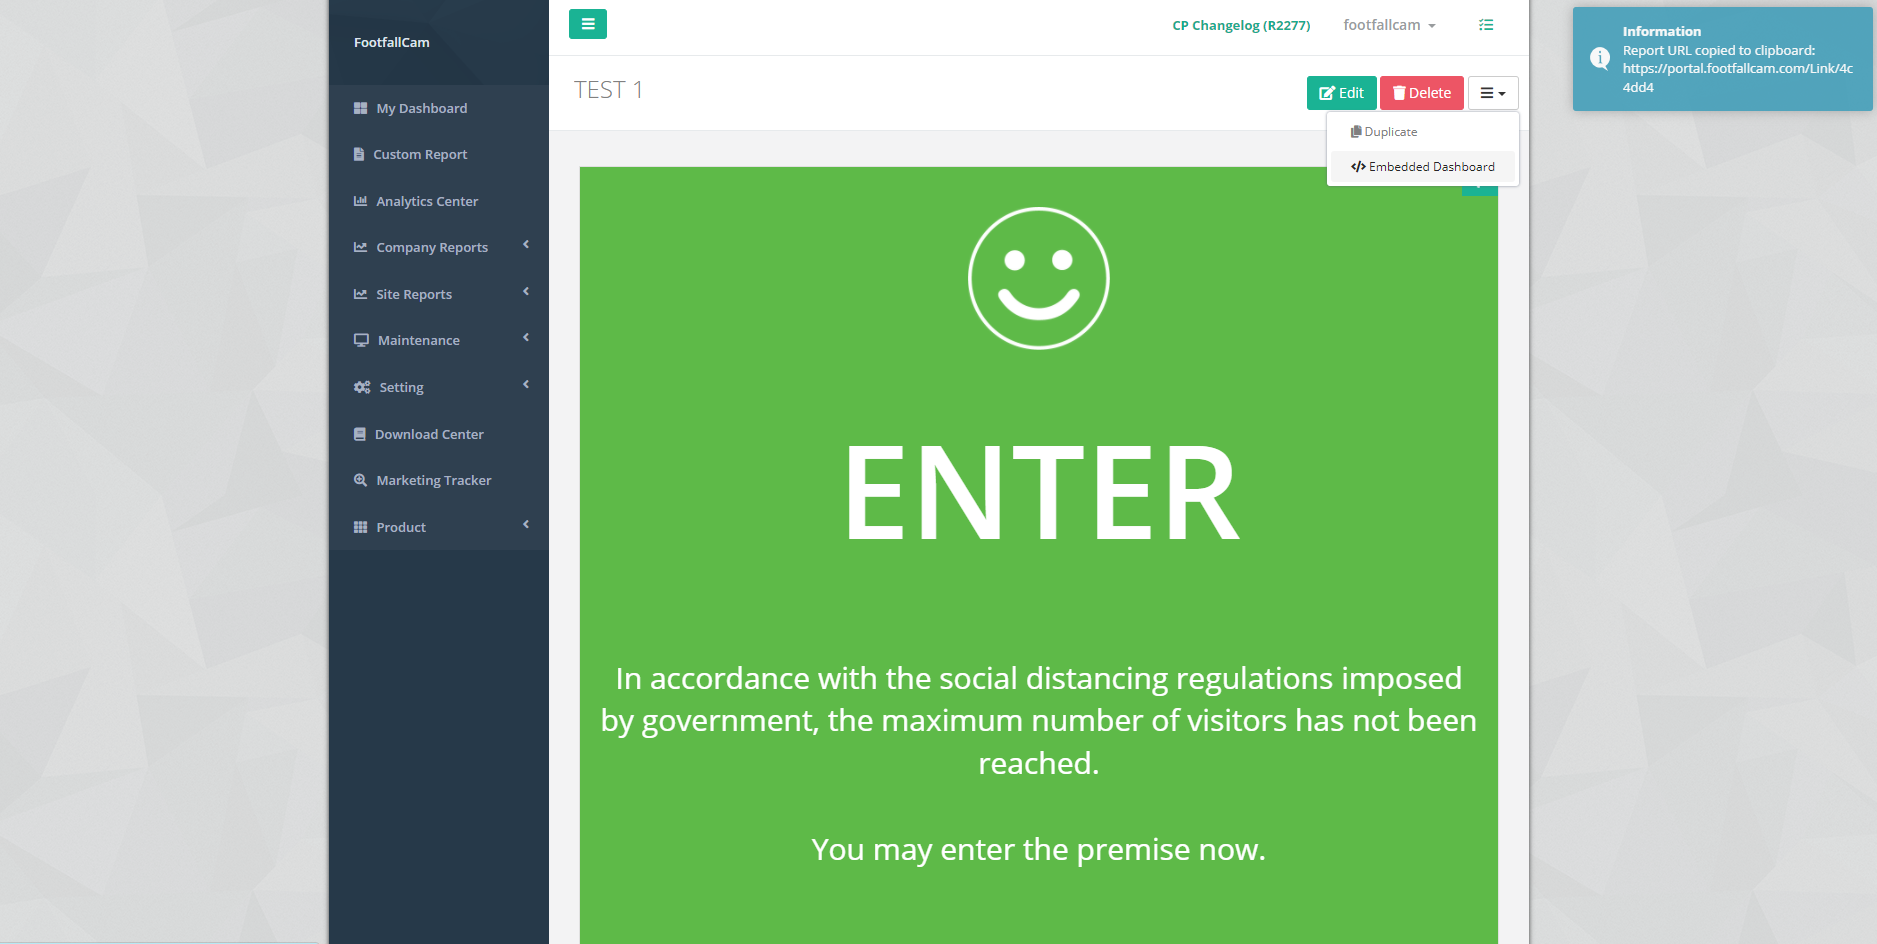
STEP 1 - Click on Custom Report and navigate to the dashboard.
STEP 2 - Click on Dropdown menu icon on top-right and select Embedded Dashboard.
STEP 3 - Paste the Report URL to your Mobile Application or Electron App (Mini Computer).
Option 2 - Embed a specific widget.
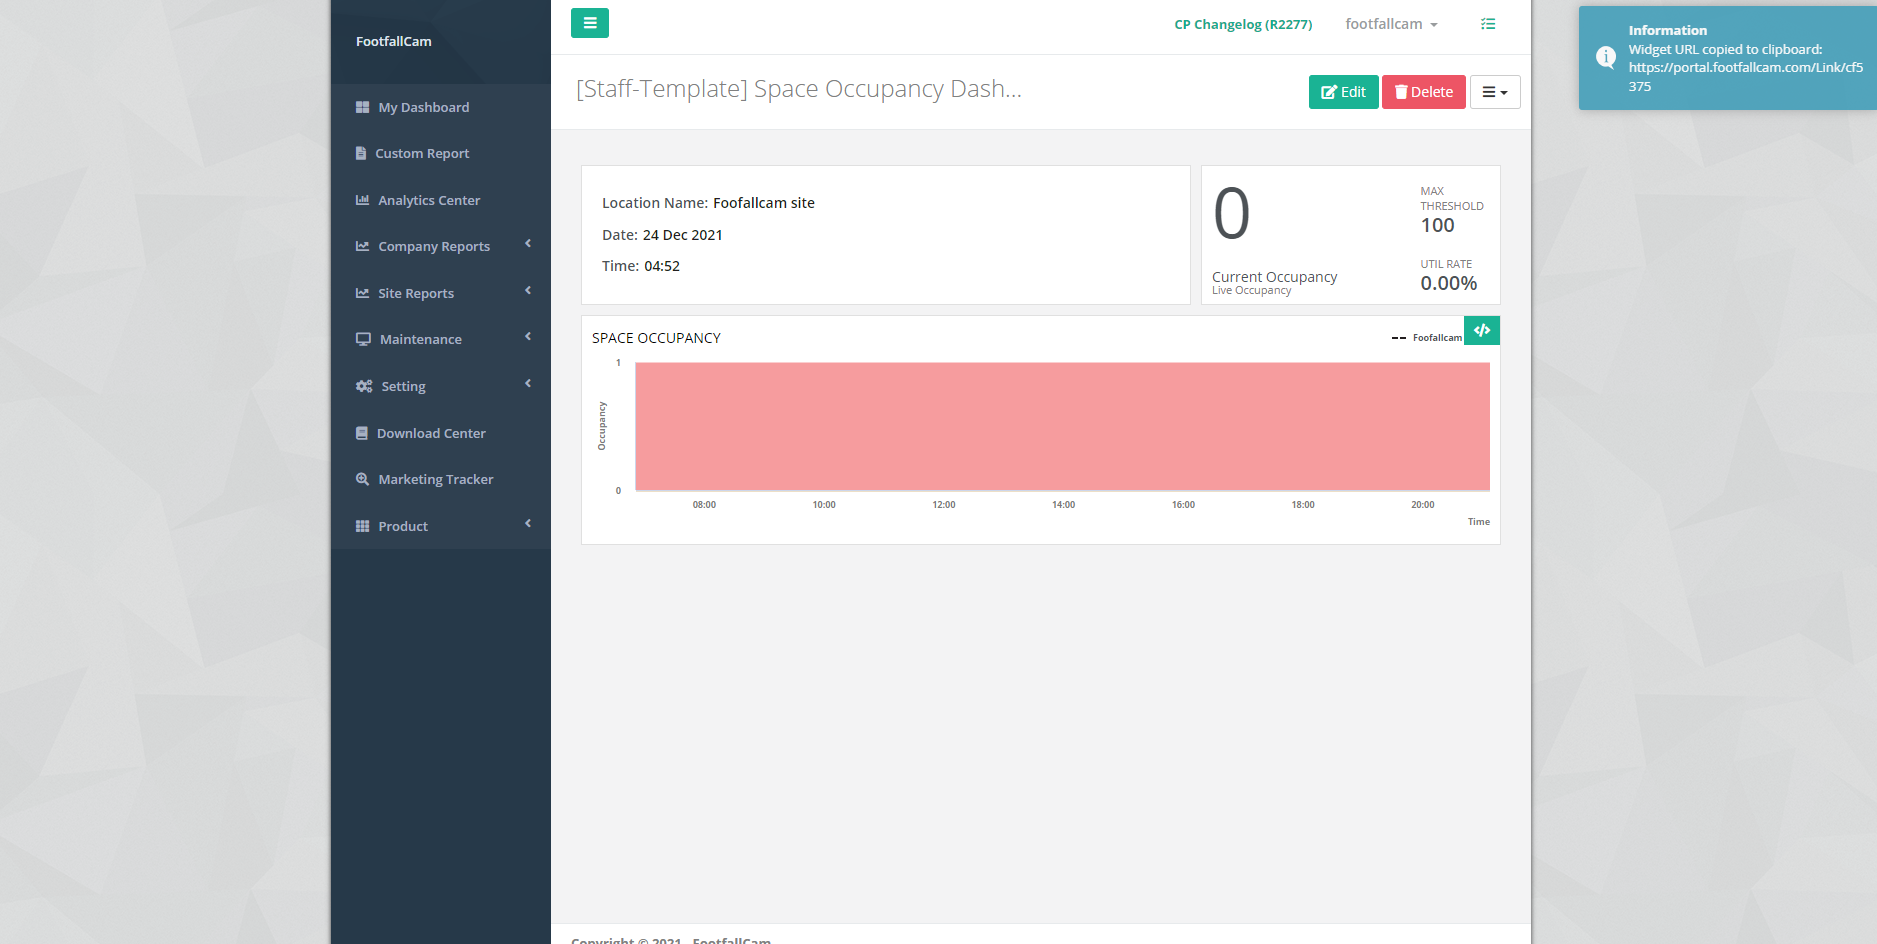
STEP 1 - Click on Custom Report and navigate to the dashboard.
STEP 2 - Click on Widget and an Embed icon will show on the top-right of the widget.
STEP 3 - Click on the Embed icon and paste the Report URL to your Mobile Application or Electron App (Mini Computer).
2.1.4 Dashboard Display Option
2.1.4.1 Space Occupancy Mobile App
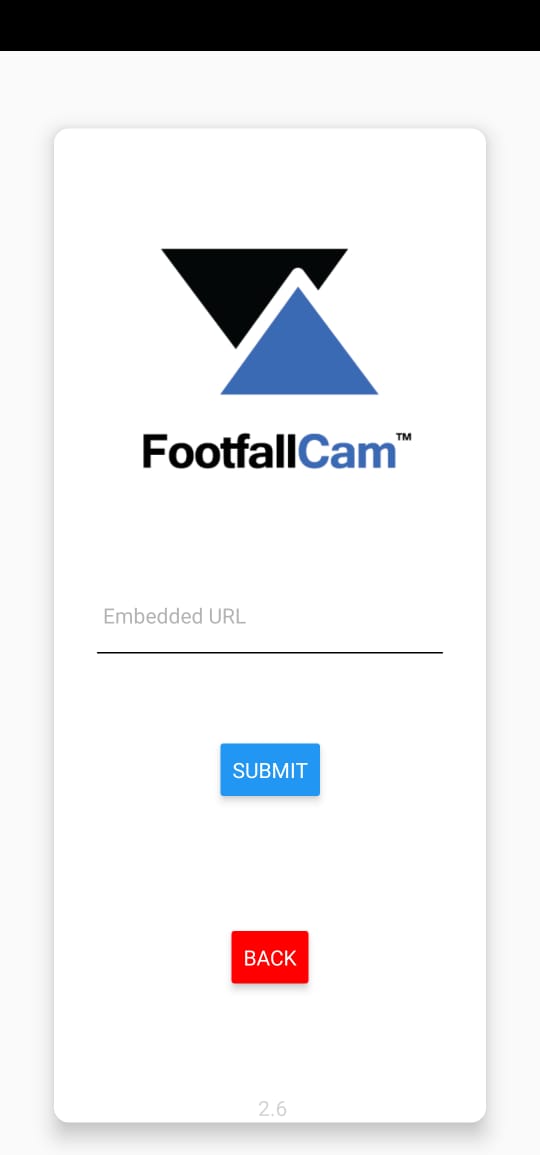  |
STEP 1 - Download the mobile application via link: STEP 2 - Enter the Embedded URL then click on Submit. (Info: For more information on Embedded URL, please refer to Section 17.1.3.2.) |
2.1.4.1.1 Change Embedded URL
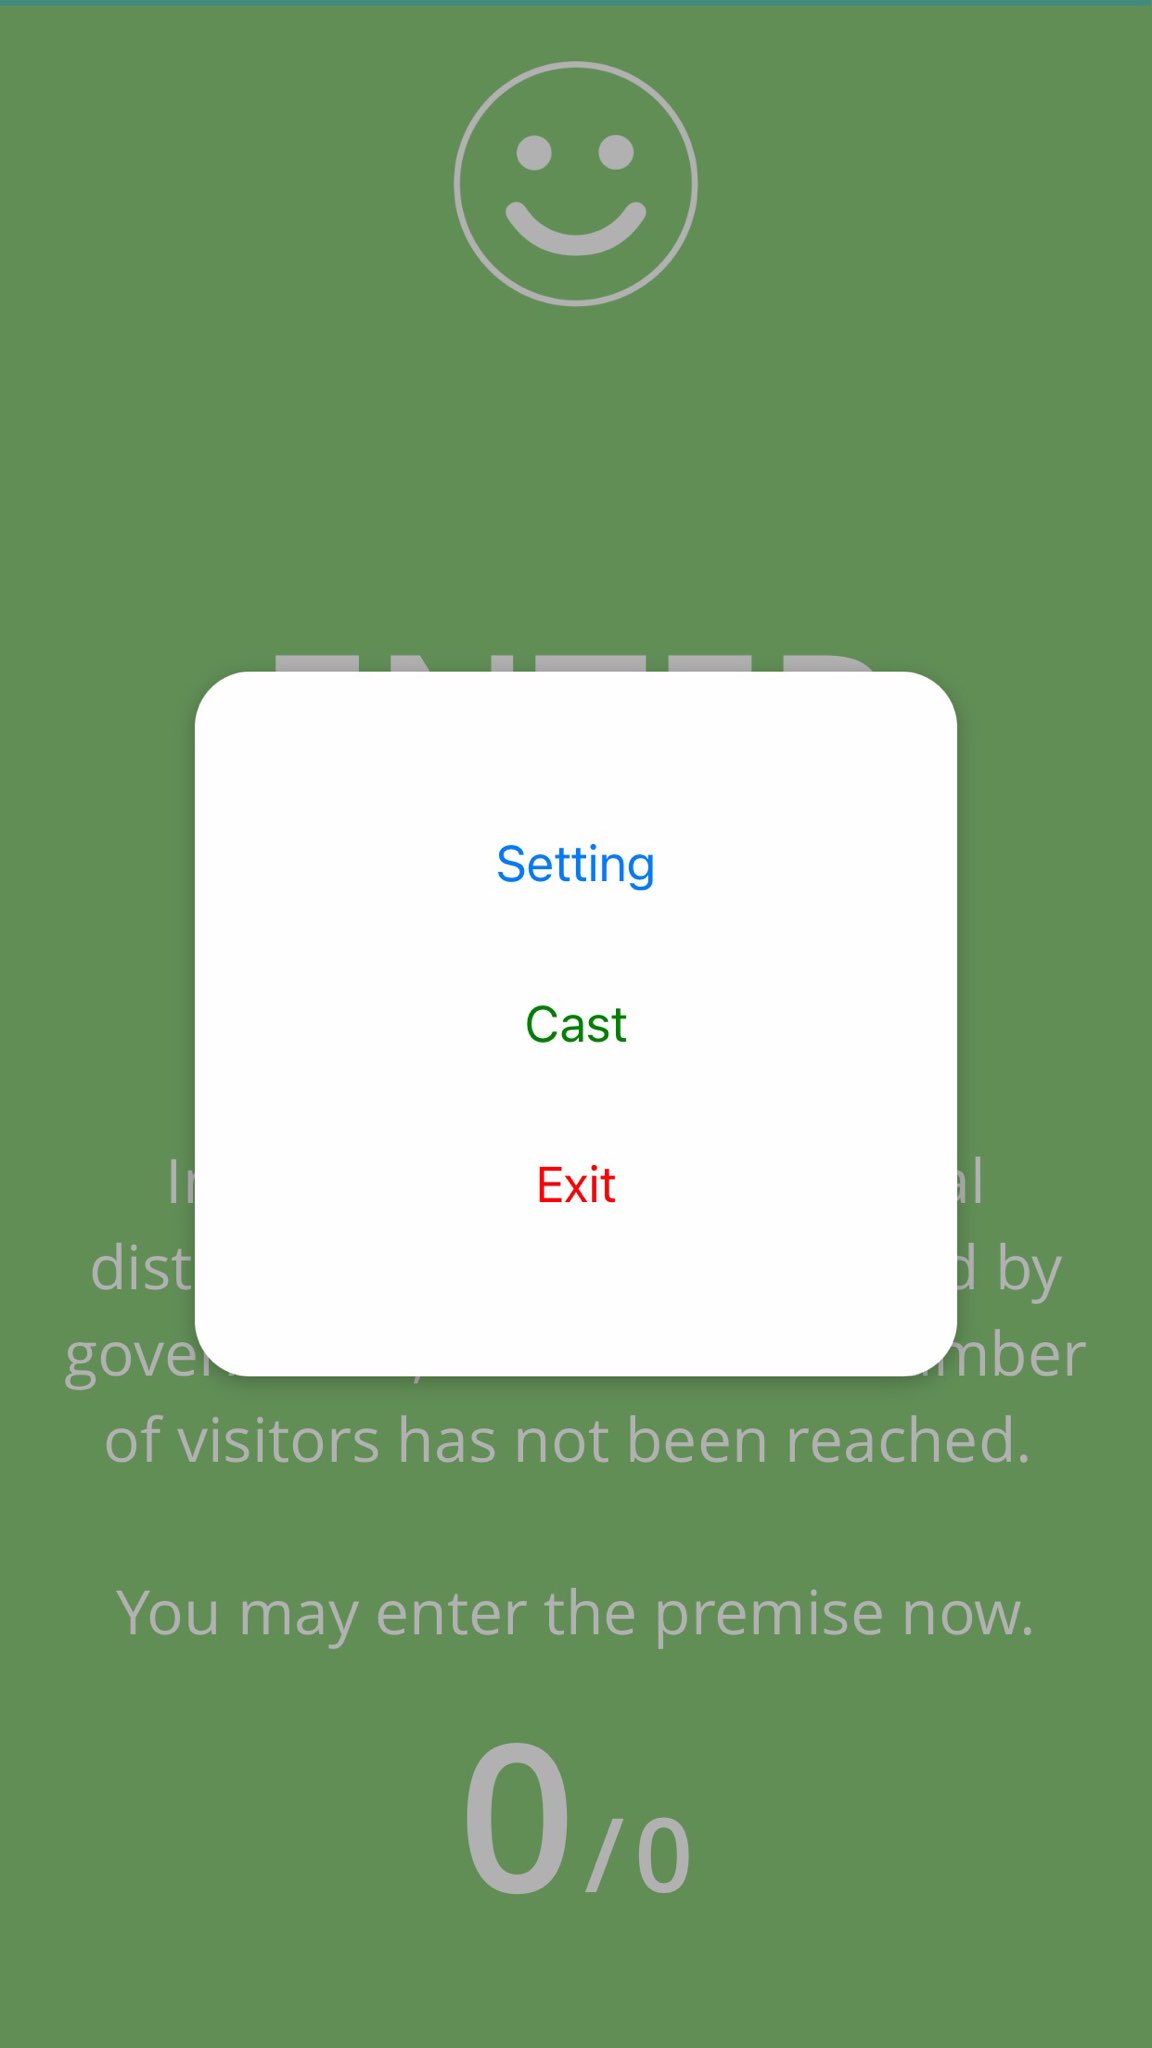 |
STEP 1 - Long Press for few seconds on screen to trigger a pop out box. STEP 2 - Click on Setting button for back to home page to re-enter Embedded URL. |
2.1.4.1.2 Casting Device
STEP 1 - Long Press for few seconds on screen to trigger a pop out box.
STEP 2 - Click on Cast button.
STEP 3 - Ensure the casting device and Android Device are connected with same network.
STEP 4 - Click on Touch To Cast to select the device for casting.
STEP 5 - Dashboard will displays on the casting device.
2.1.4.1.3 Exit the Application
STEP 1 - Long Press for few seconds on screen to trigger a pop out box.
STEP 2 - Click on the Exit button.
STEP 3 - Enter the password - ffc888.
2.1.4.1.4 Manual Occupancy
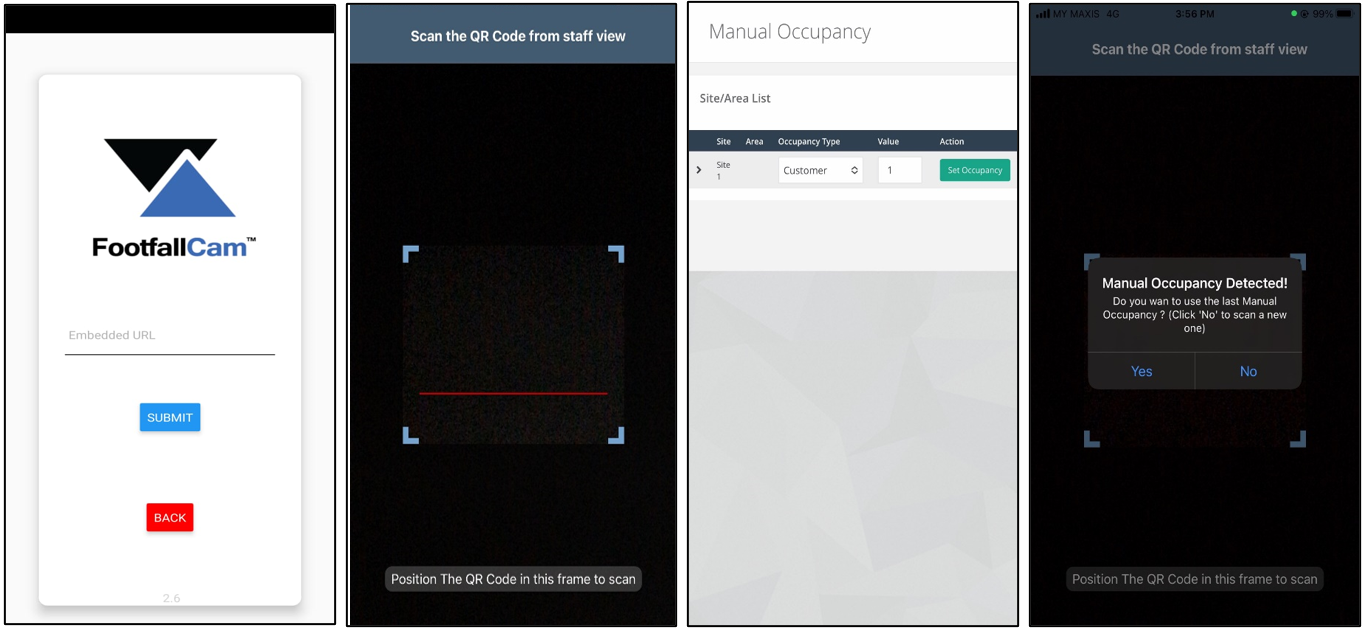
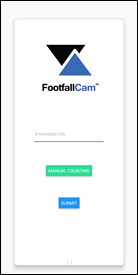
STEP 1 - Click on Manual Counting:
STEP 2 - Scan the QR Code on dashboard of the specific site for first time access.
(Note: A pop-out box will appear to request for resume the last session.)
STEP 3 - Enter the value and press + icon or - icon to perform manual adjustment on occupancy.
2.1.4.1.5 Force Update
 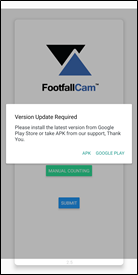 |
STEP 1 - A pop-out box will appear for update request if the version is NOT up-to-date. STEP 2 - Android version allow to download the latest version via APK or Google Play. (Note: For APK is recommended to uninstall and reinstall using the downloaded APK.) |
2.1.4.2 Integration with Magic Mirror
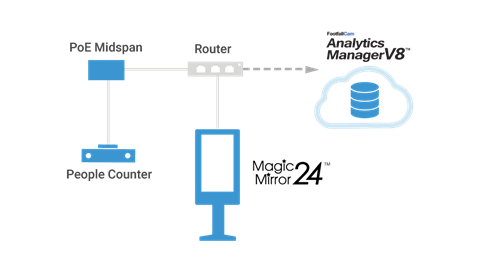
STEP 1 - Setup the FootfallCam Magic Mirror 24™ as the diagram above.
STEP 2 - Raise a support ticket for Electron App setup. For more information on Raising a Support Ticket, please refer to FootfallCam Analytic Manager User Guide Section 24.3.
2.1.4.3 Integration with Mini Computer
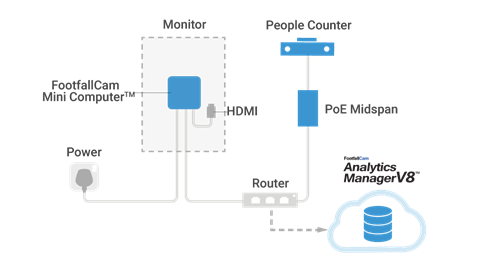
STEP 1 - Setup the Monitor and FootfallCam Mini Computer™ as the diagram above.
STEP 2 - Power on the both devices (Monitor and FootfallCam Mini Computer™).
STEP 3 - Login to FootfallCam Analytic Manager V9™ and copy the embedded URL.
(Info: For more information on Embedded URL, please refer to Section 2.1.4.3.1.)

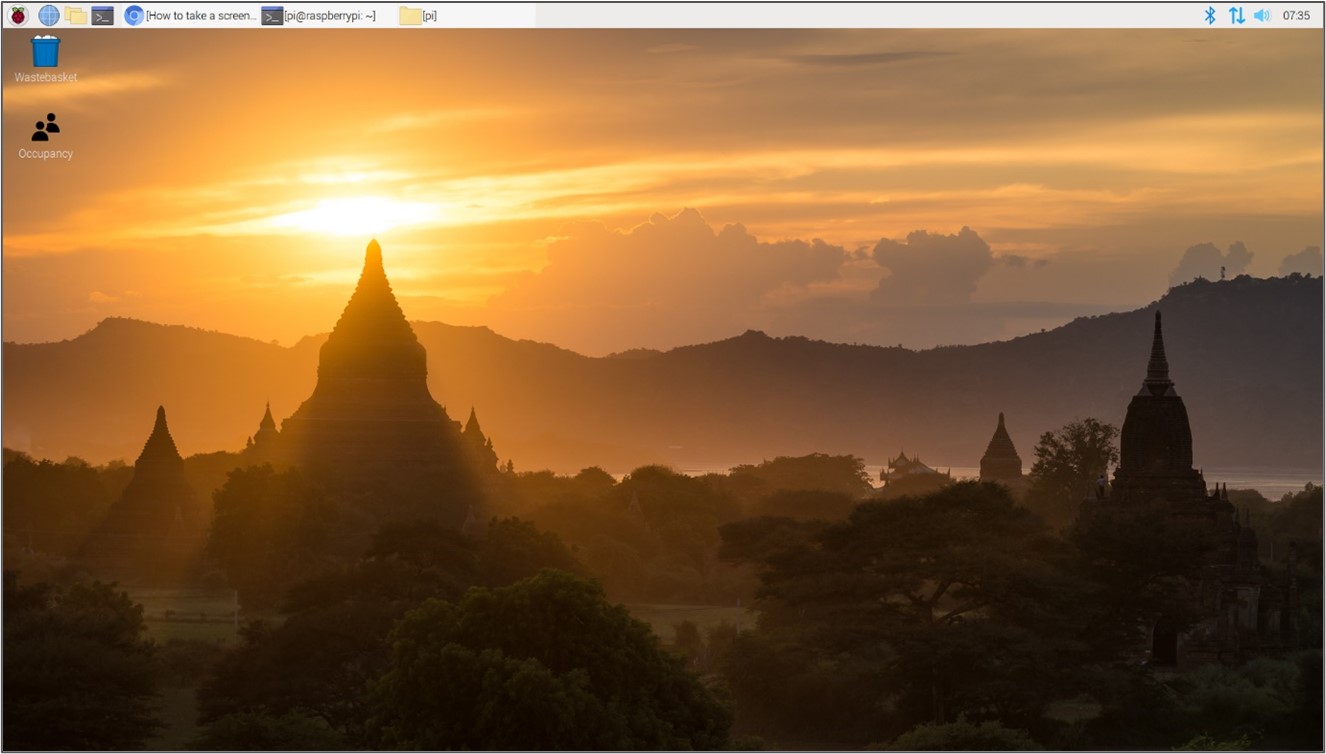
STEP 4 - Click on Occupancy icon on desktop and select Execute.
STEP 5 - Complete the process by entering all the required fields and click on Confirm button.
2.1.4.3.1 Update Mini Computer
STEP 1 - Power on the device and ensure the device is connecting to internet via Ethernet cable.
STEP 2 - Leave the device in that state for at least 2 hours and proceed back to Section 2.1.4.3 - Step 4.
2.1.4.3.2 Change Embedded URL

STEP 1 - Click on the Folder icon at the top-left corner of the display.
(Note: Press ALT + F4 key if the icon is NOT found on desktop.)
STEP 2 - Navigate to SpaceOccupancyDashboardPi4 folder > resource > app.
(Note: Please proceed to Section 4.2.2 for device update if the folder is not found.)
STEP 3 - Navigate to urlParam.json file, right click and select Text Editor.
| Before | After |
STEP 4 - Replace the value of isFirstTime from 0 to 1.
STEP 5 - Press CTRL + S key to save the file and close the Text Editor.
STEP 6 - Proceed back to Section 2.1.4.3 - Step 3.
2.1.4.4 Website Widget Tracker
| Sample Source Code | |
| Video Link | Click here to view the sample for Website Widget Tracker on FootfallCam Website. |
| Section 1 - Widget Styling | Sample styling for the widget includes width, height and border. (Info: User may customize according to individual preferences.) |
| Section 2 - Body Code | Copy and paste the embedded code. (Info: For more information on Embedded URL, please refer to Section 15.5.3.2.) |
2.1.4.5 Electron Application
STEP 1 - Click here to download the electron application.
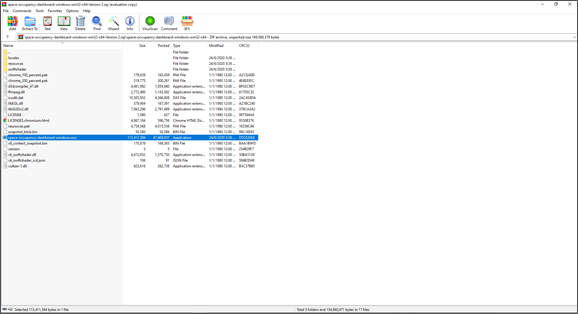
STEP 2 - Click on Space Occupancy Dashboard Windows.exe.
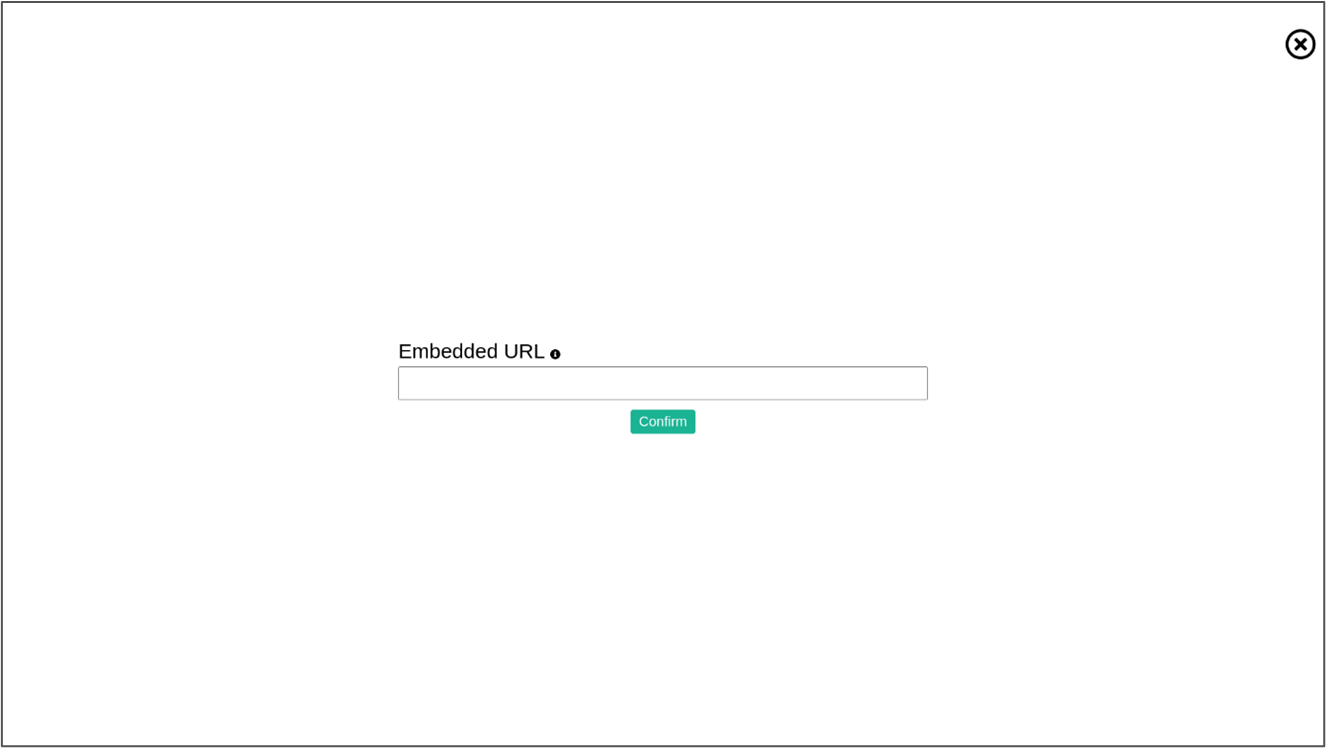
STEP 3 - Enter the Report URL then click on Submit.
(Info: For more information on Embedded URL, please refer to Section 2.1.3.2.)
2.1.4.5.1 Change Embedded URL
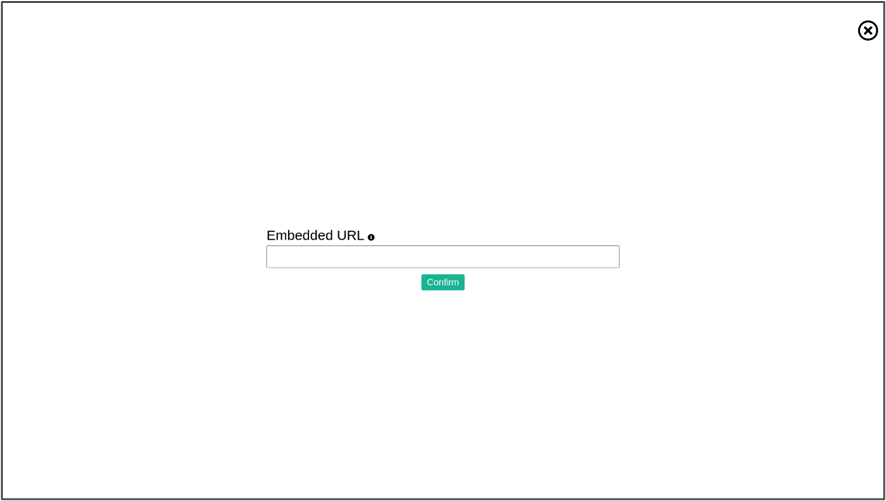
STEP 1 - Double-click on the top-left corner of the screen.
STEP 2 - Paste the new embedded URL and click on Confirm button.
2.1.4.5.2 Exit the Application
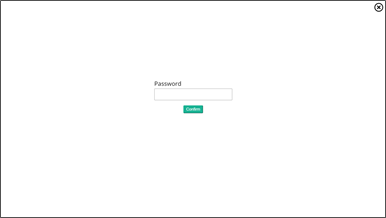
STEP 1 - Double-click on the top-right corner of the screen.
STEP 2 - Click on the Close button.
STEP 3 - Enter the password - ffc888 and click on Confirm.
2.1.5 Access to Space Occupancy Dashboard
STEP 1 - Access to FootfallCam Analytic Manager V9™: https://v9.footfallcam.com via browser.
STEP 2 - Click on Custom Report to access the Custom Report page.
STEP 3 - Click on Dashboard Name to access the Site Space Occupancy Dashboard.
2.2 Report Builder
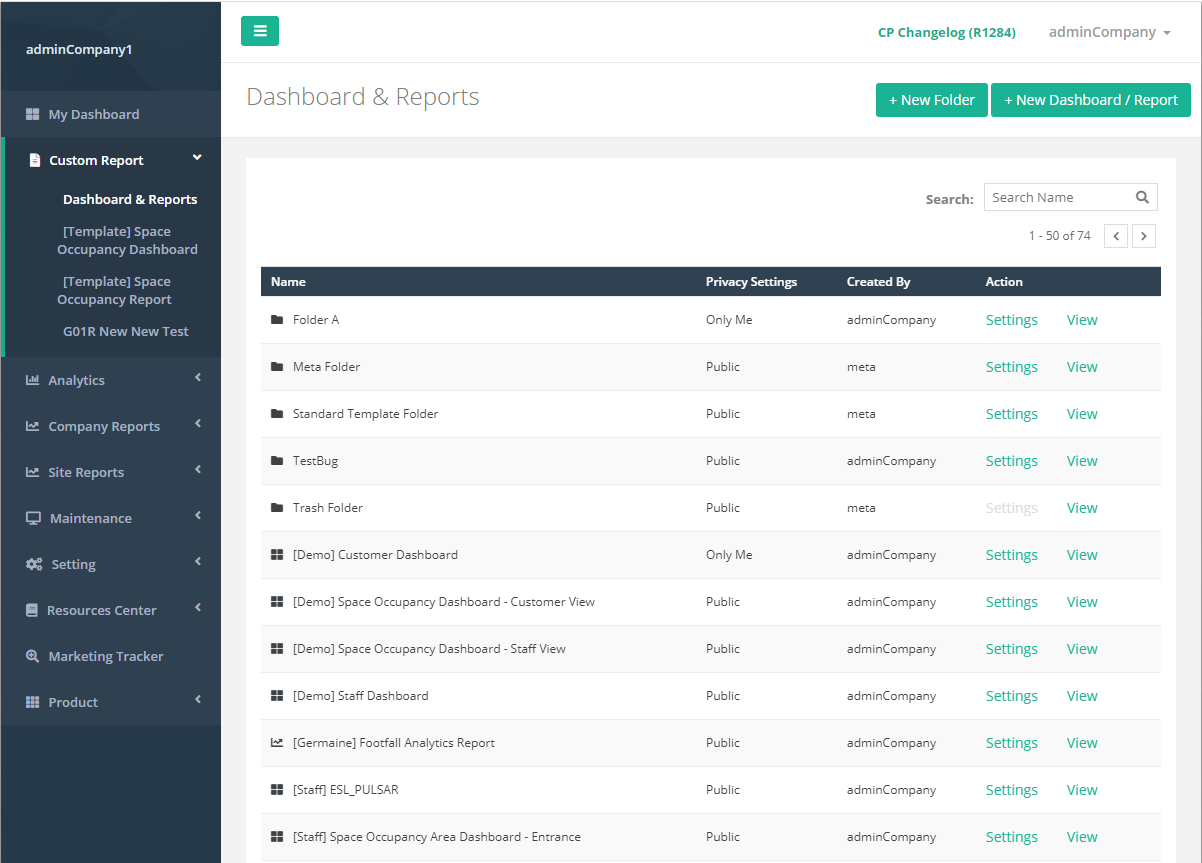
2.2.1 Dashboard & Reports Page Overview
2.2.2 New Folder Creation
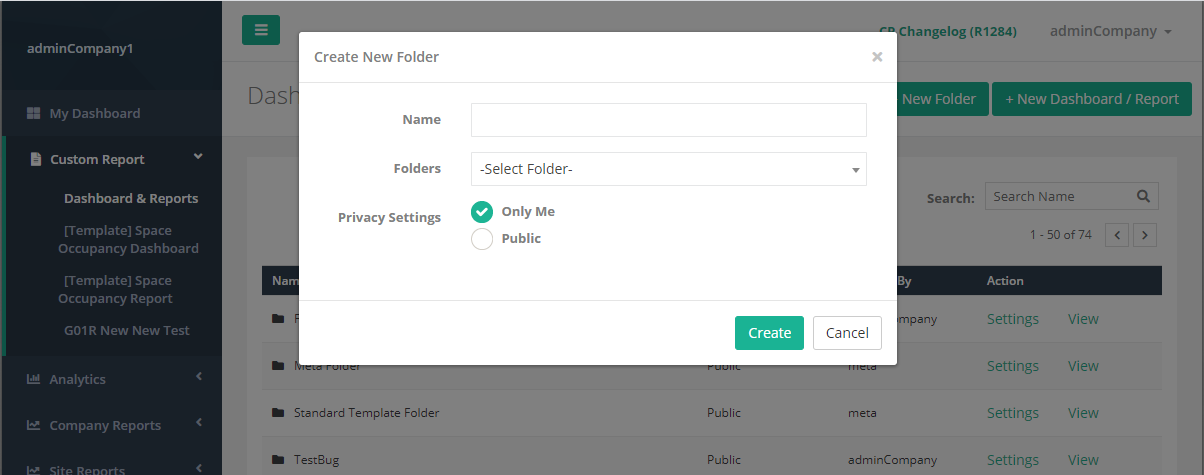
Name:
Users are required to enter a name for the folder. (Maximum 40 characters)
Folders:
Users are required to select the folder's location. If no folder is selected, the location of the folder will be on the main page. If a folder is selected from the dropdown list, the new folder will be the sub-folder of the selected folder.
Privacy Settings:
Users are able to set the privacy of the folder. Only the folder creator is able to see the folder if the privacy settings is set to private (Only Me).
If the role of the login user is User (not Admin), the user is not allowed to create a new folder and the folder creation button is hidden.
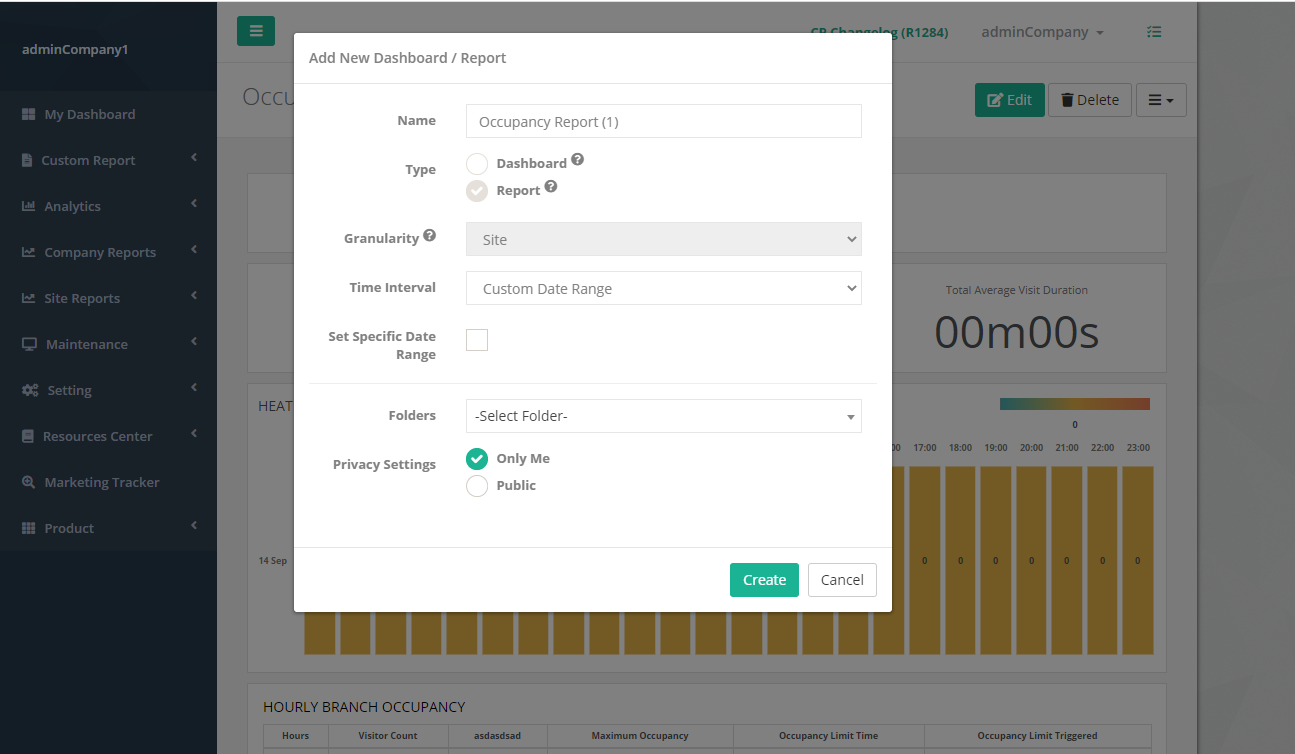
2.2.3 How to Create New Dashboard / Report
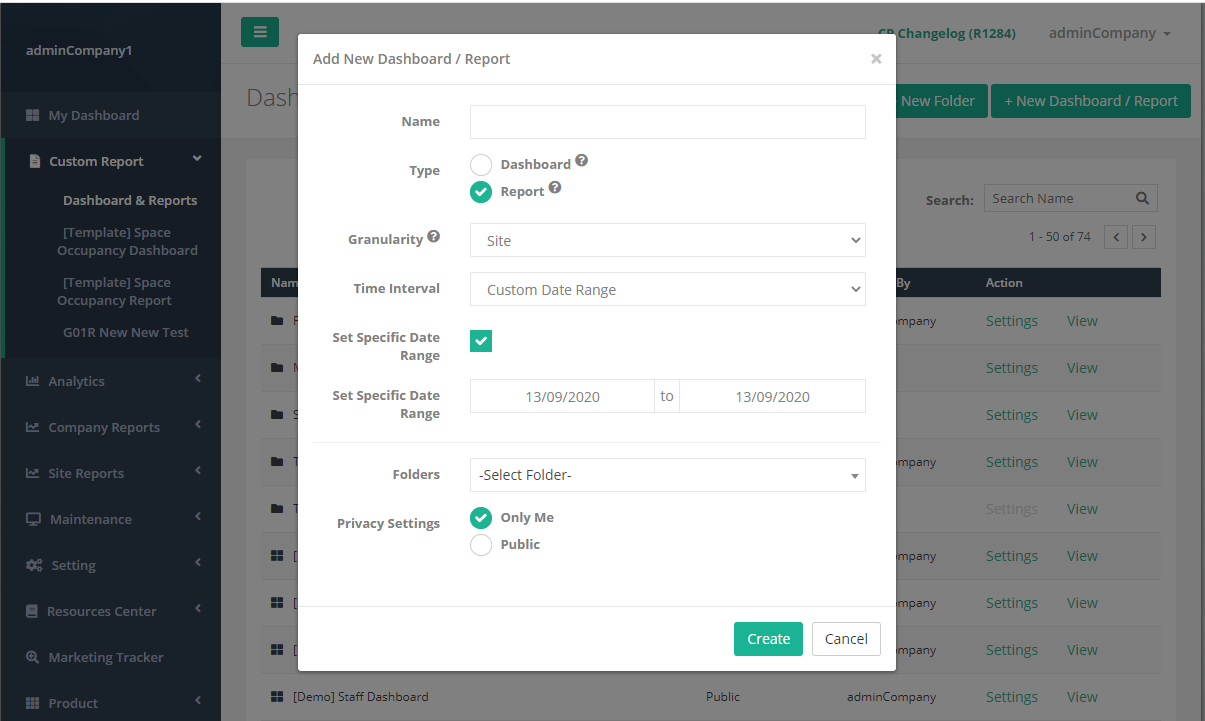
Name:
Users are required to enter a name for the dashboard / report. (Maximum 40 characters)
Type:
Users are required to choose the type of the report. For the Dashboard, it is used to monitor real-time data (e.g. Live Space Occupancy, Live Visitor Count, etc.) while for the Report, it is used to analyze the historical data (e.g. Daily Visitor Count, Monthly Visitor Count, etc.).
Granularity:
The default granularity for both dashboard / report is Site. Granularity is used to determine the level of data aggregation in the dashboard / report.
Time Interval:
For Dashboard, the time interval will be set as "Live" (Readonly). For Report, the dropdown option will exclude the "Live" option. If "Custom Date Range" is selected, Set Specific Date Range checkbox will be shown. If the checkbox is selected, users are required to choose Start Date and End Date for the report, else if the checkbox is unselected, the Start Date and End Date will be reset to null. If "Based on Marketing Campaign" is selected, the granularity will be reset to "Site" and set as readonly.
Folders:
Users are required to select the dashboard / report's location. If no folder is selected, the location of the dashboard / report will be on the main page. If a folder is selected from the dropdown list, the new dashboard / report will be located at the selected folder.
Privacy Settings:
If a folder is selected, the privacy settings will be overwritten with the selected folder's privacy settings and set the field as readonly, else if no folder is selected, users are able to select the privacy settings of the new dashboard / report.
If the role of the login user is User (not Admin), the user is not allowed to create a new dashboard / report and the dashboard / report creation button is hidden.
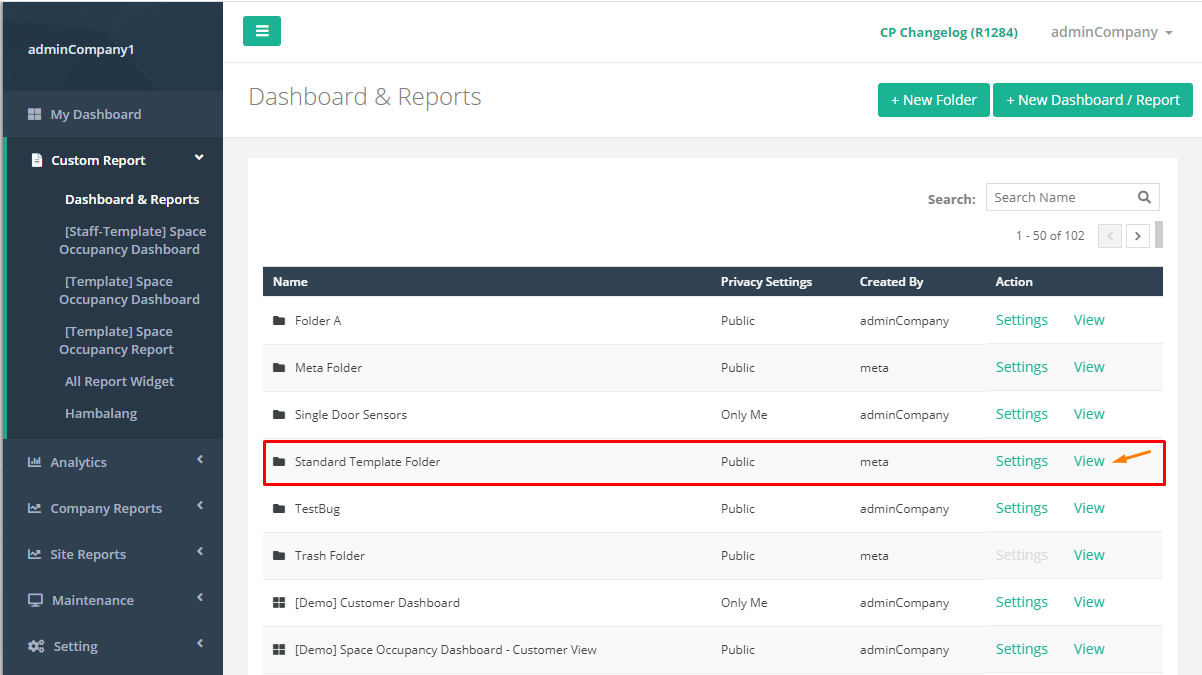
2.2.4 Space Occupancy Dashboard Configuration Using Duplicate Function
Standard Template Folder
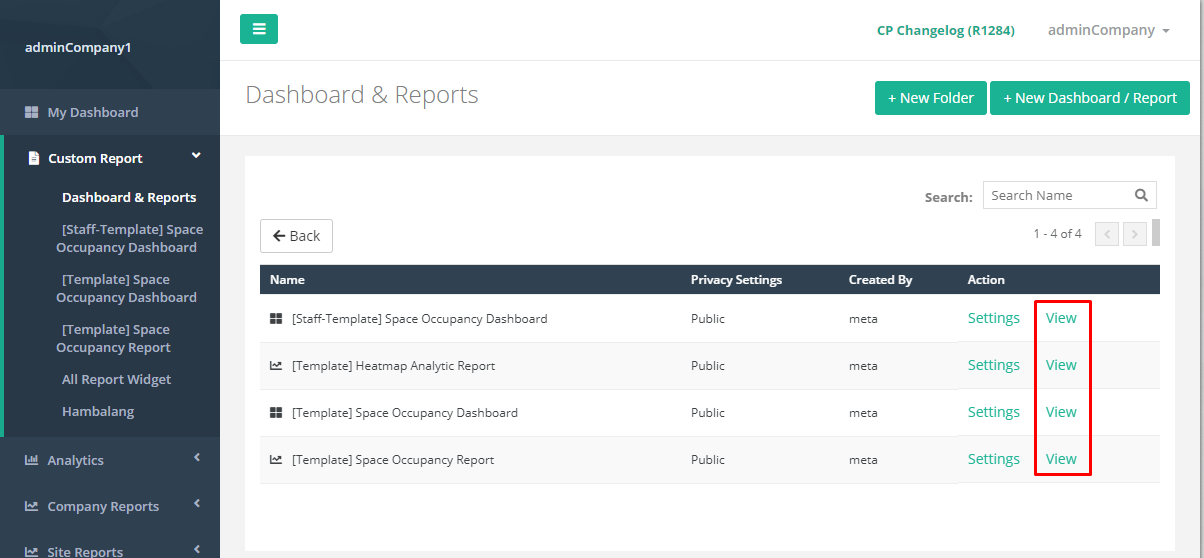
The default 2 dashboards (staff view and custom view) and 1 report template is allocated to this folder. Users can duplicate the required dashboard / report from this folder. Please follow the following steps for duplicating a new report using the template folder.
Step 1: Click the "View" button to access the folder which consists of the custom reports template.
Step 2: Click the "View" button for the report / dashboard that you want to make a copy.
Step 3: Click the "Duplicate" button from the dropdown list with bars icon.
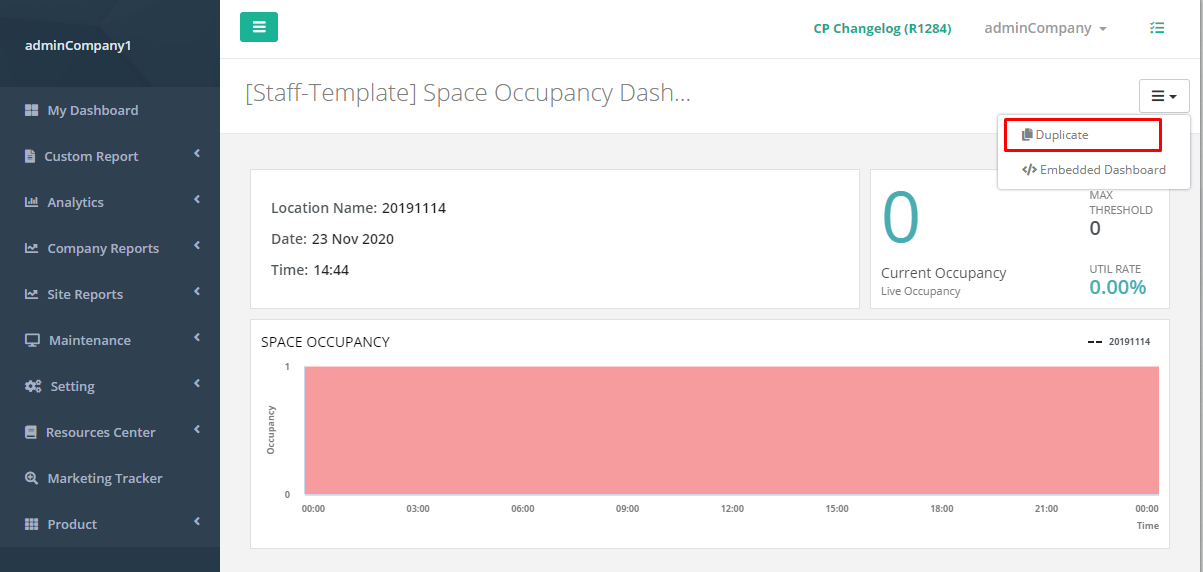
Step 4: Set the report setting for the new copy of the custom report. For how to set the report setting, kindly refer to the "Duplicate function" in 2.2.9.2.
Step 5: Please configure the widget settings and double check the widget configurations before save to prevent output incorrect data from the dashboard / report. The figures below show the mandatory widget configurations.
When make a new copy for Space Occupancy Dashboard, please take note to the following mentioned widgets.
Widgets to be configured: H03D, B01D, G01D
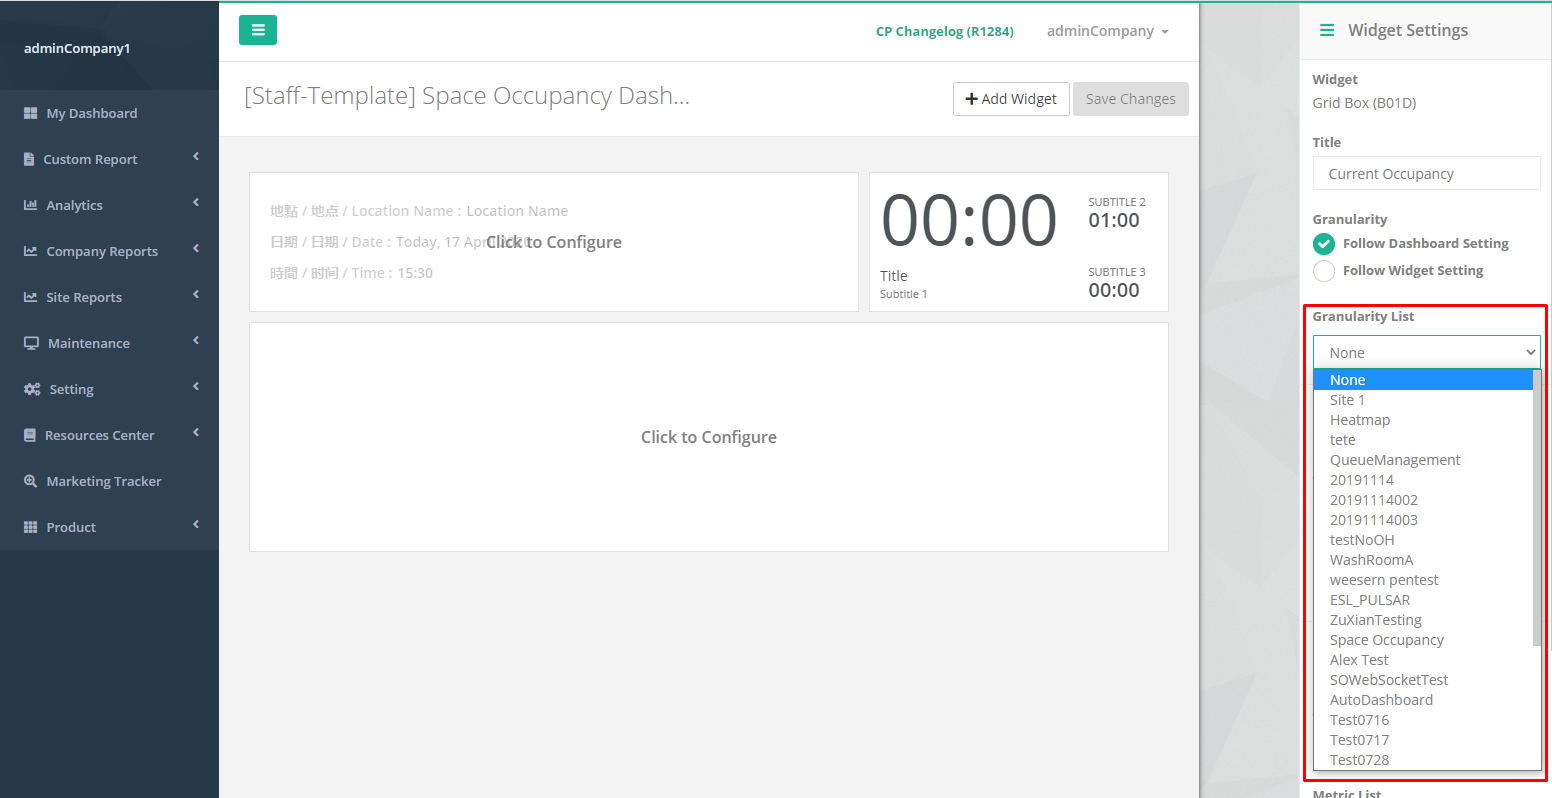
Please select the correct site for all the widgets mentioned above to prevent incorrect data output.
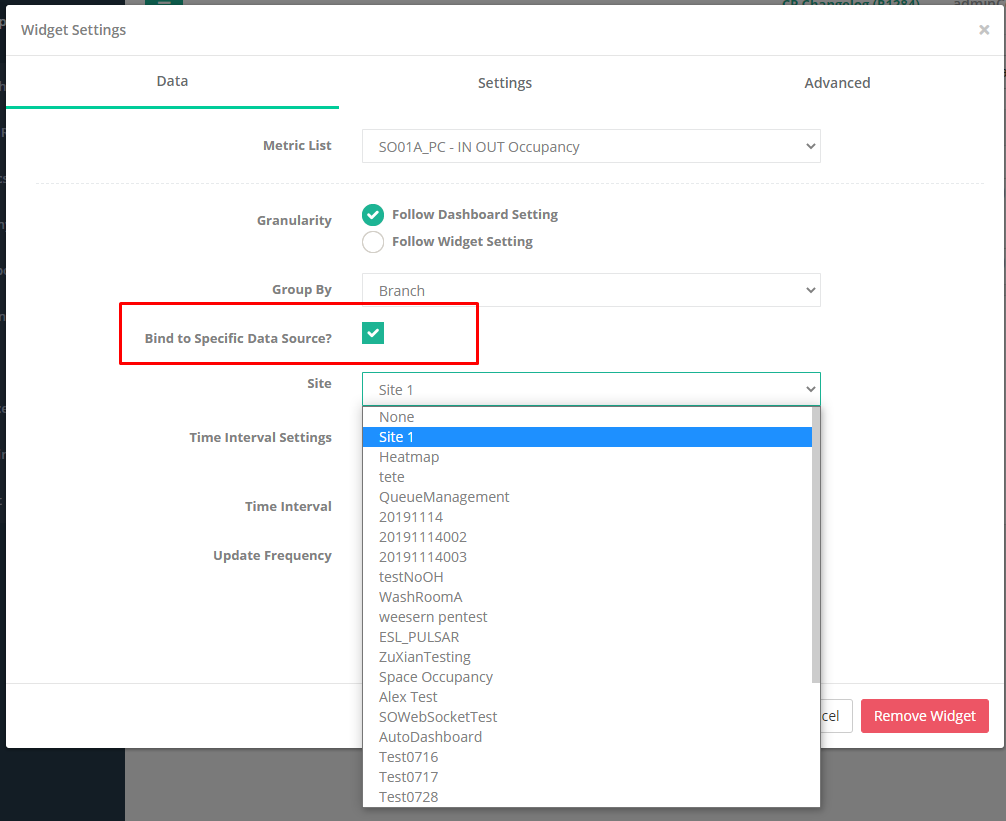
For G01D, please tick the checkbox for "Bind to Specific Data Source?" in the Data tab and select the correct site and click "Apply" to apply the settings.
2.2.5 Tree View Structure
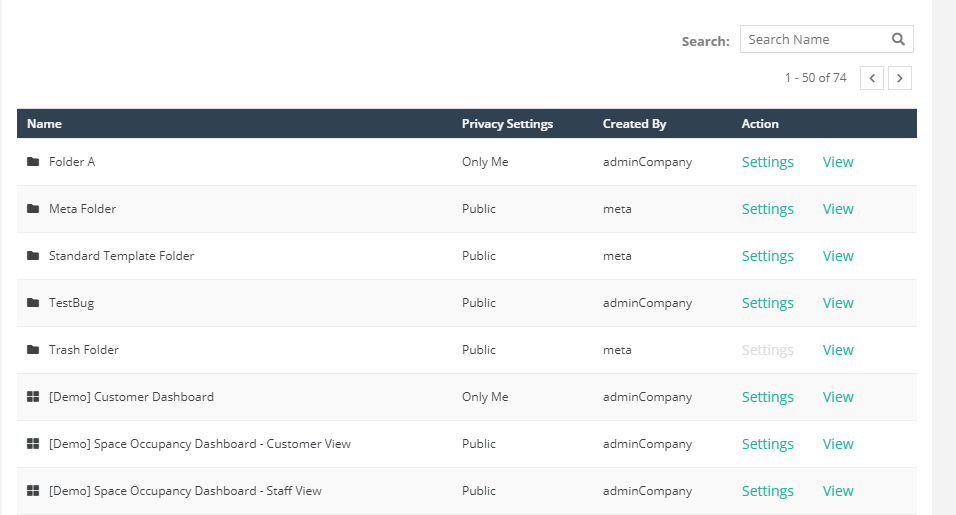
The treeview is sorted by Folders first then Dashboard / Report according to alphabetical order. Users are able to search Folder / Dashboard / Report using the search box. Created By field displays the user who created the folder / dashboard / report.
Trash Folder
All deleted folders / dashboards / reports are allocated to this folder. Users are able to restore the deleted folders / dashboards / reports by clicking the "Restore" button.
2.2.6 Setting and Configuration
2.2.6.1 Folder Settings
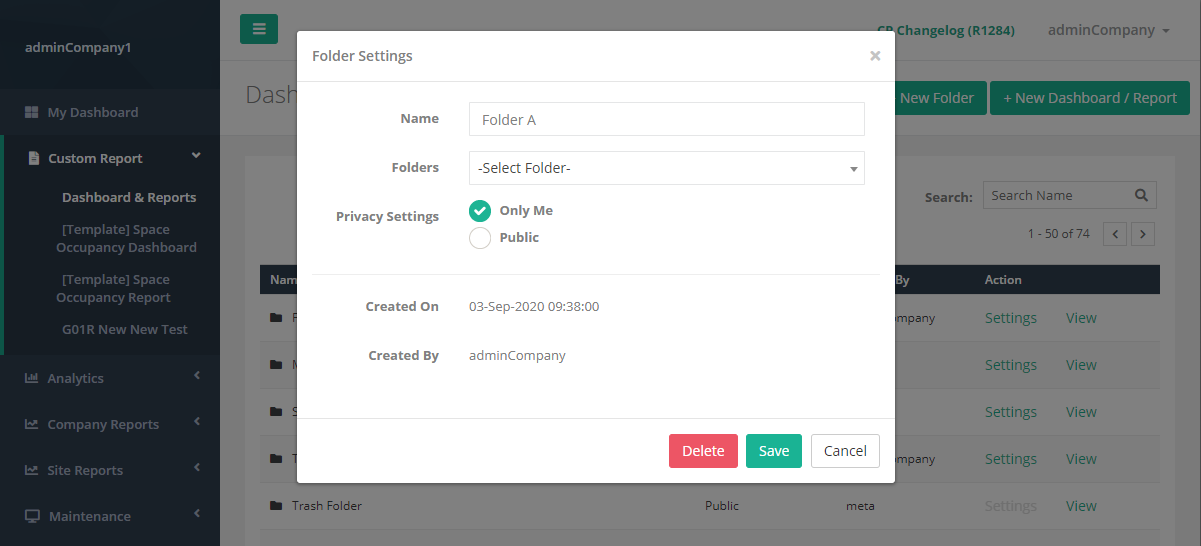
Name:
Users are able to rename the folder's name. By default, show the current folder name.
Folders:
Users are able to relocate the folder location by selecting the list of folders from the dropdown options. By default, show the current folder location.
Privacy Settings:
If a folder is selected, the privacy settings will be overwritten with the selected folder's privacy settings and set the field as readonly, else if no folder is selected, users are able to select the privacy settings of the folder. By default, show the current folder privacy settings.
Created On: (Readonly field)
Creation date of the current folder.
Created By: (Readonly field)
Username of the current folder creator.
If the role of the login user is User (not Admin), the user is not allowed to delete the folder and make changes for the folder settings. Both "Delete" and "Save" buttons are hidden.
2.2.7 View the Created Report/Dashboard
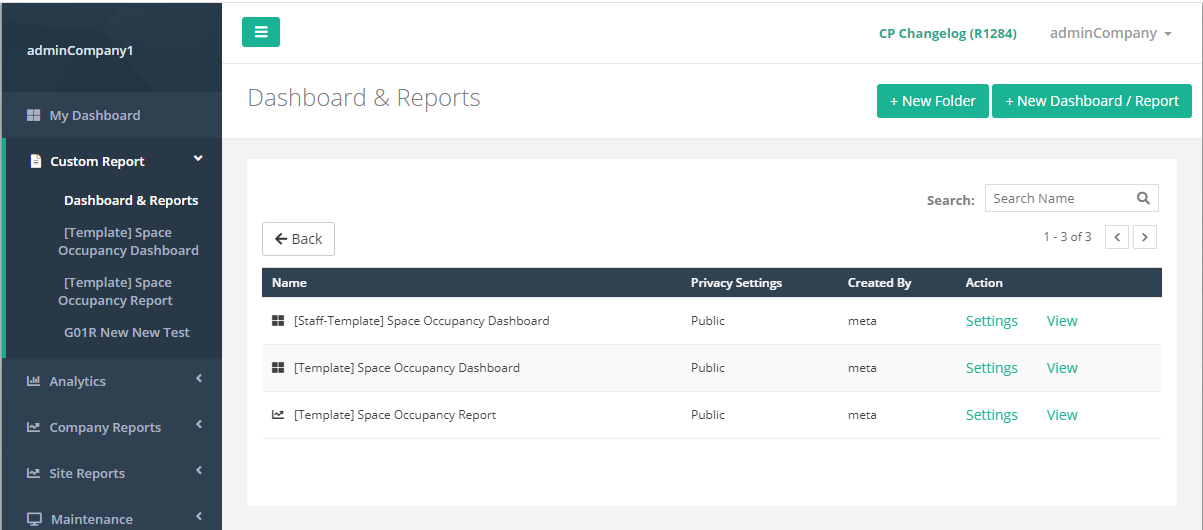
When the "View" button is clicked, the user will be redirected to treeview which shows all the dashboards / reports of the selected folder. Users are able to go back to the parent folder by clicking the "Back" button.
2.2.8 Dashboard / Report Settings
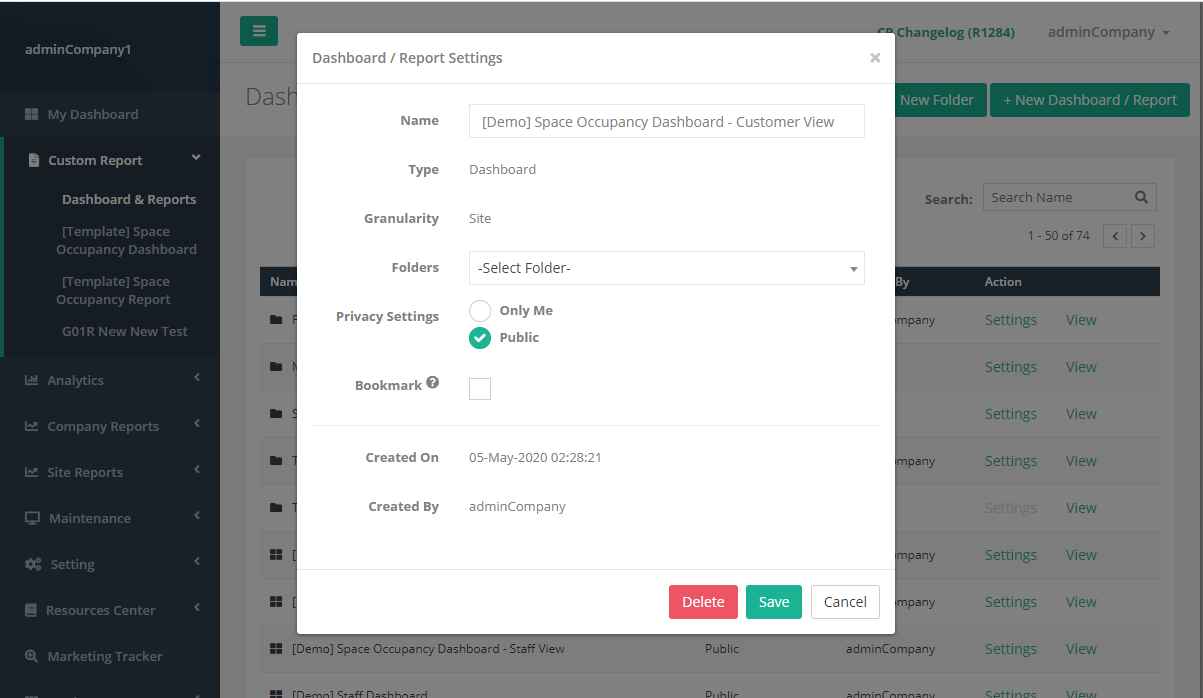
Name:
Users are able to rename the dashboard's / report's name. By default, show the current dashboard / report name. If the dashboard / report is not created by the login user and the role of the login user is "User" (not Admin), this field is set as readonly.
Type: (Readonly)
This field shows the type of custom report.
Granularity: (Readonly)
This field shows the current dashboard's / report's granularity.
Folders:
Users are able to relocate the dashboard / report location by selecting the list of folders from the dropdown options. By default, show the current dashboard / report location.
Privacy Settings:
If a folder is selected, the privacy settings will be overwritten with the selected folder's privacy settings and set the field as readonly, else if no folder is selected, users are able to select the privacy settings of the current dashboard / report. By default, show the current dashboard / report privacy settings.
Bookmark:
Bookmarked dashboard / report will be pinned at the Left Side Panel under the menu item "Dashboard & Reports". The maximum number of the bookmarked dashboard / report is 5 per UserID. If it exceeds the number of bookmarked dashboards / reports, the checkbox is disabled and displays "Maximum number of bookmarked dashboard /reports reached." Only the checkbox of bookmarked dashboard / report is enabled. The bookmarked dashboard / report is sorted by alphabetical order.
Created On: (Readonly field)
Creation date of the current dashboard / report.
Created By: (Readonly field)
Username of the current dashboard / report creator.
If the role of the login user is User (not Admin), the user is not allowed to delete the dashboard / report and make changes for the dashboard / report settings. Both "Delete" and "Save" buttons are hidden.
2.2.8.1 View Button (Dashboard / Report)
When the "View" button is clicked, redirect to the dashboard / report View Mode.
2.2.9 Occupancy Report
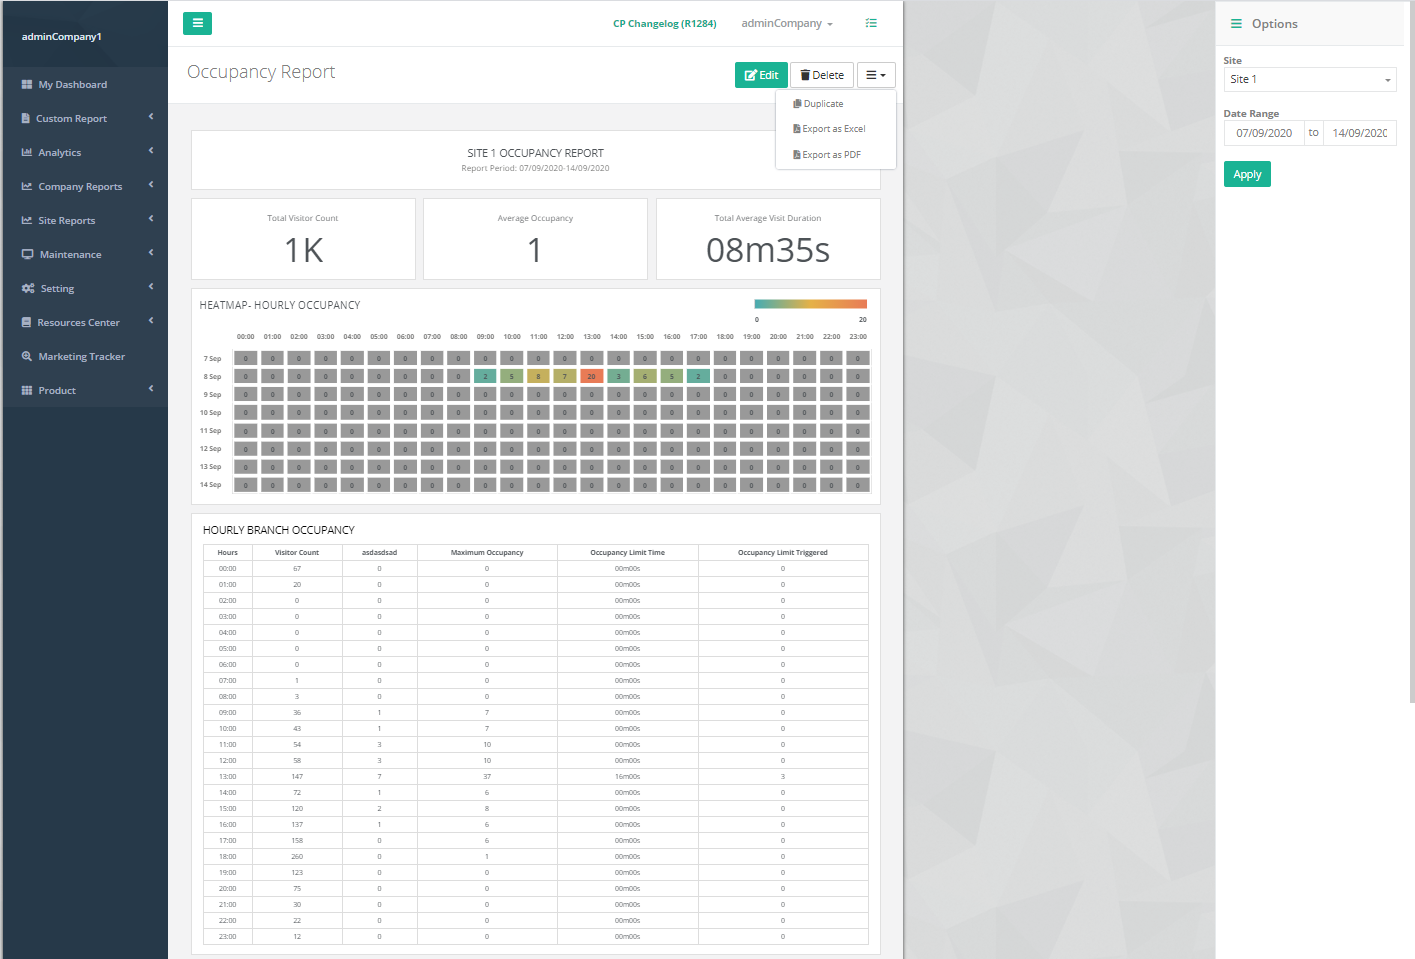
2.2.9.1 Filter Options (Right Sidebar)
For dashboard (custom) and report, the granularity and time interval selection at the right sidebar will depend on the granularity and time interval selected during creation. Click "Apply" to view the data with the selected granularity and time interval.
2.2.9.2 Duplicate function
Name:
This field is editable. By default, show original dashboard / report name with index.
Type: (Readonly)
This field follows the selected type of the original dashboard / report.
Granularity: (Readonly)
This field follows the selected granularity of the original dashboard / report.
Time Interval:
This field is editable. By default, follow the selected time interval of the original dashboard / report.
Folders:
This field is editable. By default, follow the selected folder of the original dashboard / report. If a folder is selected, privacy settings will be overwritten with the selected folder and set this field as read-only.
Privacy Settings:
This field is editable. By default, follow the selected privacy settings of the original dashboard / report.
2.2.10 How to Edit the Dashboard
If the role of login user is "User" (not Admin), the login user is unable to modify the dashboard / report.
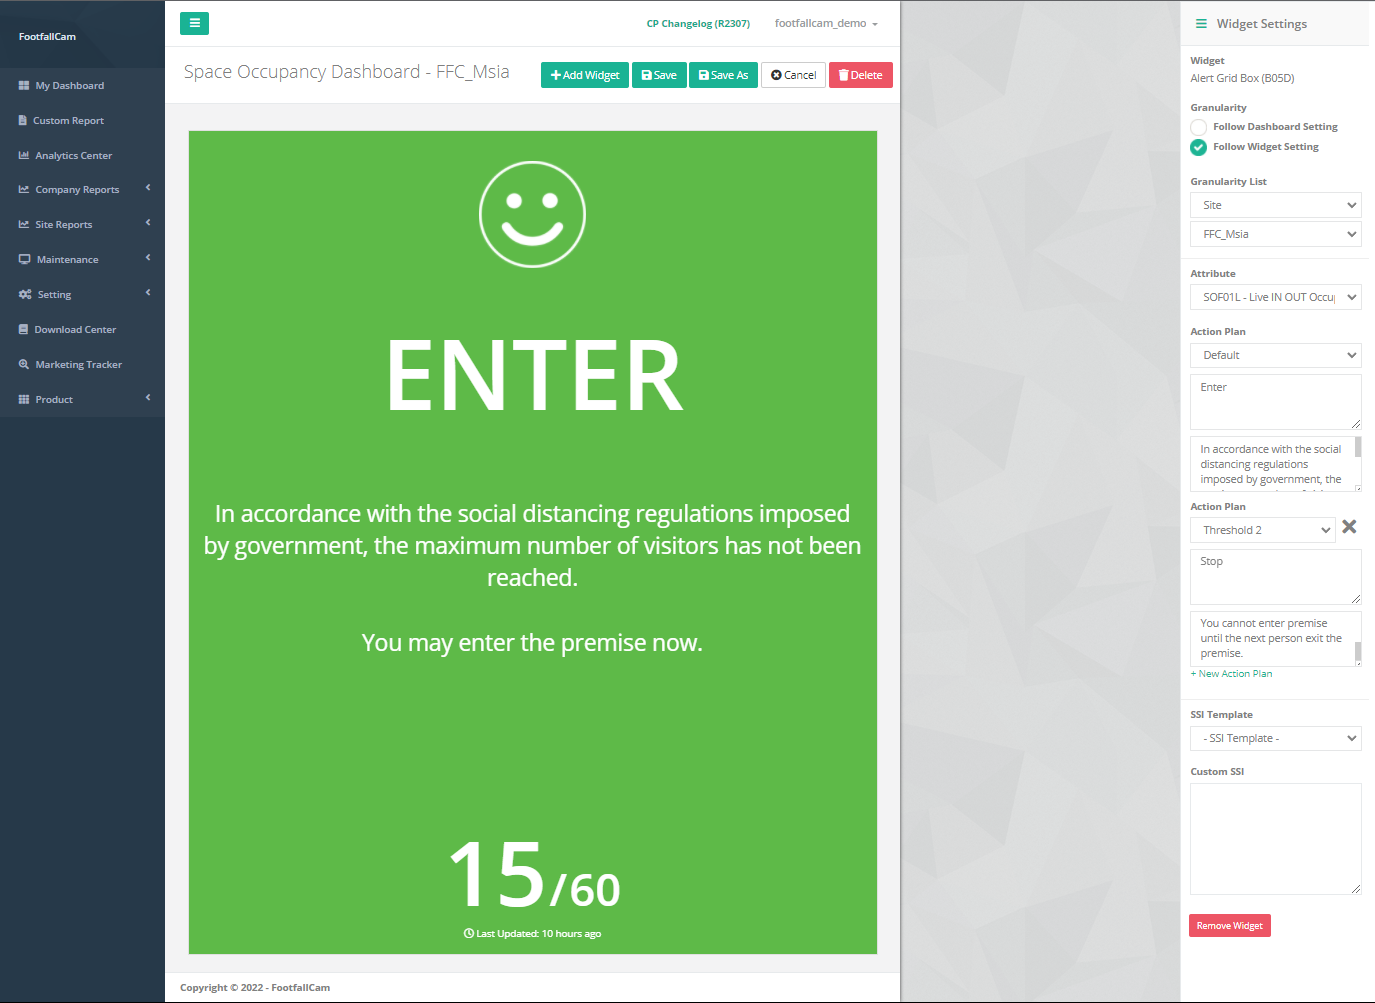
Granularity:
-
Follow Dashboard / Report Setting
The Granularity will follow the dashboard / report selected granularity during creation and the dropdown granularity list will depend on the original selected granularity.
-
Follow Widget Setting
Users can select the granularity manually and the dropdown granularity list will depend on the selected granularity.
Time Interval:
-
Follow Dashboard / Report Setting
The Time Interval will follow the dashboard / report selected time interval during creation.
-
Follow Widget Setting
Users can select the time interval manually.
Attribute/Metric:
Select metric for the data visualization.
Remove Widget Button:
Remove the widget from the reports.
To display the threshold value for the selected metric, make sure the metric threshold definition is defined and value is set. For more information on how to Create Metric Threshold Definition and Value, please refer to 15.5.2 Metric Threshold.
2.3 Integration with GPIO
-
Description: A feature used to integrate the site's sensor door with the site's occupancy count.
-
Usage: It is used to automatically close the door when the site occupancy has breached the threshold set by users and opens again only when the occupancy goes under the threshold again when some visitors have exited from the site.
-
Additional Kit: Live Occupancy Function (refer to Chapter 2: Live Occupancy Configuration)
-
Input from Users: Device serial of which users which to have this feature.
2.4 Live Occupancy Management
2.4.1 Resetting Live Occupancy
| Description |
To manually reset the live occupancy count, call this endpoint and provide the desired occupancy value along with the relevant area information in the request payload. You would also need to include the API header as |
| Endpoint | https://v9.footfallcam.com/v9/api/v2/Occupancy/SetManualOccupancy |
| Method | POST |
| Body - JSON | { "EntityType": "Area", "EntityId": "{AreaId}", "PeopleType": "{PeopleType}", "Value": {Occupancy} } |
| Response | If successful -> No response (200 OK) If unsuccessful -> Unauthorized (400 Bad Request) |
| Remark |
{AreaId}: The ID of the area where the occupancy count will be reset. {PeopleType}: Must be one of the following values: {Occupancy}: The desired occupancy value. |