


1. What are Data Import and Export?
For better data analysis, data integration will always be required to consolidate the data from different teams and different systems into the same platform. Data Import and Export is a centralise application which make the data transfer convenient for the data analysts.
2. Features
This application included:
- Data Import: Integrate data from other system (such as sales data, staff data, etc.) into Analytics Manager v9 portal.
- Data Export: Migrate footfall related data to another platform via data export.
- BI Plugins: Direct connection to FootfallCam V9™ database for real-time data review.
2.1 Import
User can import various type of data into Analytics Manager v9 portal, to obtain secondary metrics. Our system is capable for various types of data import, for more details kindly refer to Data Import.
2.2 Export
User can export the footfall data collected in Analytics Manager v9 portal based on your specific needs. There are various method available in our system, for more details kindly refer to Export Data from Server.
2.3 BI Plugins
BI (business intelligence) Plugins are software that can connect directly to the database of FootfallCam V9™ to retrieve data for Business Intelligence purposes. FootfallCam V9™ supports the integration of three BI plugins, namely Microsoft Power BI, Microsoft Excel and Tableau.
The advantage of BI plugins lies in their direct connection to the database, allowing users to get their latest data in real-time to construct graphs, charts and other visualisations however they see fit.
Without these plugins, users are limited to the various forms of data visualisations on FootfallCam V9™ or have to routinely export past data from FootfallCam V9™ to construct their visualisations. Even so, the data obtained will not be as updated as that from the plugins, as the latter is synchronised with the FootfallCam V9™ database.
2.3.1 Power BI
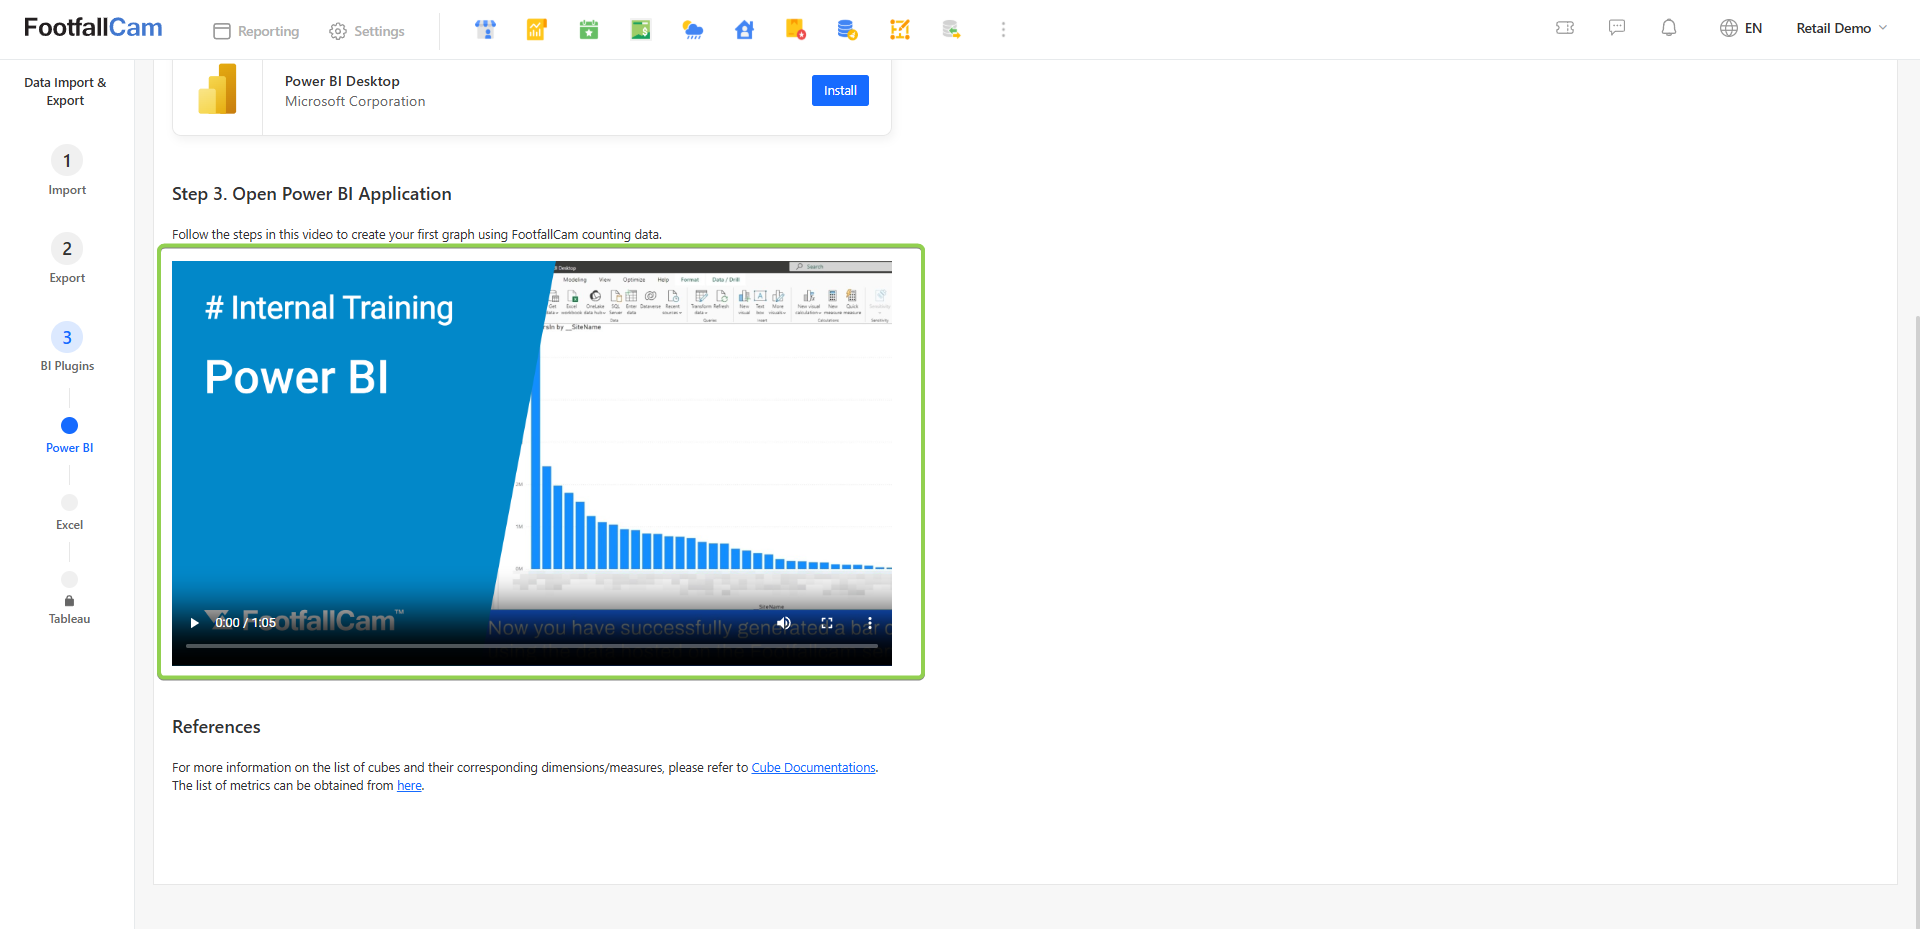
We are currently using Power BI Desktop to retrieve and visualize the data. Please refer to the following steps to begin using Power BI. For more information on the list of cubes and their corresponding dimensions/measures, please refer to Cube Documentations. The list of metrics can be obtained from here.
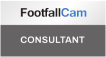
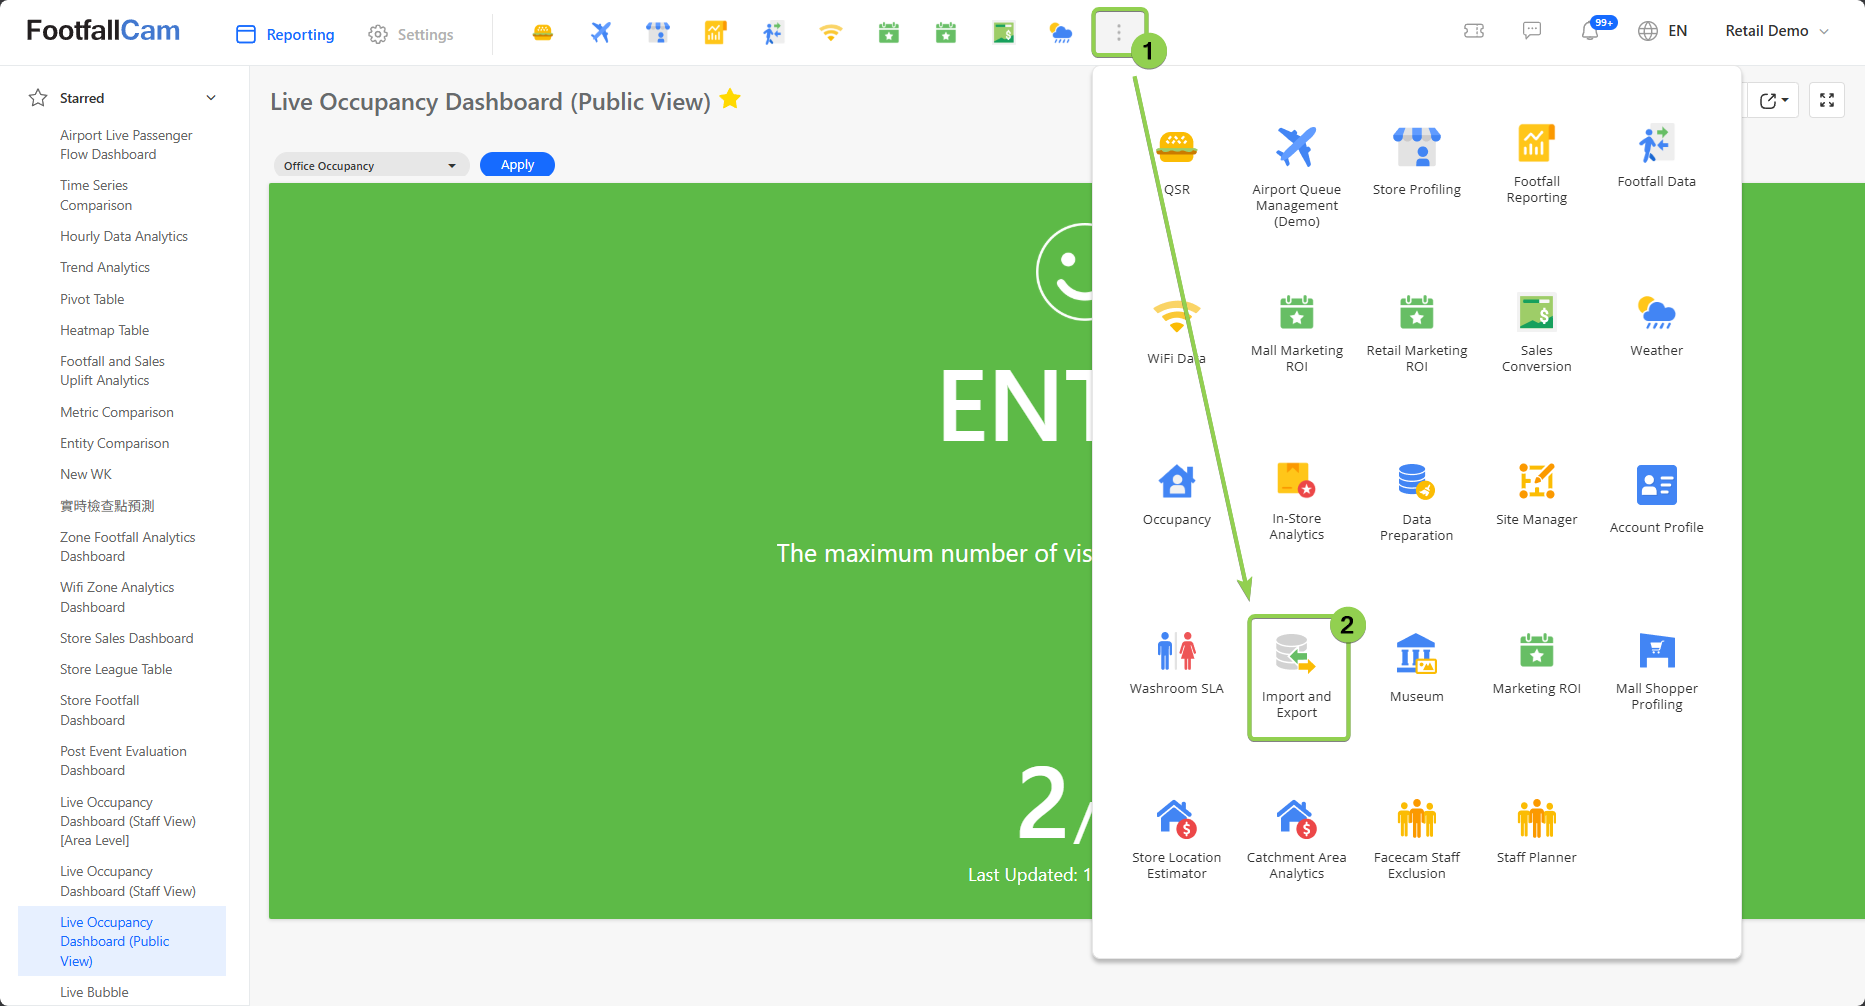
Step 1 - Find and click the "Import and Export" app. If the app is absent among your available apps, kindly contact "[email protected]".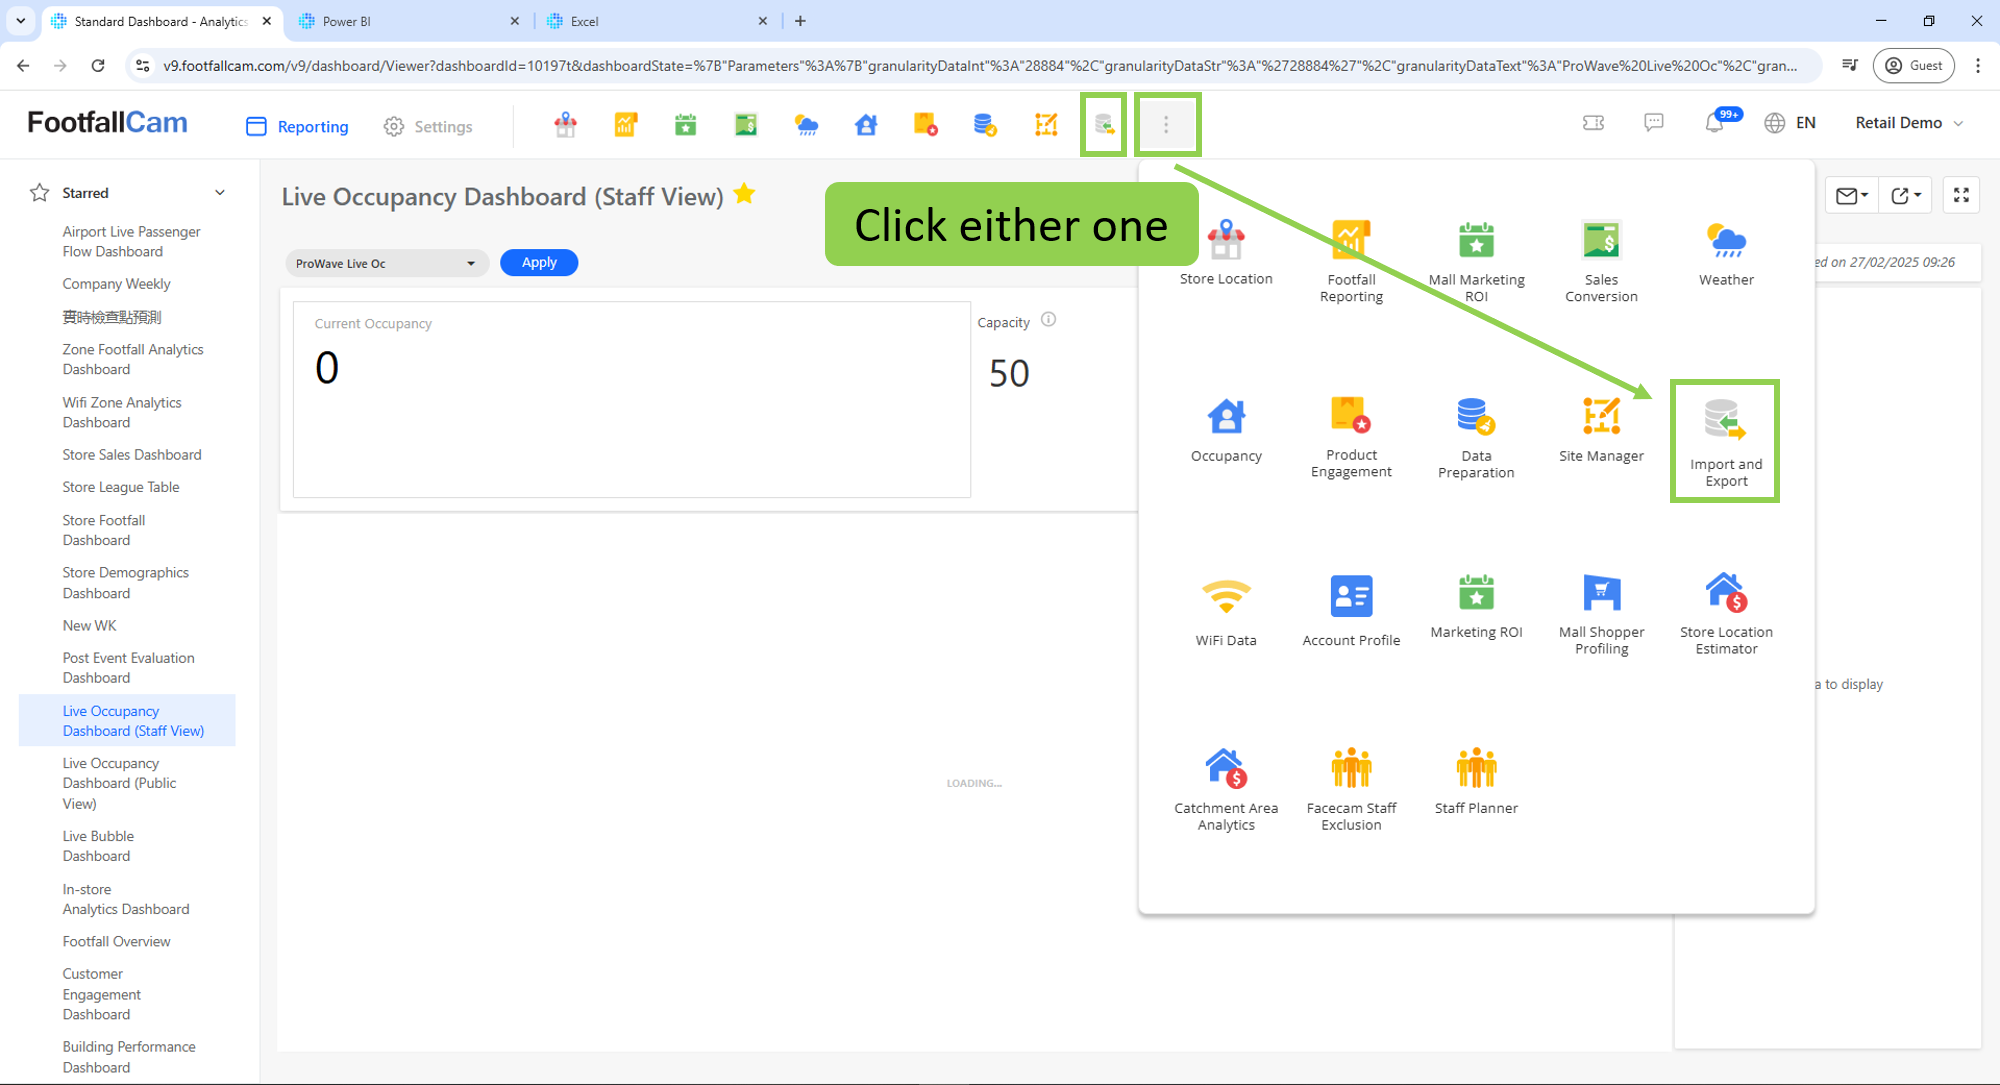
Step 2 - In the left navigation bar, click "BI Plugins" and then "Power BI".
Step 3 - Observe the Username and Password fields. If no credentials have been generated yet, click the "Get Credential" button.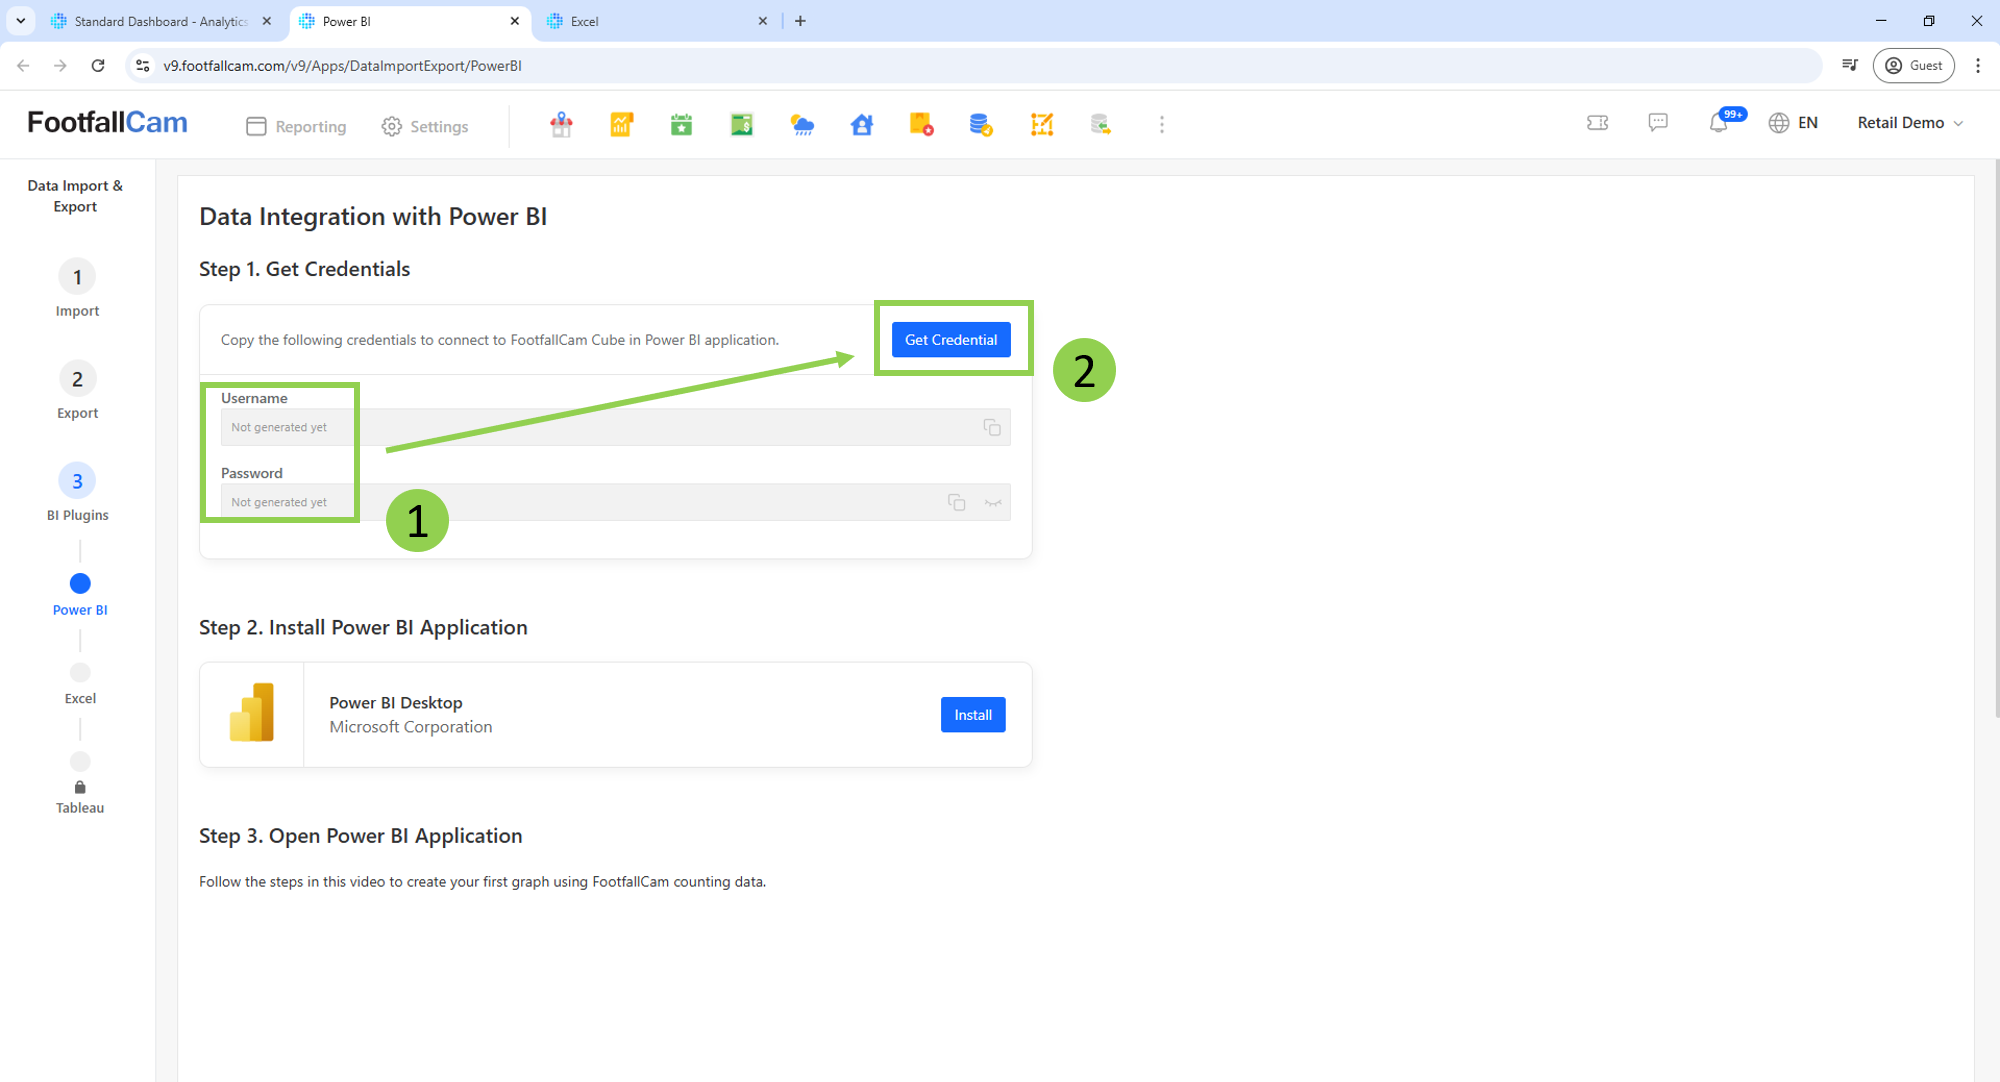
Step 4 - Click the "copy" icon to copy your credentials to the clipboard.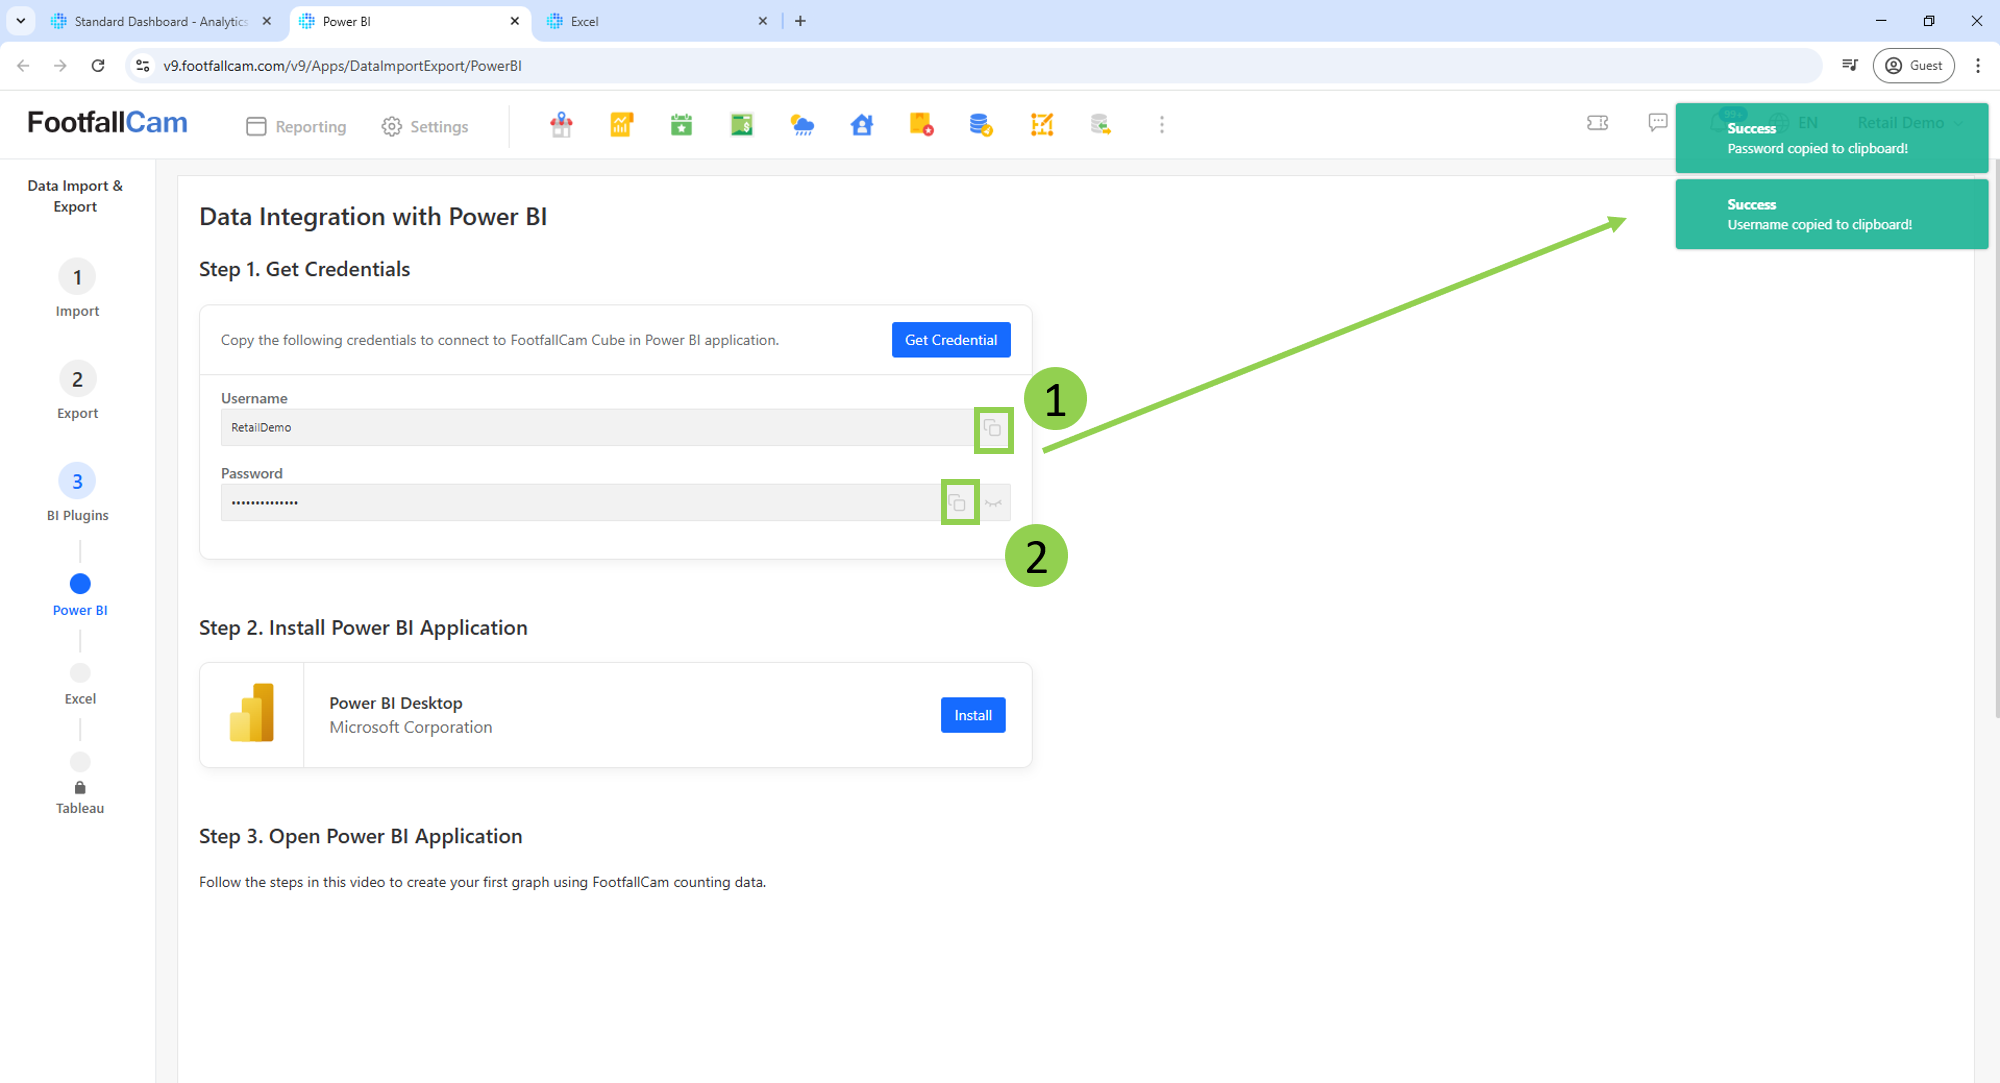
Step 5 - If you haven't installed Power BI yet, click the "Install" button to be redirected to the official Microsoft site to download the software.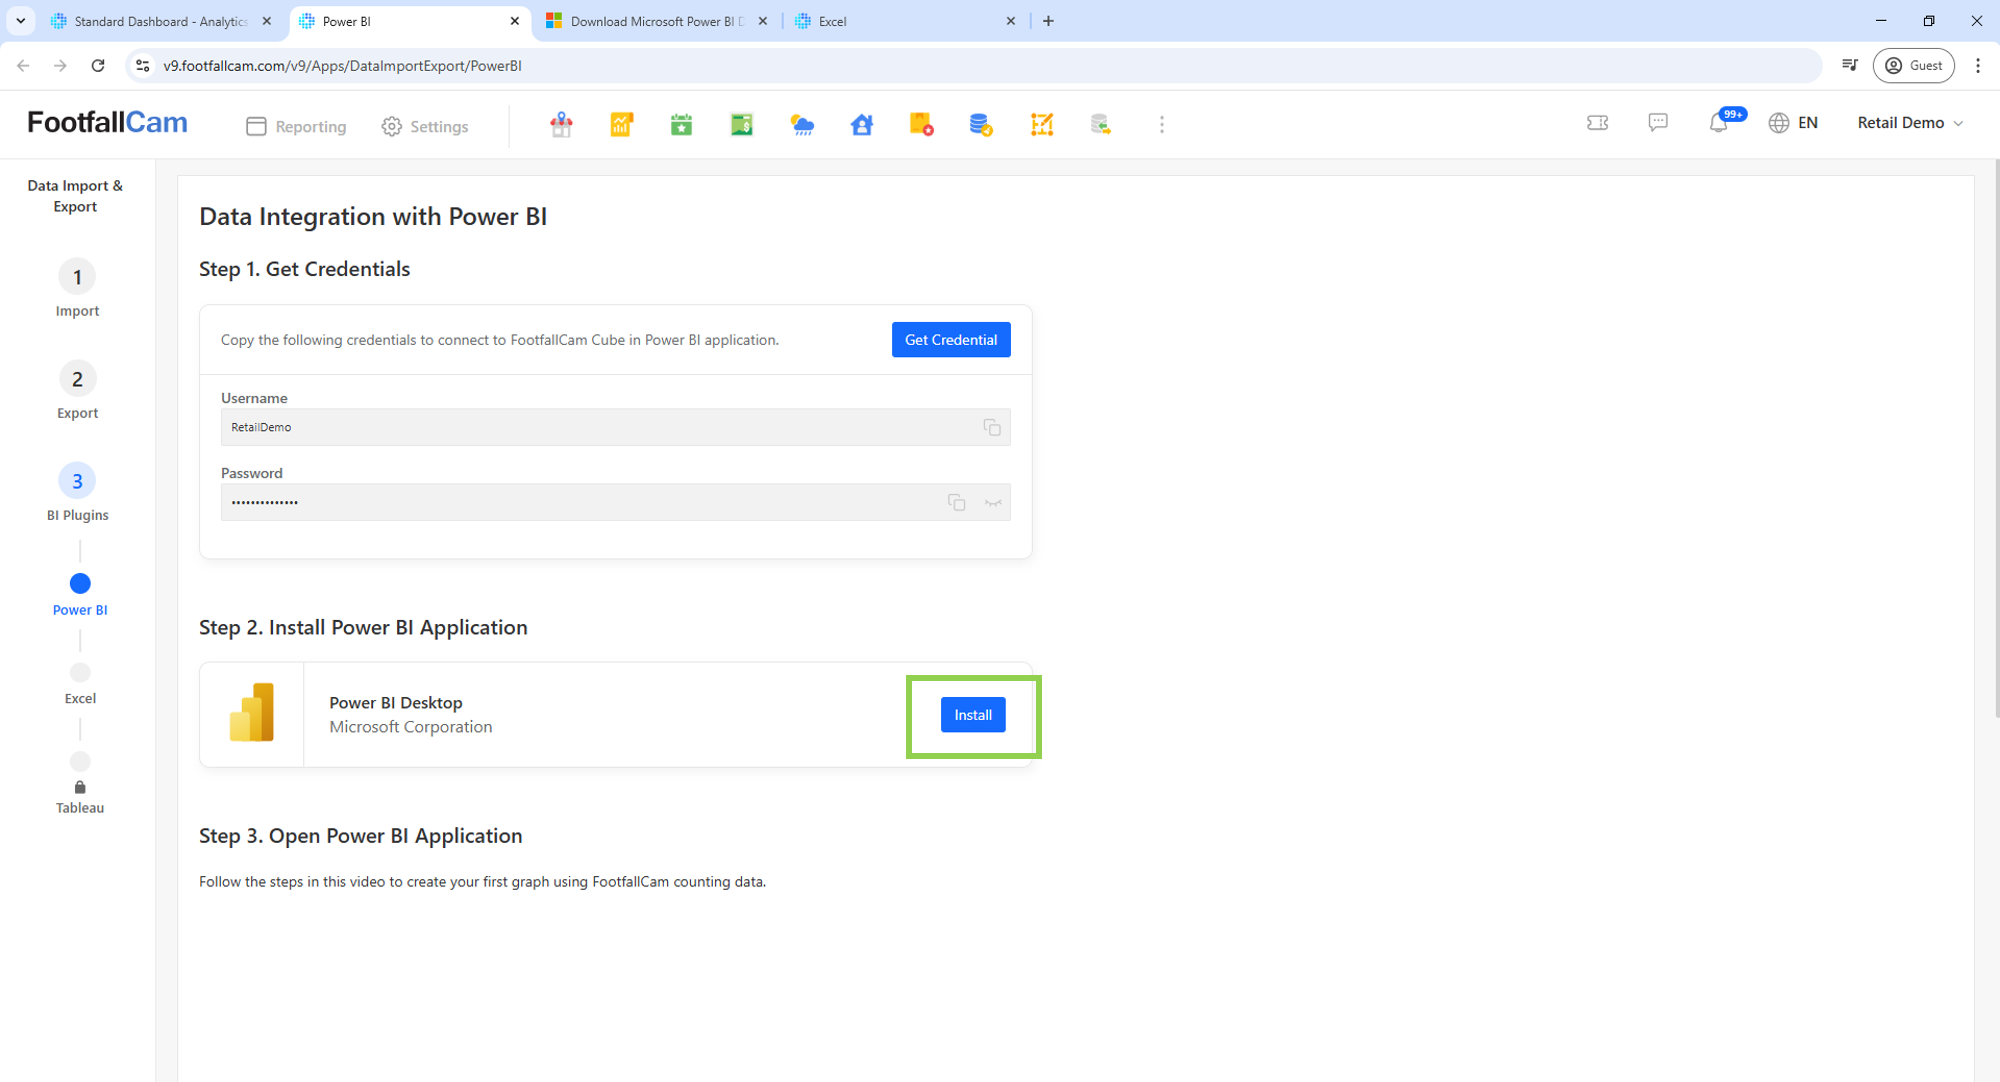
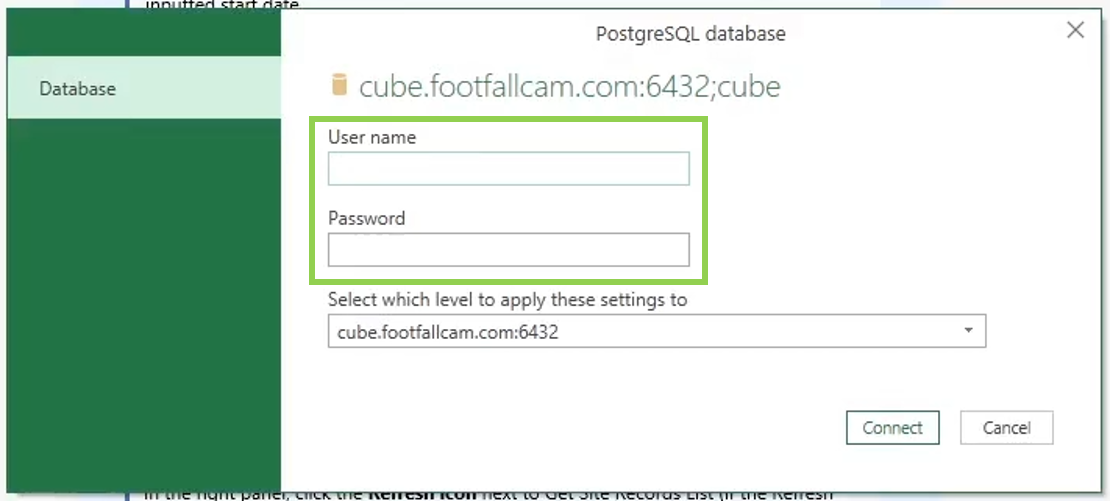
Step 6 - Observe the instructional video to connect your Power BI to the FootfallCam V9™ database (cube.footfallcam.com:6432). When prompted to enter the credentials, use the credentials obtained from Step 4.
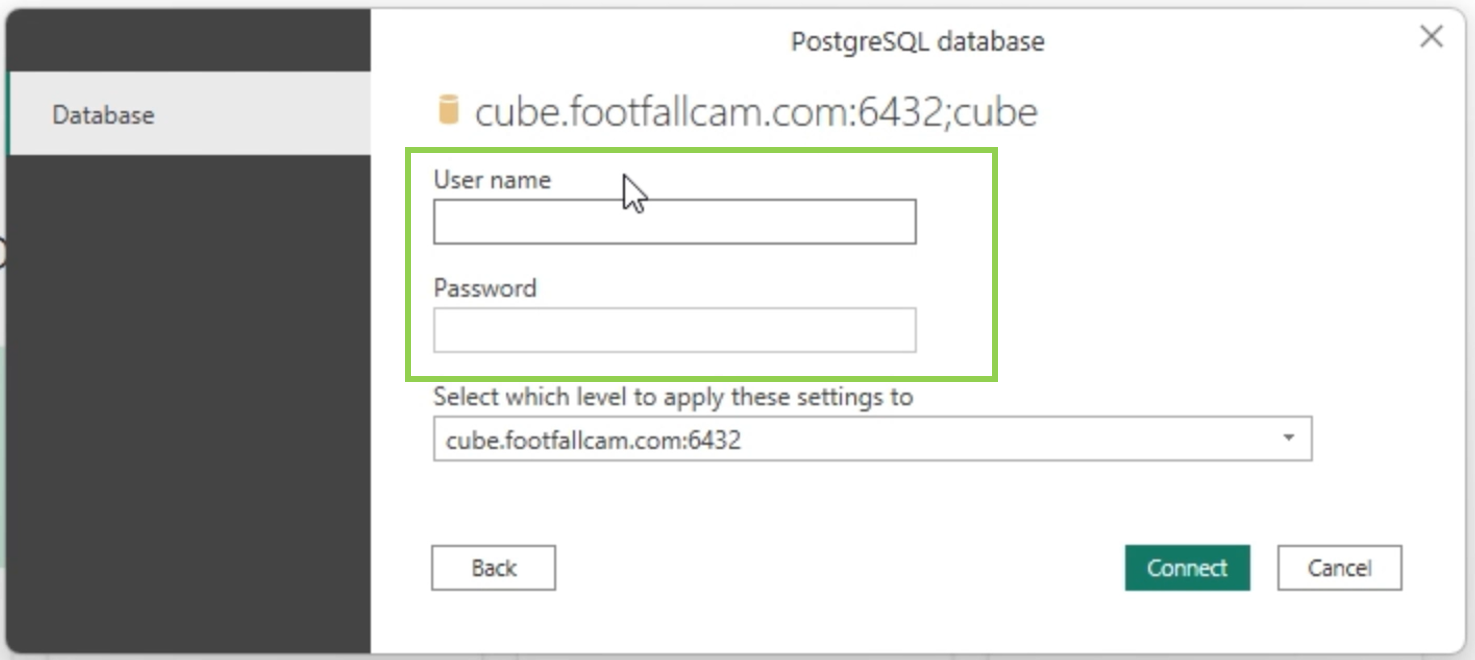
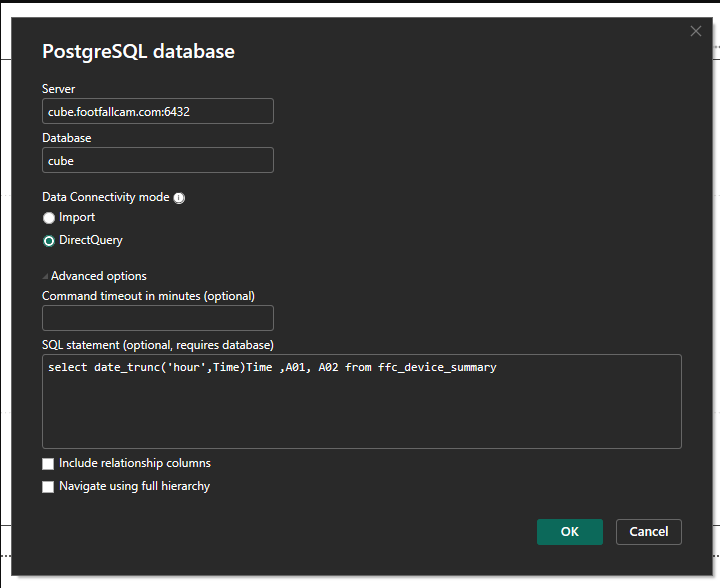
2.3.1.1 Using SQL Queries to get HOURLY data
If you want to retrieve specific data, use an SQL query to obtain the data. Please follow the video instructions up to 0:22, which covers connecting to the PostgreSQL database. Before clicking the "OK" button, follow these steps to complete the configuration:
2.3.1.2 Power BI Application
If you prefer to use Power BI Service, it is necessary to configure an on-premises data gateway or a personal gateway. This setup is required to support encrypted connections when building and publishing reports. As the gateway configuration involves access to internal systems and sensitive credentials, it is preferred that the setup be configured from your end.
For detailed instructions, please refer to Microsoft's official documentation on setting up and troubleshooting the on-premises data gateway.
In addition, you may find the following resources helpful: Install View Guide (ZIP file) and Setup Video Guide (ZIP file)
2.3.1.3 Power BI Templates
Below is the custom Power BI templates.
- Template 1
- Columns : Date/Time, Store Code, Footfall In, Footfall out, Outside traffic, Sales Conversion
- Template 2
- Columns : Date/Time, Store Code, Outside traffic, Turn In Rate, Total Transaction Count, Sales Conversion
2.3.2 Excel
To utilise Excel for data visualisation, please follow the steps below. For more information on the list of cubes and their corresponding dimensions/measures, please refer to Cube Documentations.
Step 1 - Find and click the "Import and Export" app. If the app is absent among your available apps, kindly contact "[email protected]".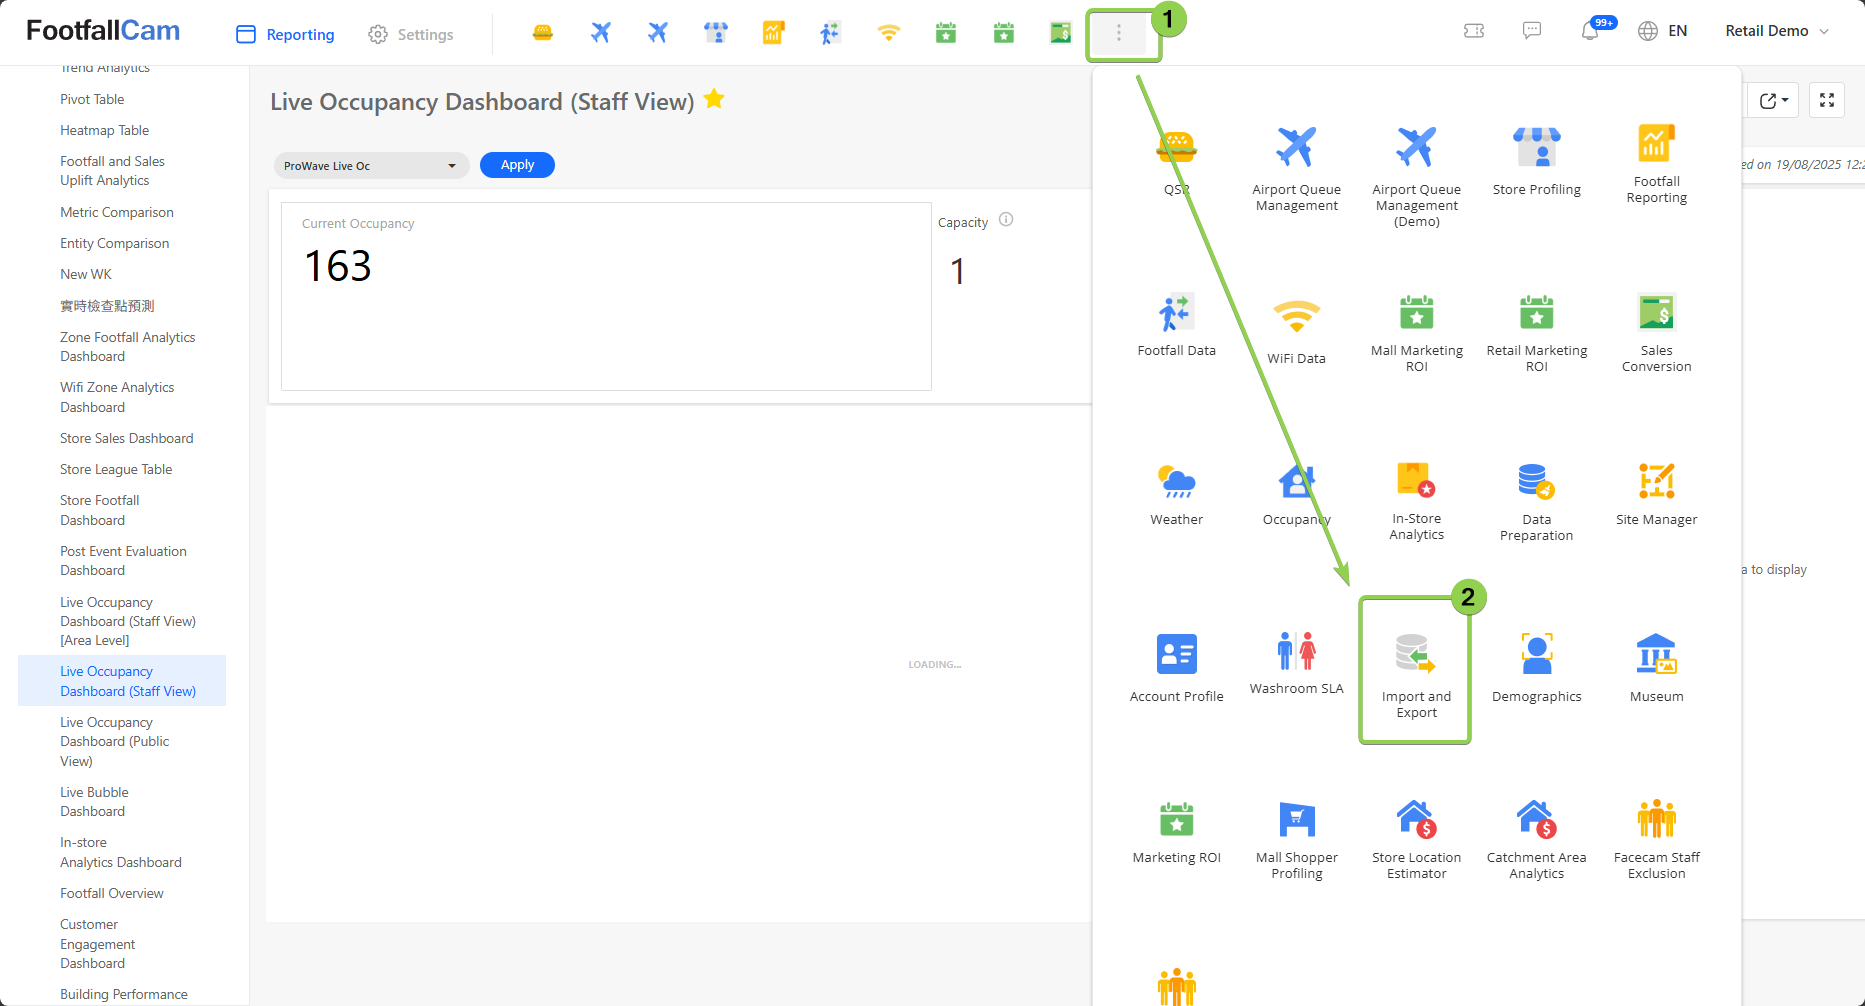
Step 2 - In the left navigation bar, click BI Plugins > Excel to open the Data Integration with Excel page.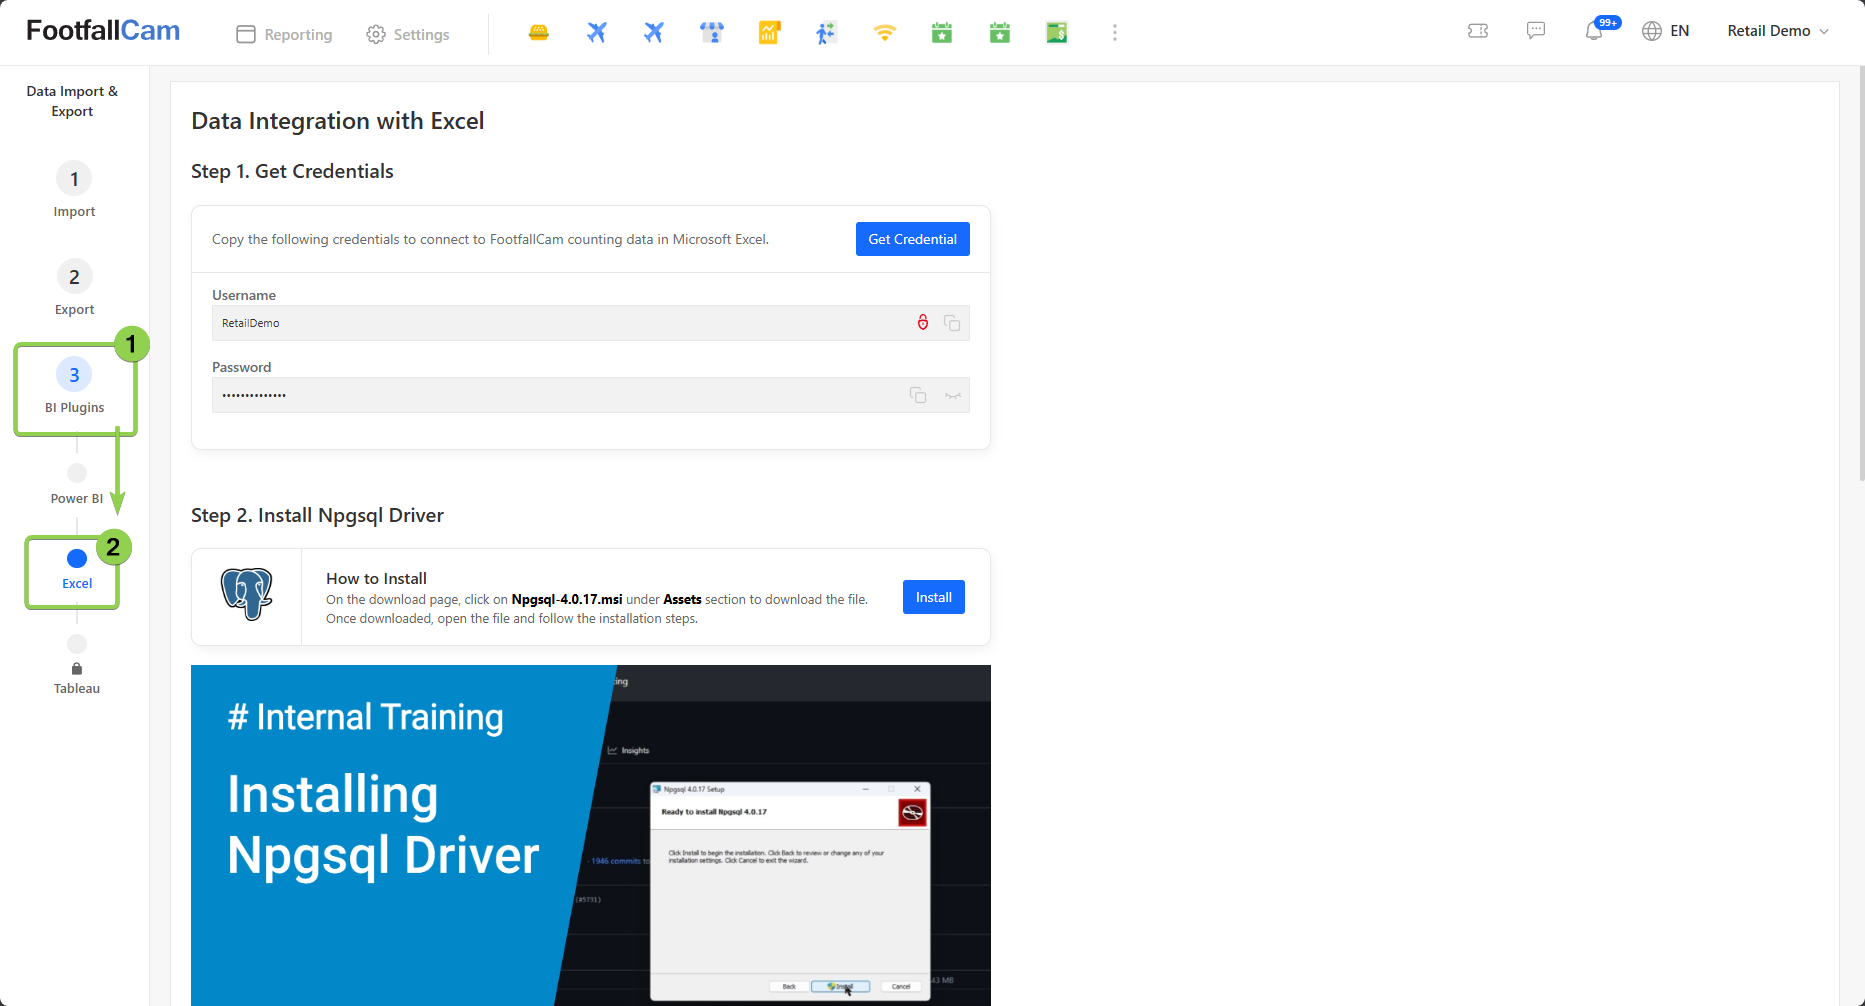
Step 3 - Observe the Username and Password fields. If no credentials have been generated yet, click the "Get Credential" button to get the username and password.
Step 4 - Click the "copy" icon to copy your credentials to the clipboard.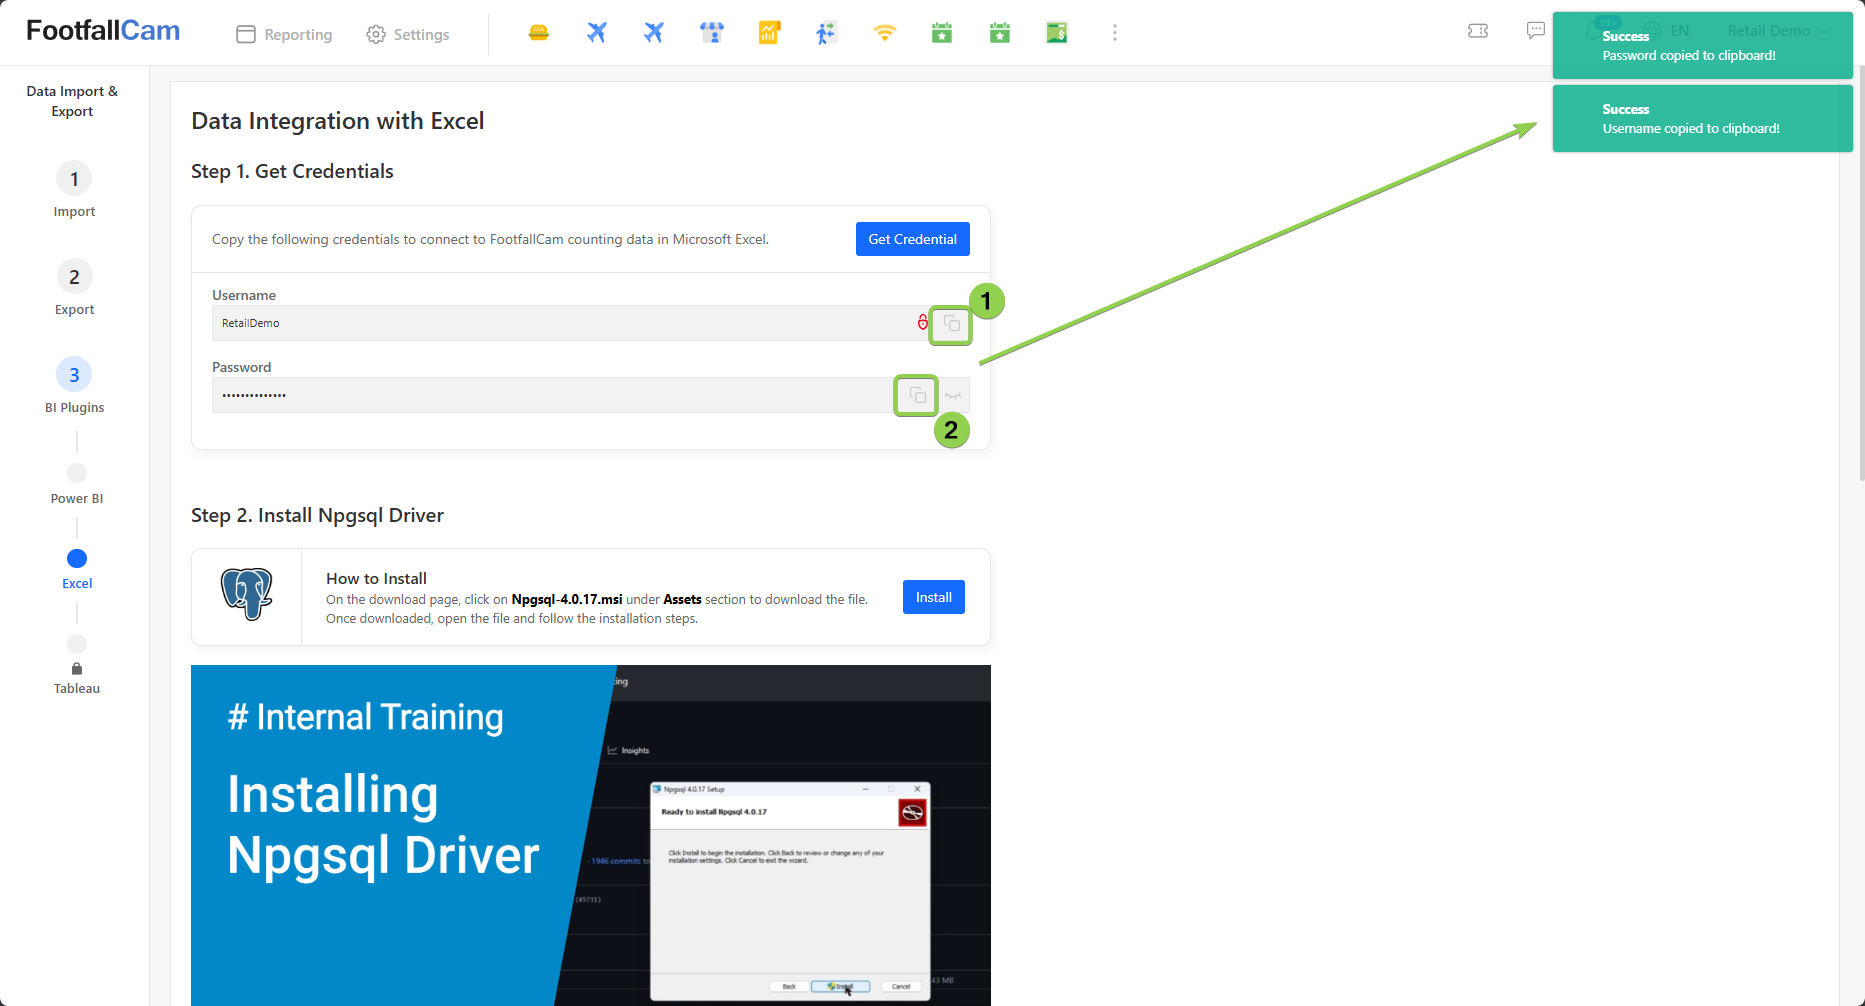
Step 5 - To connect to the database, you need the Npgsql driver. If you haven't installed it yet, simply click the "Install" button. This will redirect you to the related website where you can download the driver. Follow the provided video tutorial for a step-by-step installation guide.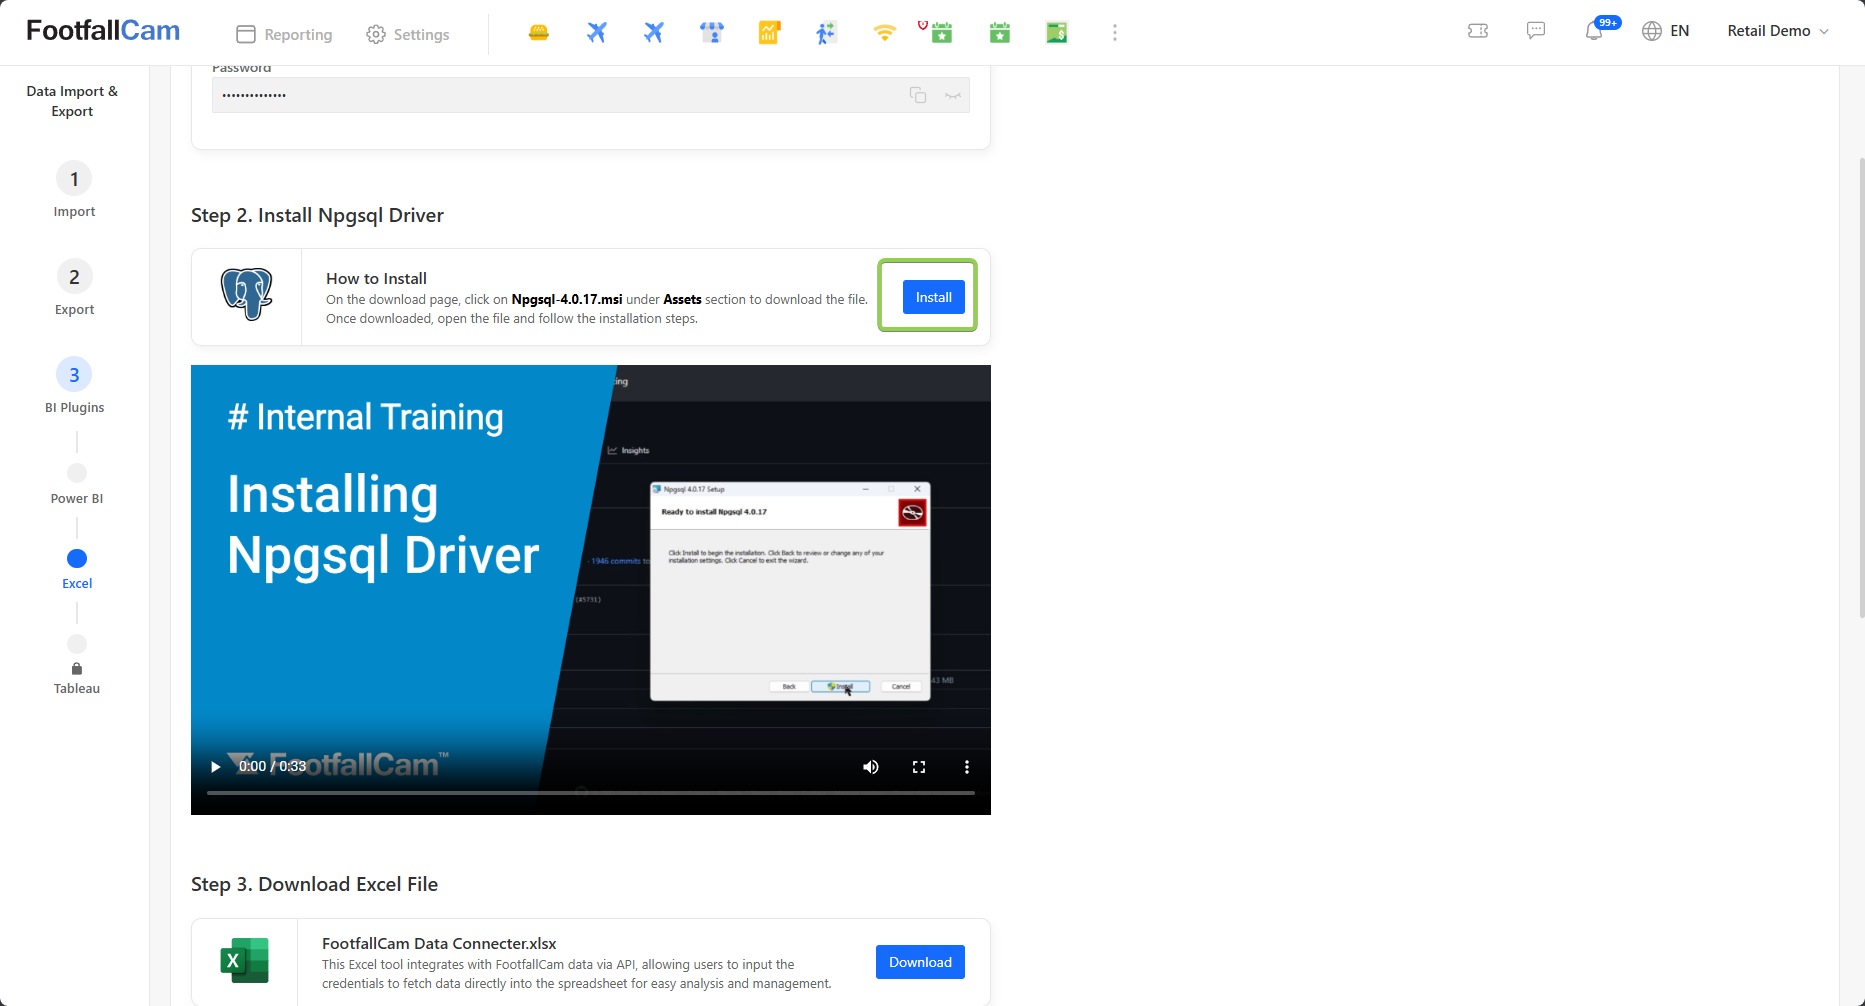
Please refer to the video for instructions on installing the Npgsql Driver (If needed):
Step 6 - Download the Excel file that has been preset with a connection to the FootfallCam V9™ database.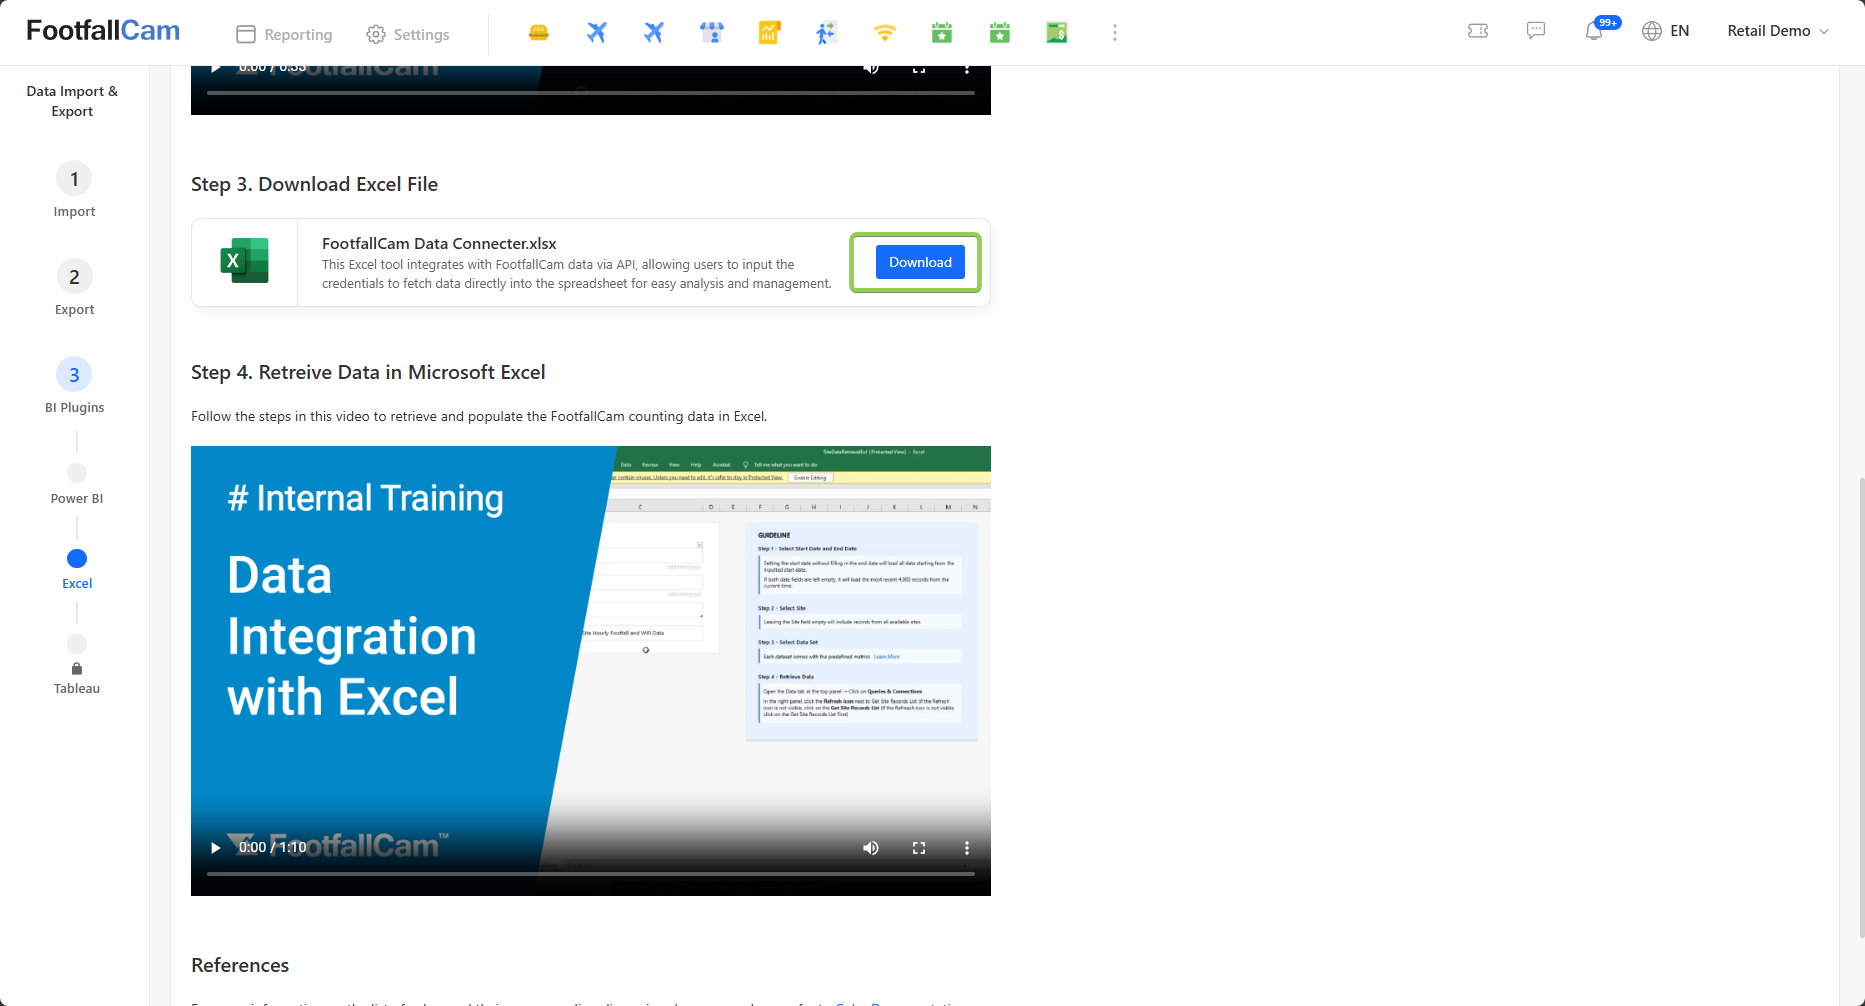
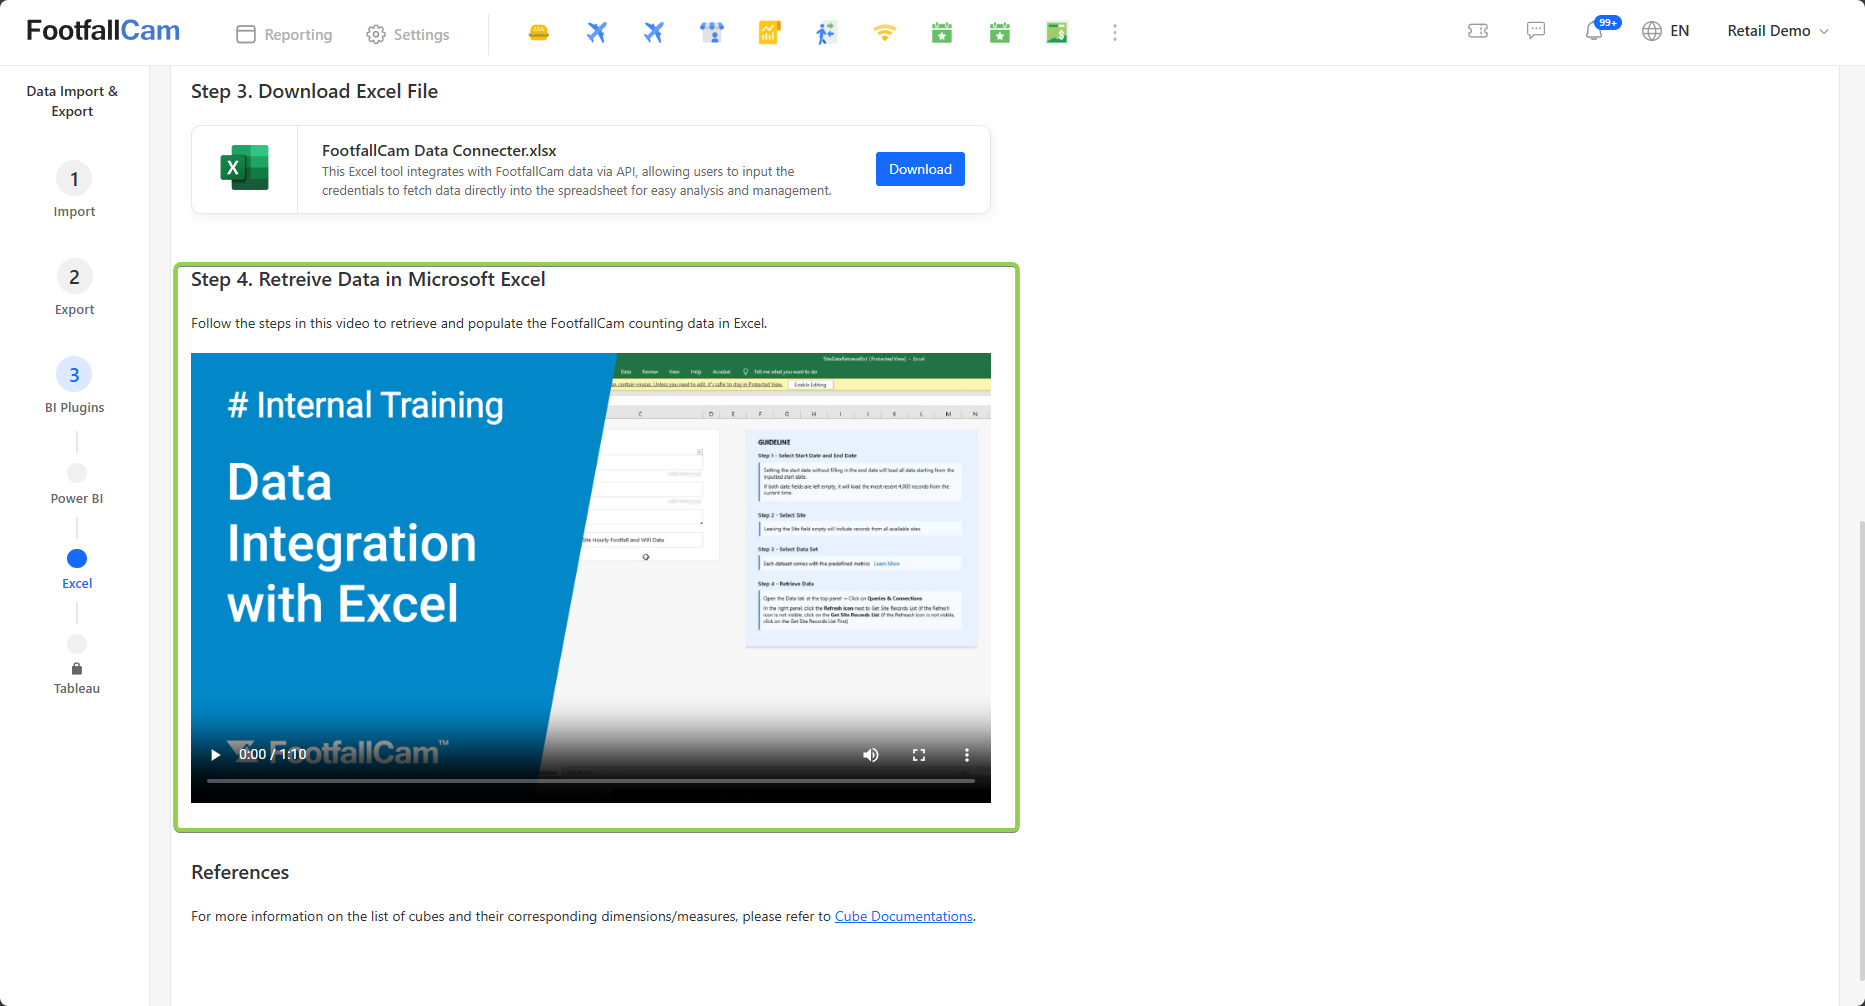
Step 7 - Please follow the instructional video to activate the connection to the database (cube.footfallcam.com:6432). When prompted, enter the credentials obtained from Step 4. After retrieving the data, you can use Excel's charts, graphs, and other visualization tools to analyze and present your data effectively.
2.3.2.1 Edit SQL Queries
This Excel file only provides the basic data, specifically the "Site Daily" data. If you need additional data, such as hourly data or device-level data (which are sourced from different cube tables), please follow the steps below to make the necessary edits. For details of the available cube tables, kindly refer to the Cube Documentation. Currently, the Excel retrieves daily data from the ffc_site_summary table.
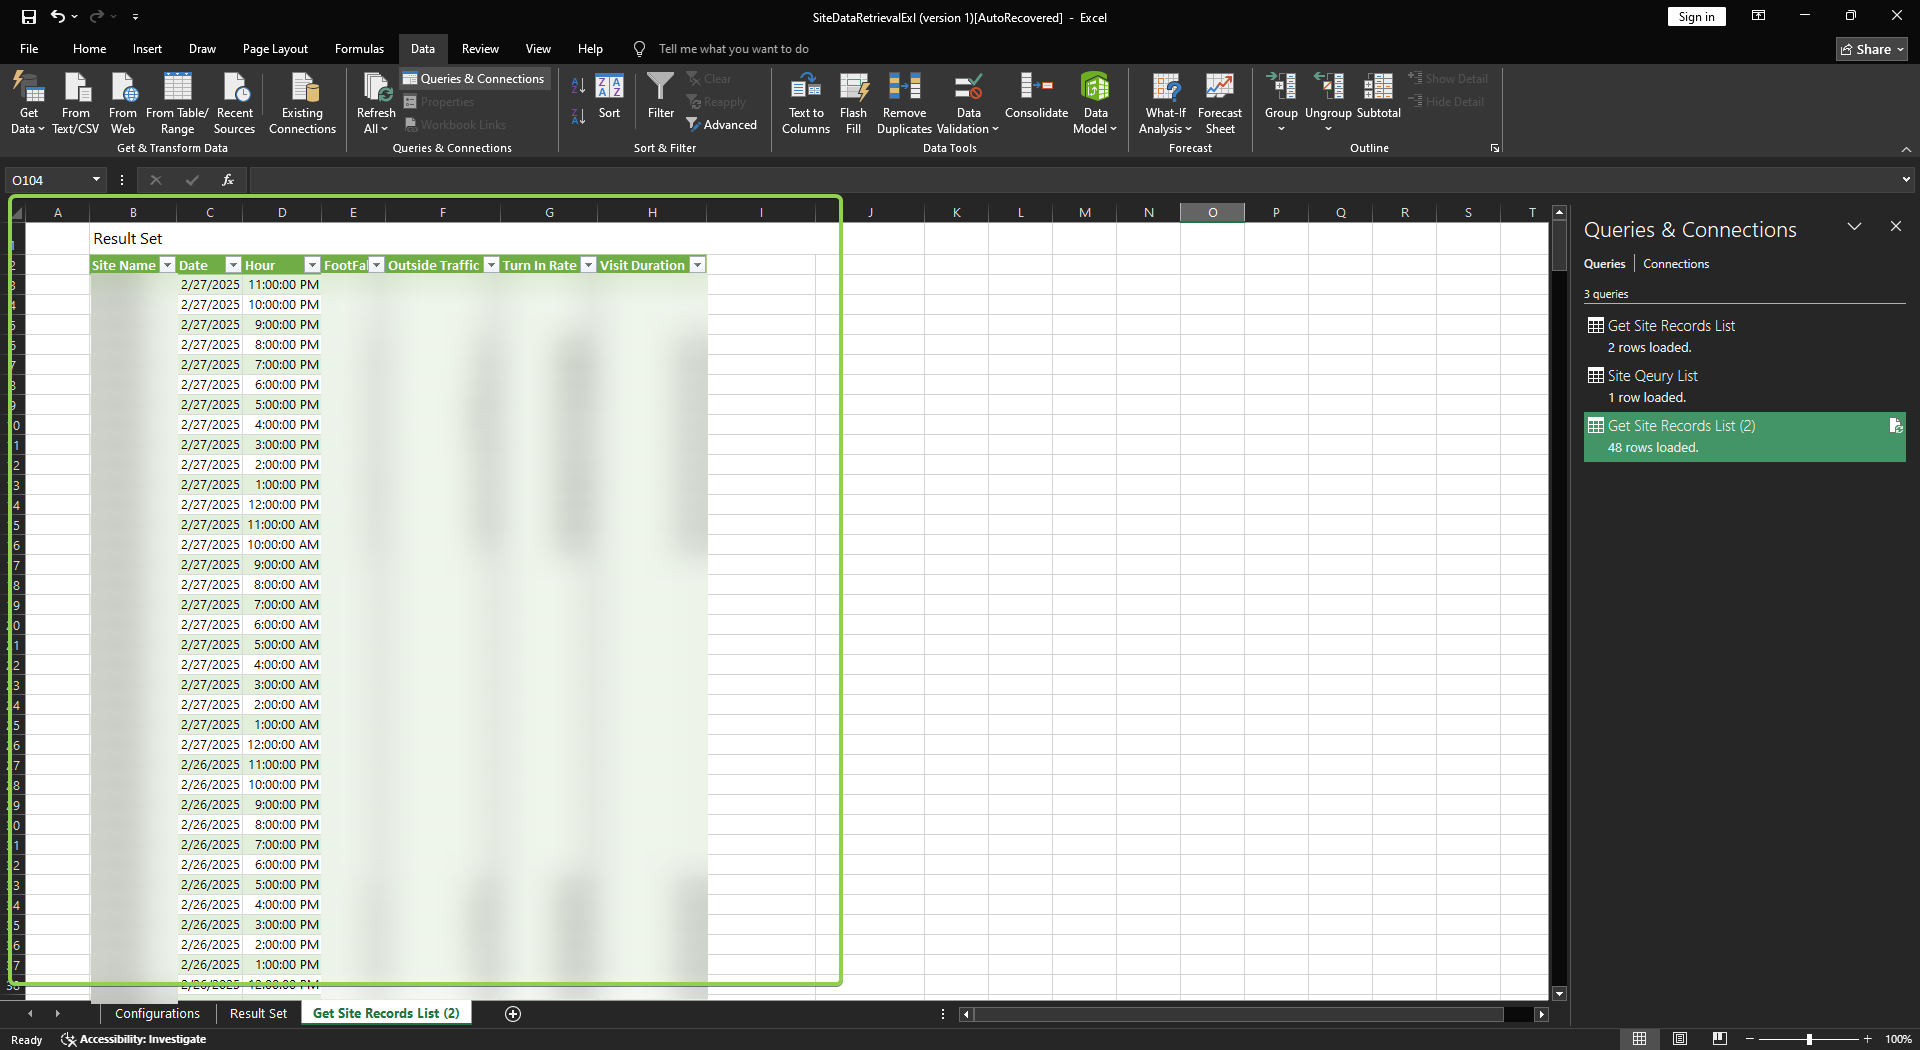
Step 1 - Go to Data > Queries & Connections, open the query bar on the right-hand side.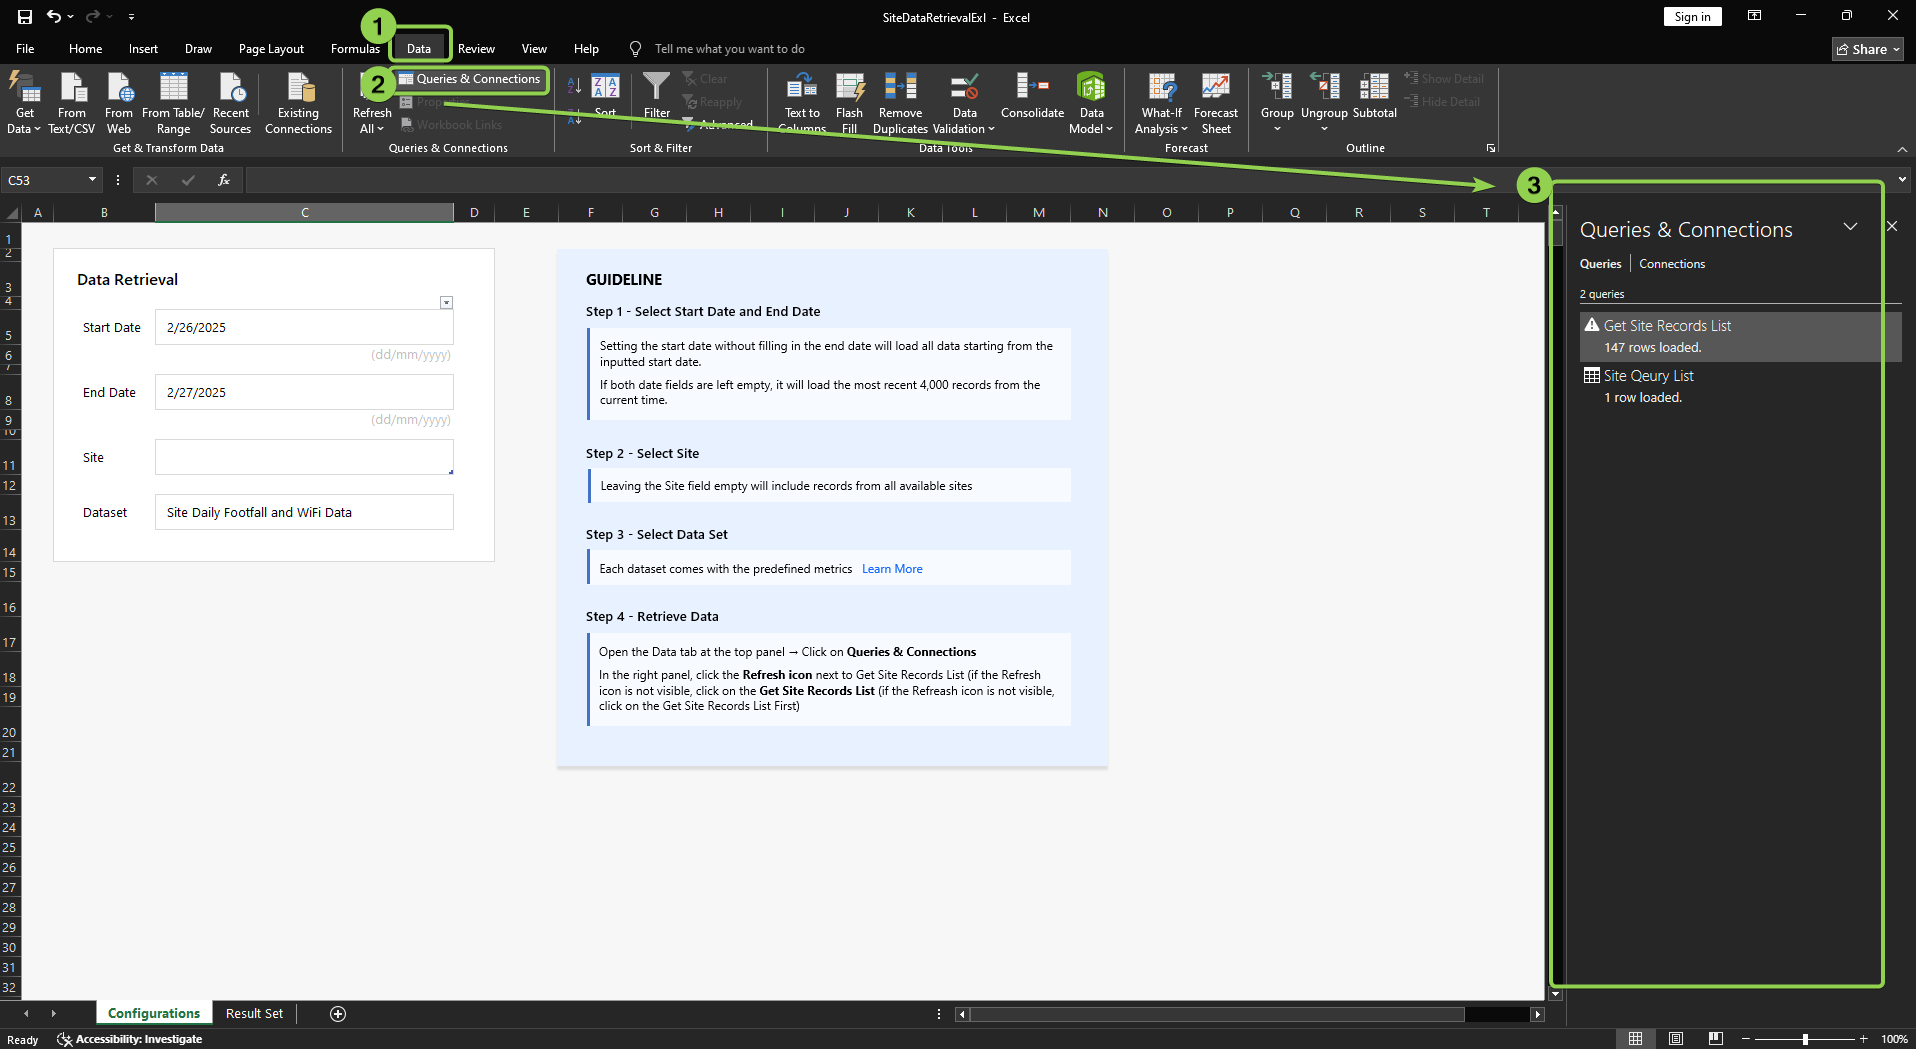
Step 2 - Double-click on one of the queries in the Queries & Connections to open the related window.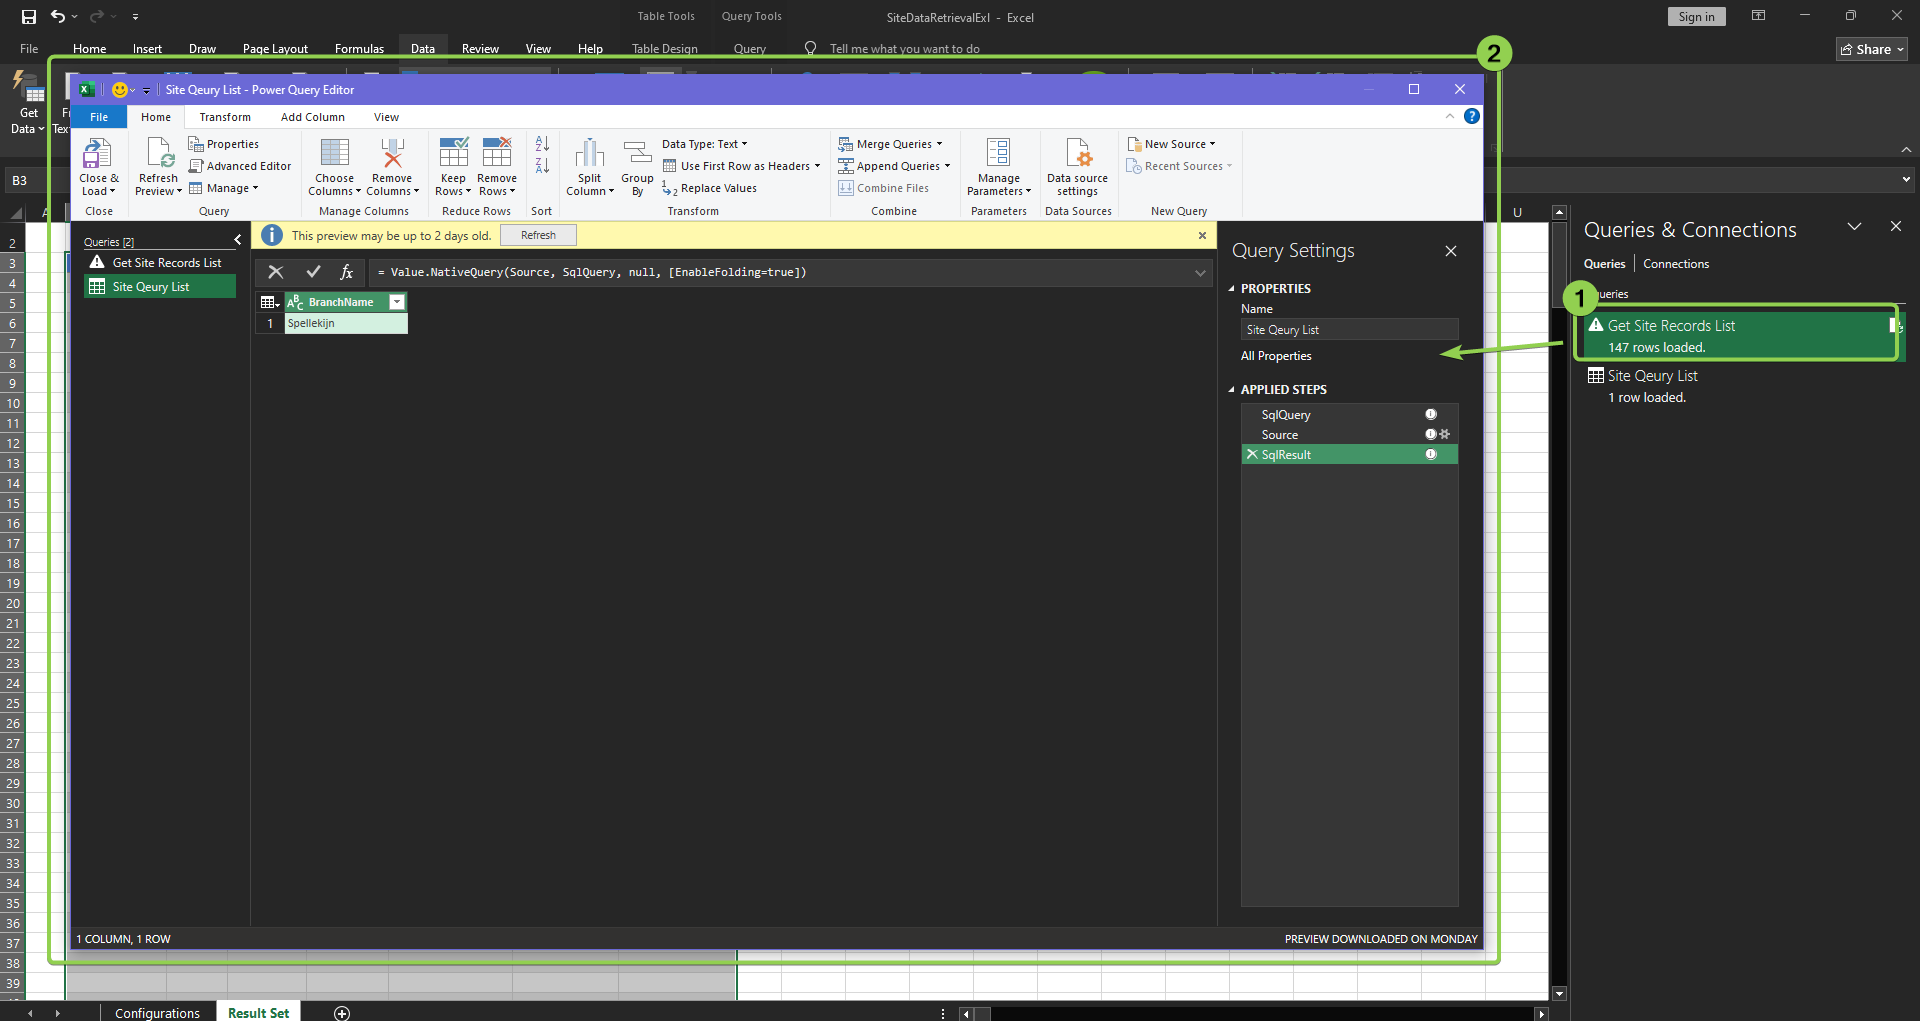
Step 3 - Right-click on the "Get Site Records List" and select Duplicate to duplicate a query.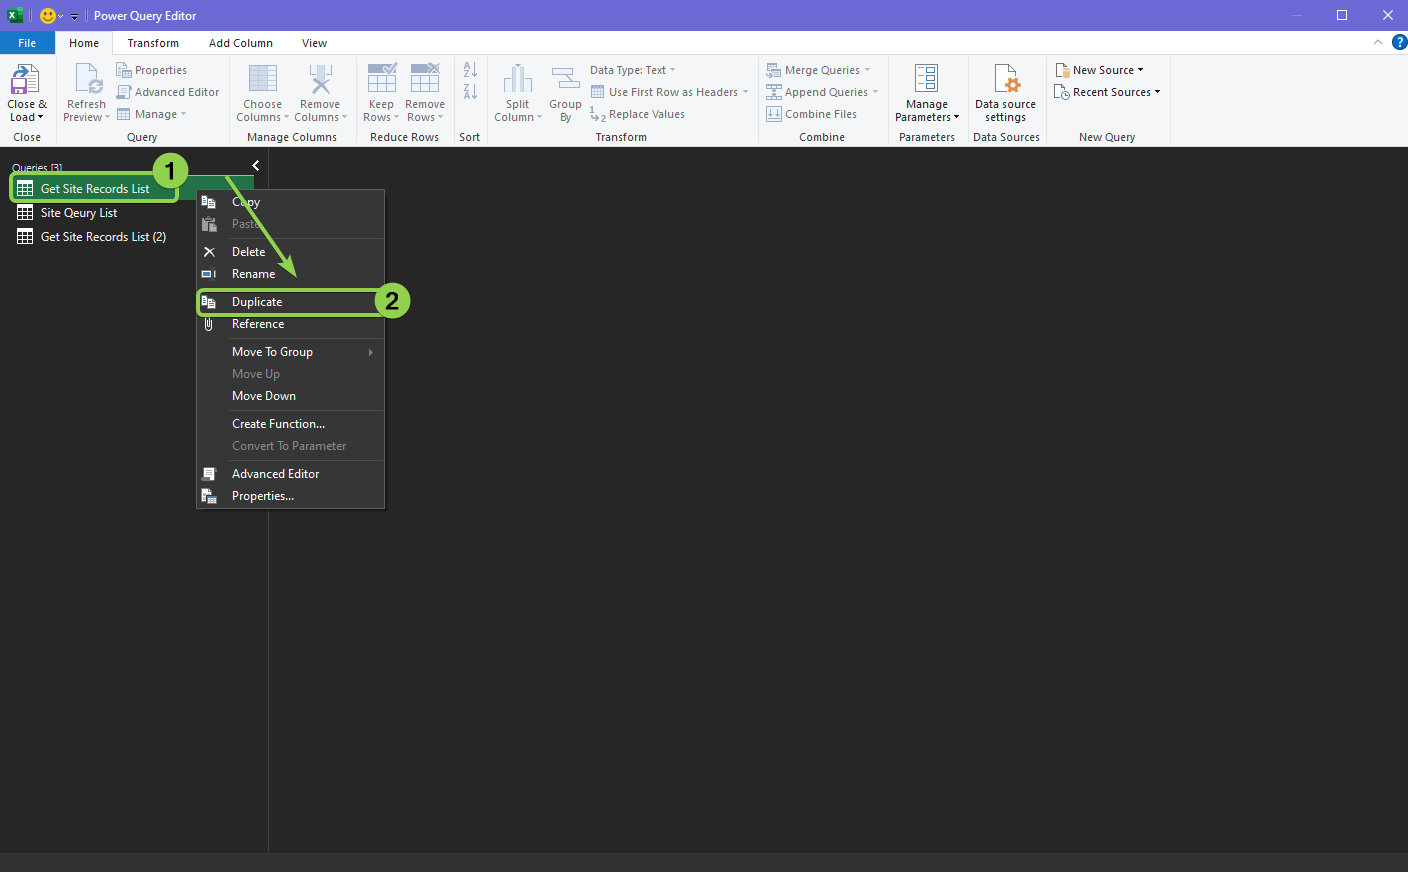
Step 4 - Select the expected query and select the SqlQueryBase under Applied Steps. Then, edit the SQL query. 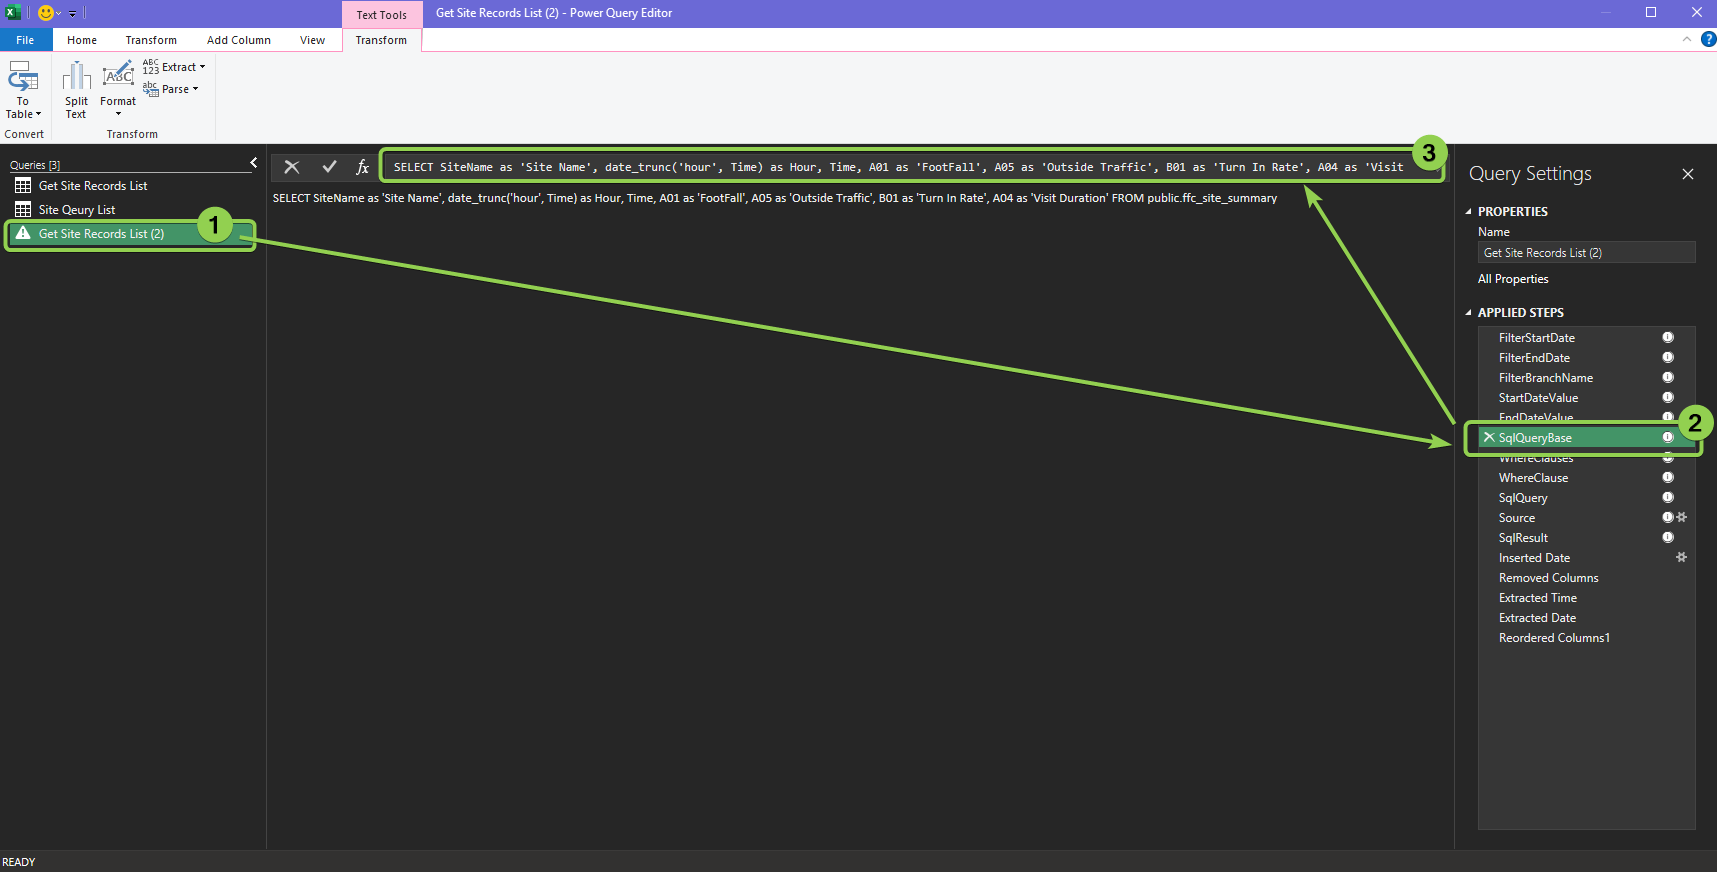
Please add the following line to the SQL Query if you would like to get the hourly data: date_trunc('hour', Time) as Hour,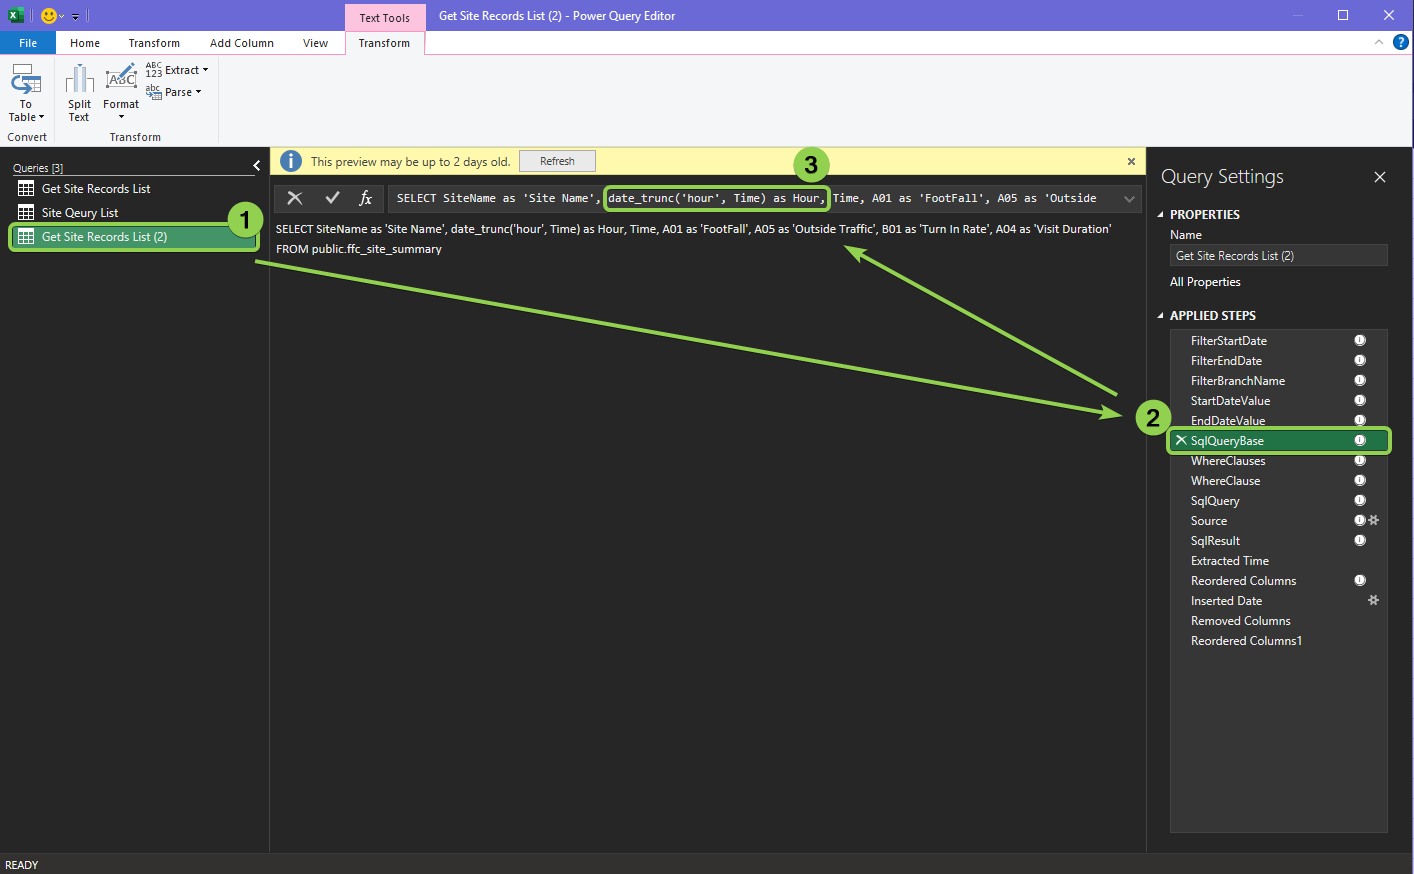
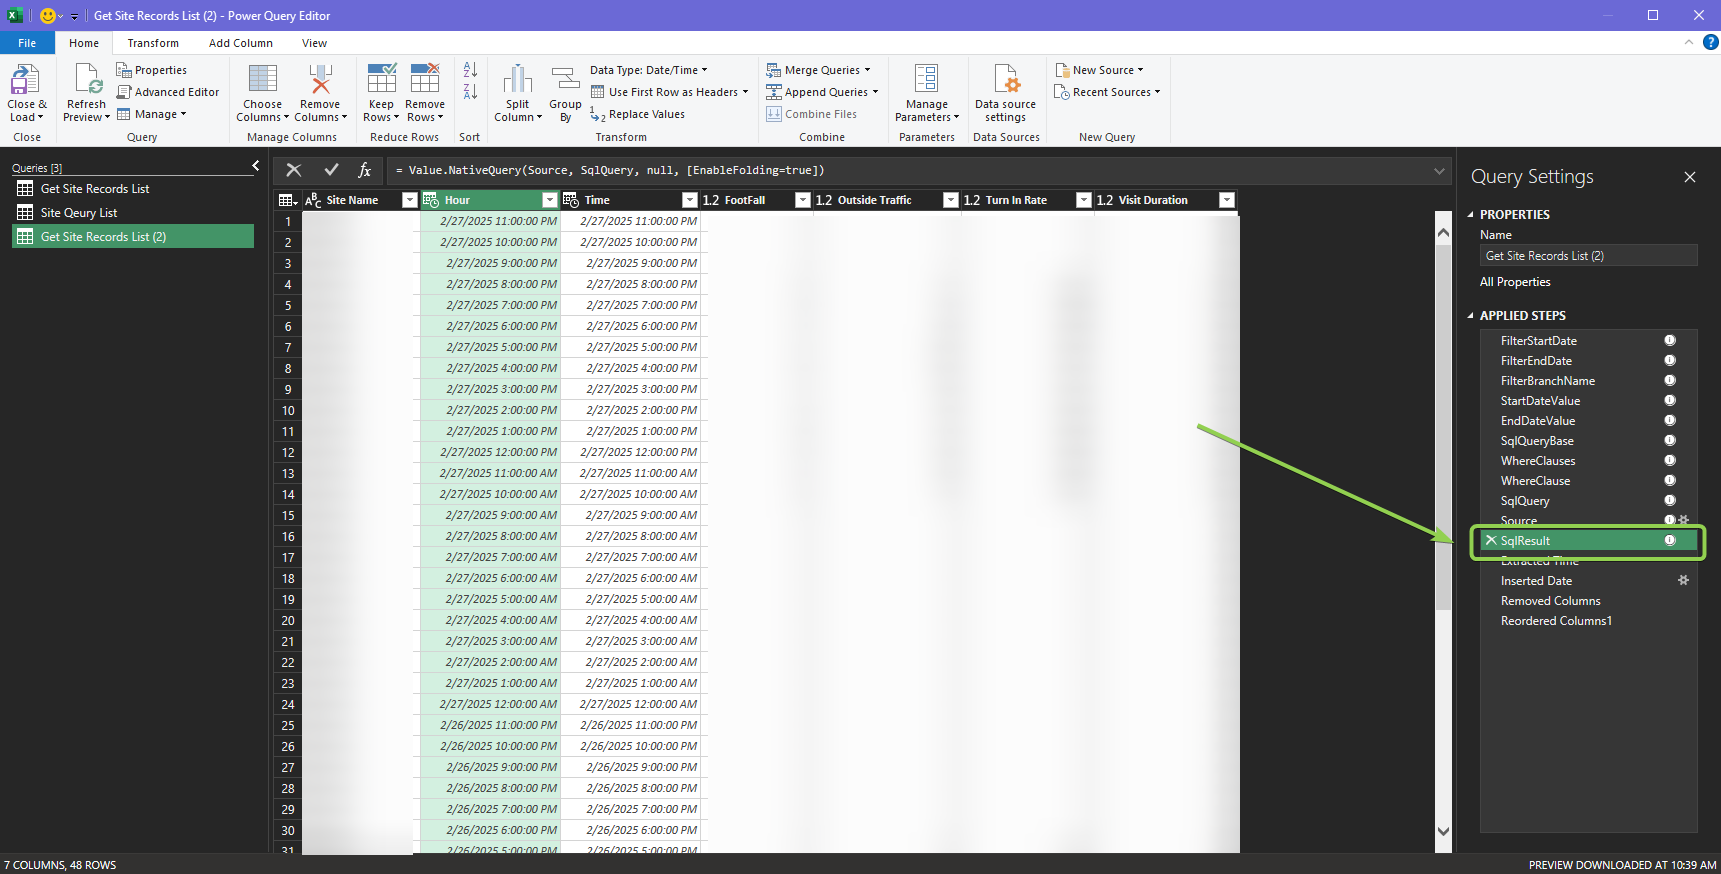
Step 5 - Select the SqlResult to view the result data obtained from the query
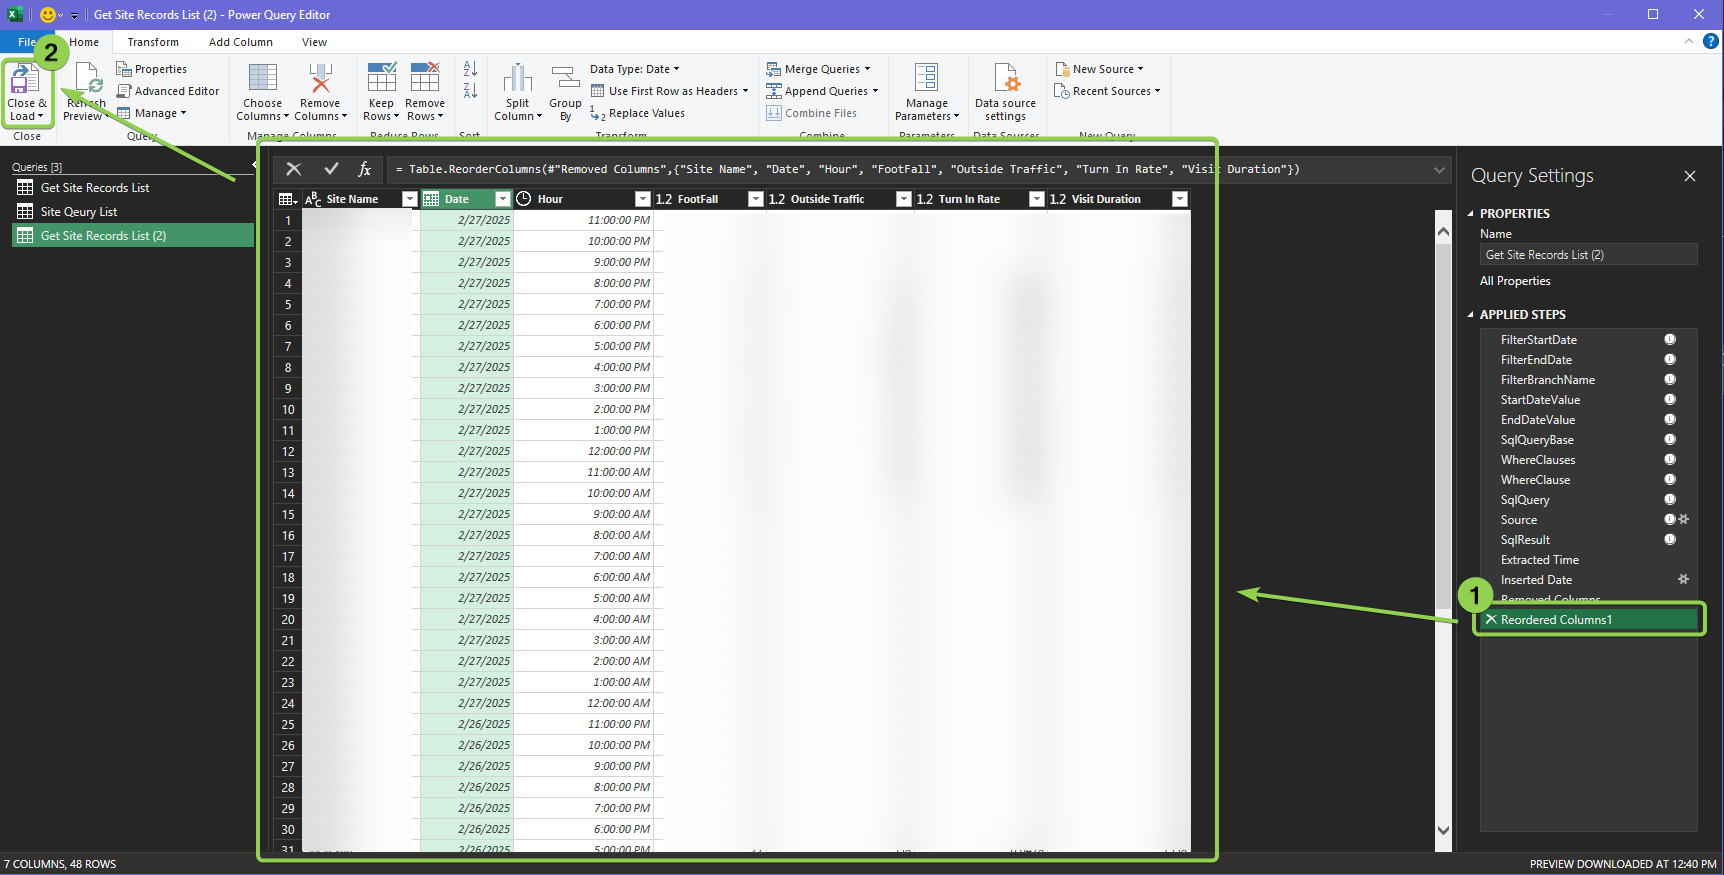
Step 6 - Click on the last step to view the final result and go to Home > click on the Close & Load to save the changes and load the data to Excel.
Step 7 - It will auto-create a new sheet to show the data. Please rename the sheet name if needed
2.3.2.2 Format Column
Format the HOUR column
Step 1 - Select the expected column. Go to Transform > Time > Select Time Only.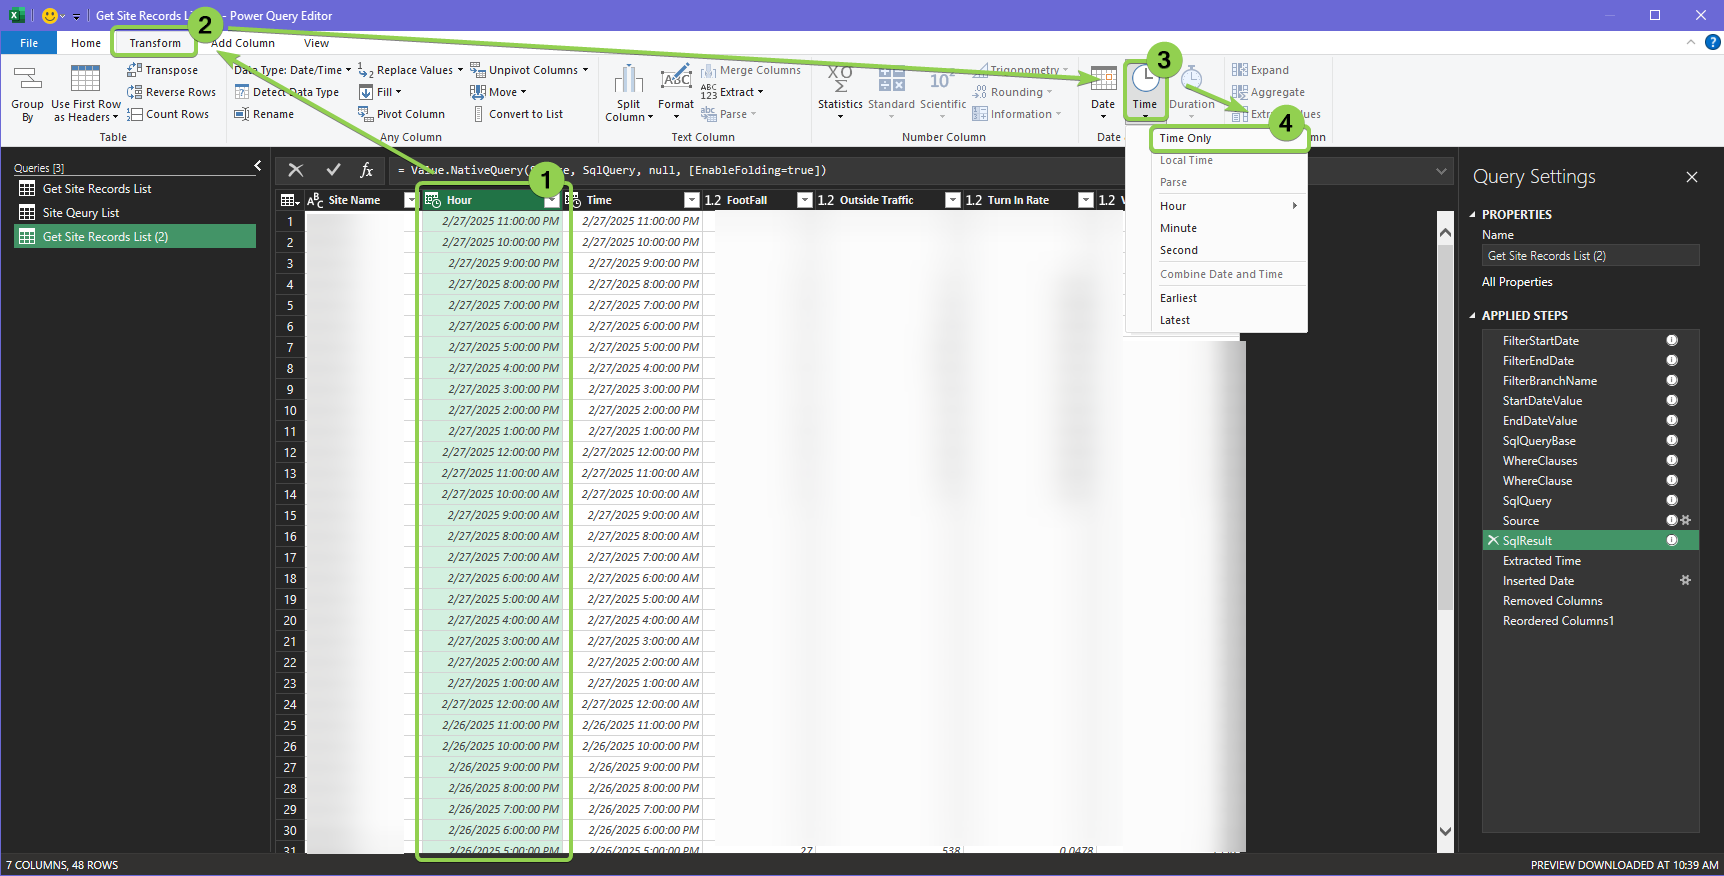
Step 2 - After done, the Applied Steps will add a step named "Extracted Time", where the expected column will only display the time.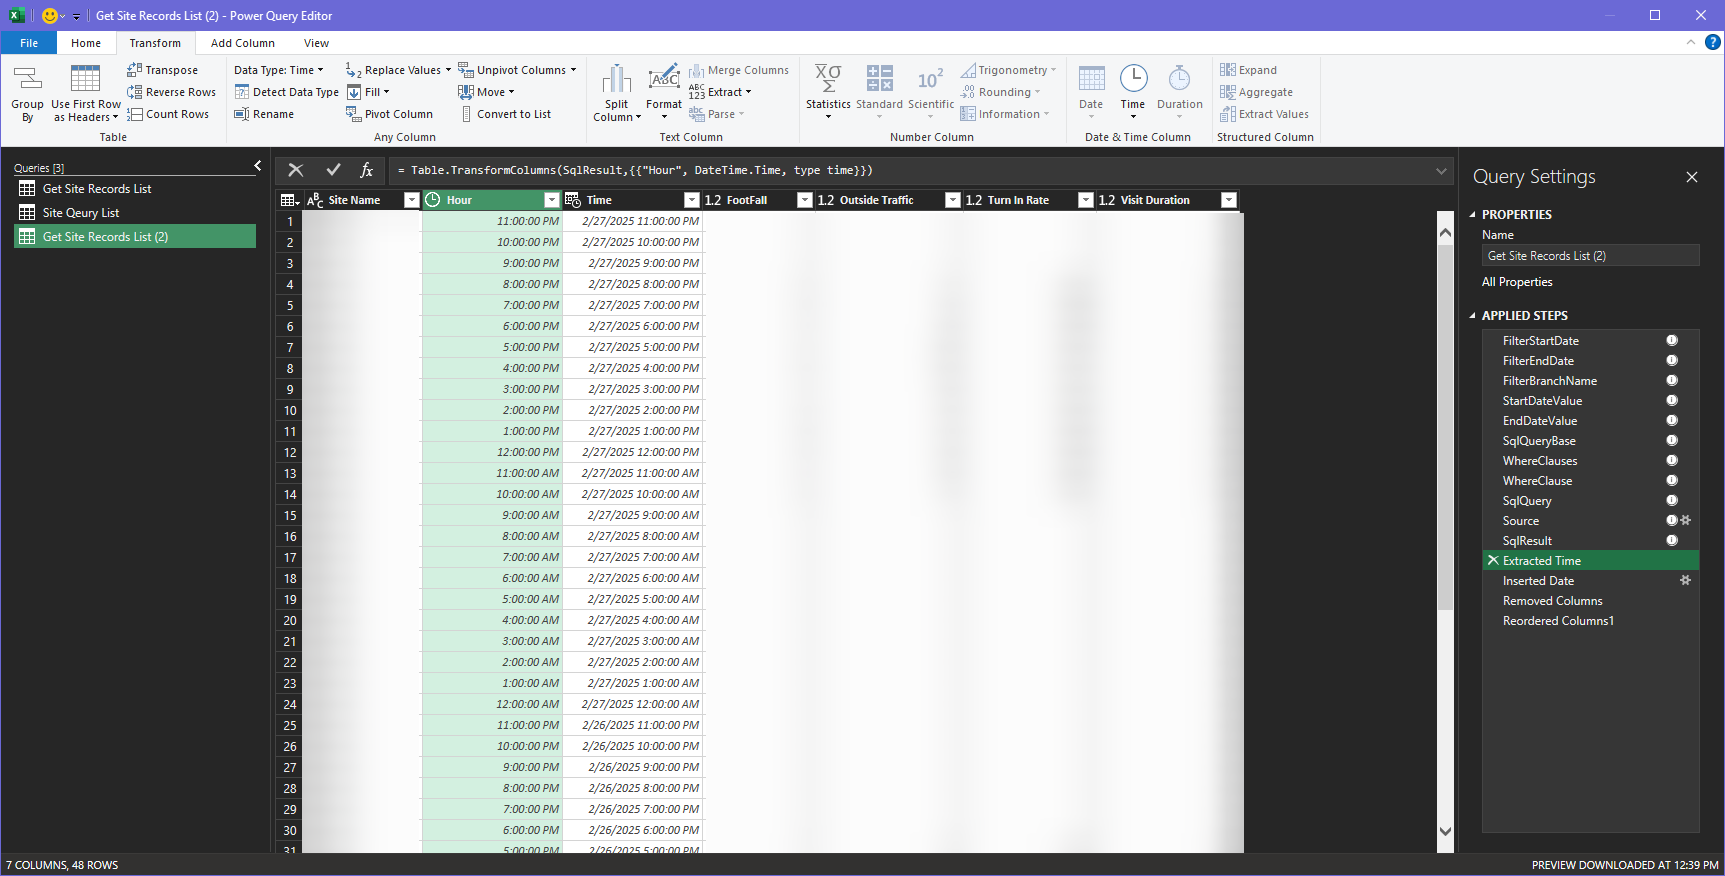
Format the DATE column
Step 1 - Select the expected column. Go to Transform > Date > Select Date Only.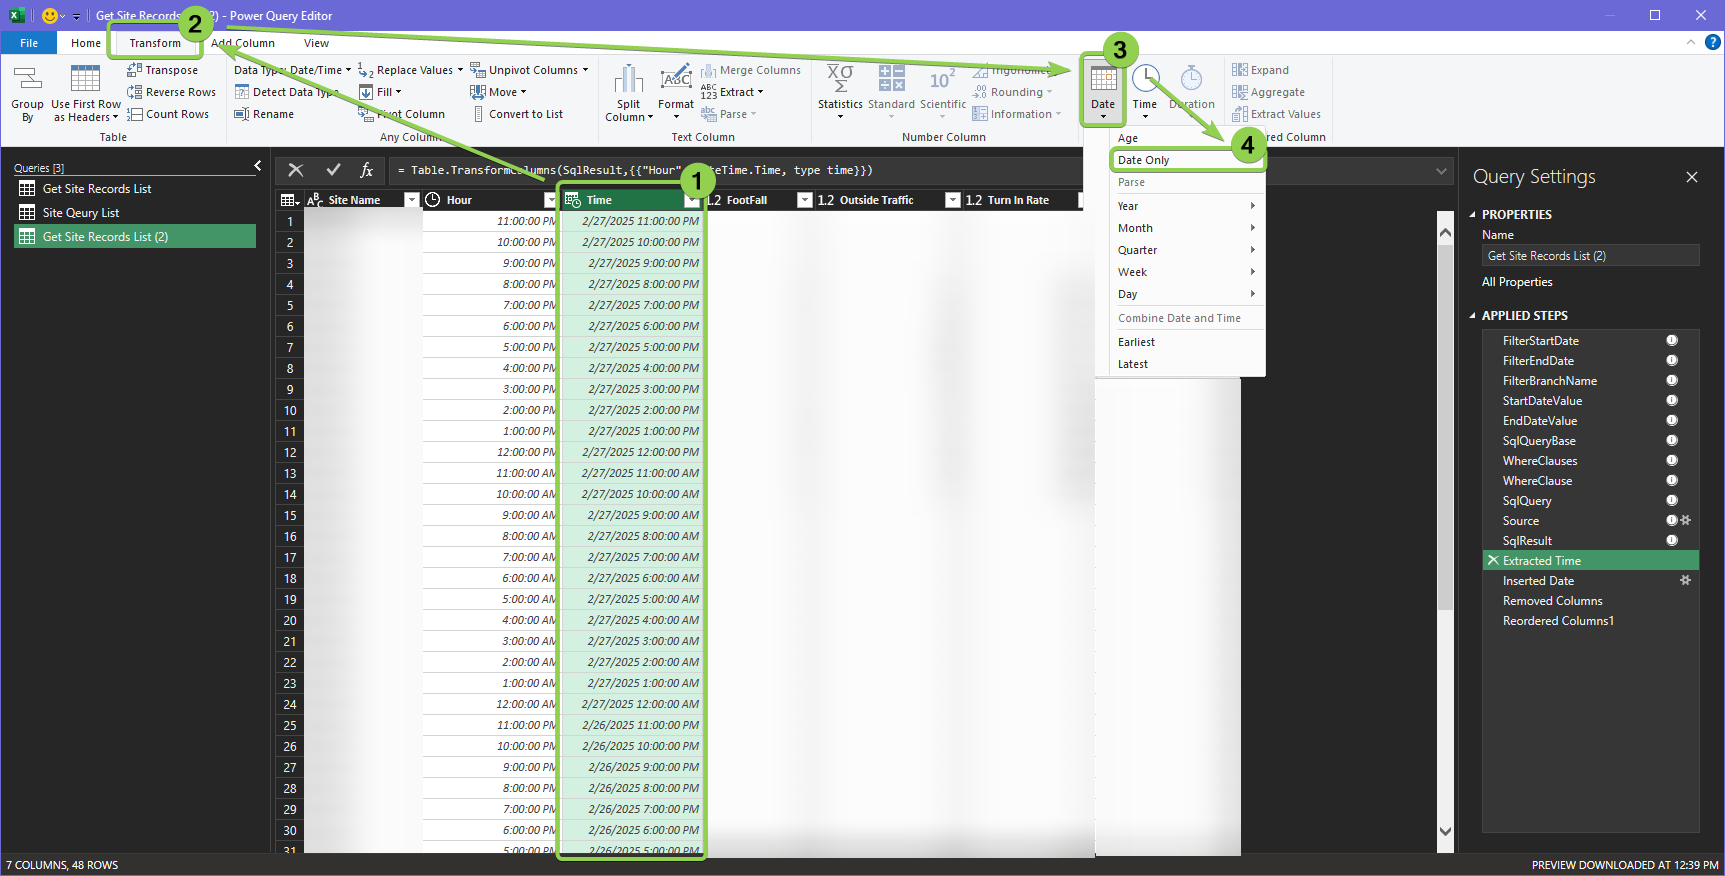
Step 2 - After done, the Applied Steps will add a step named "Extracted Date", where the expected column will only display the date.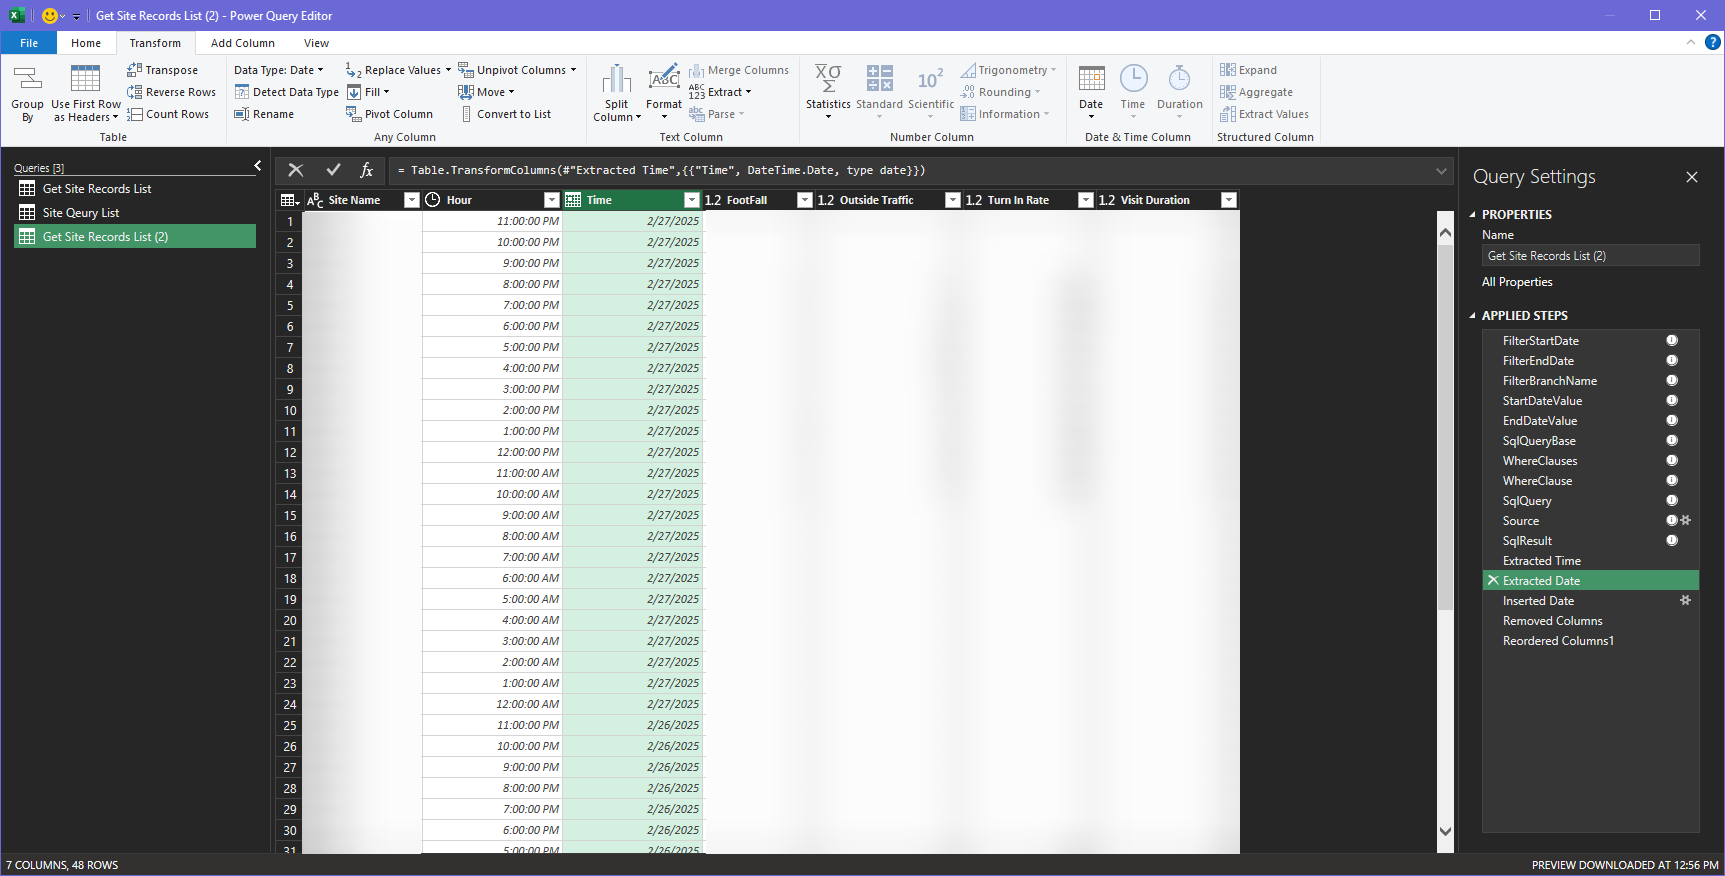
Add a new column
Go to the Add column tab to add the column. The example here shows how to add a new date column.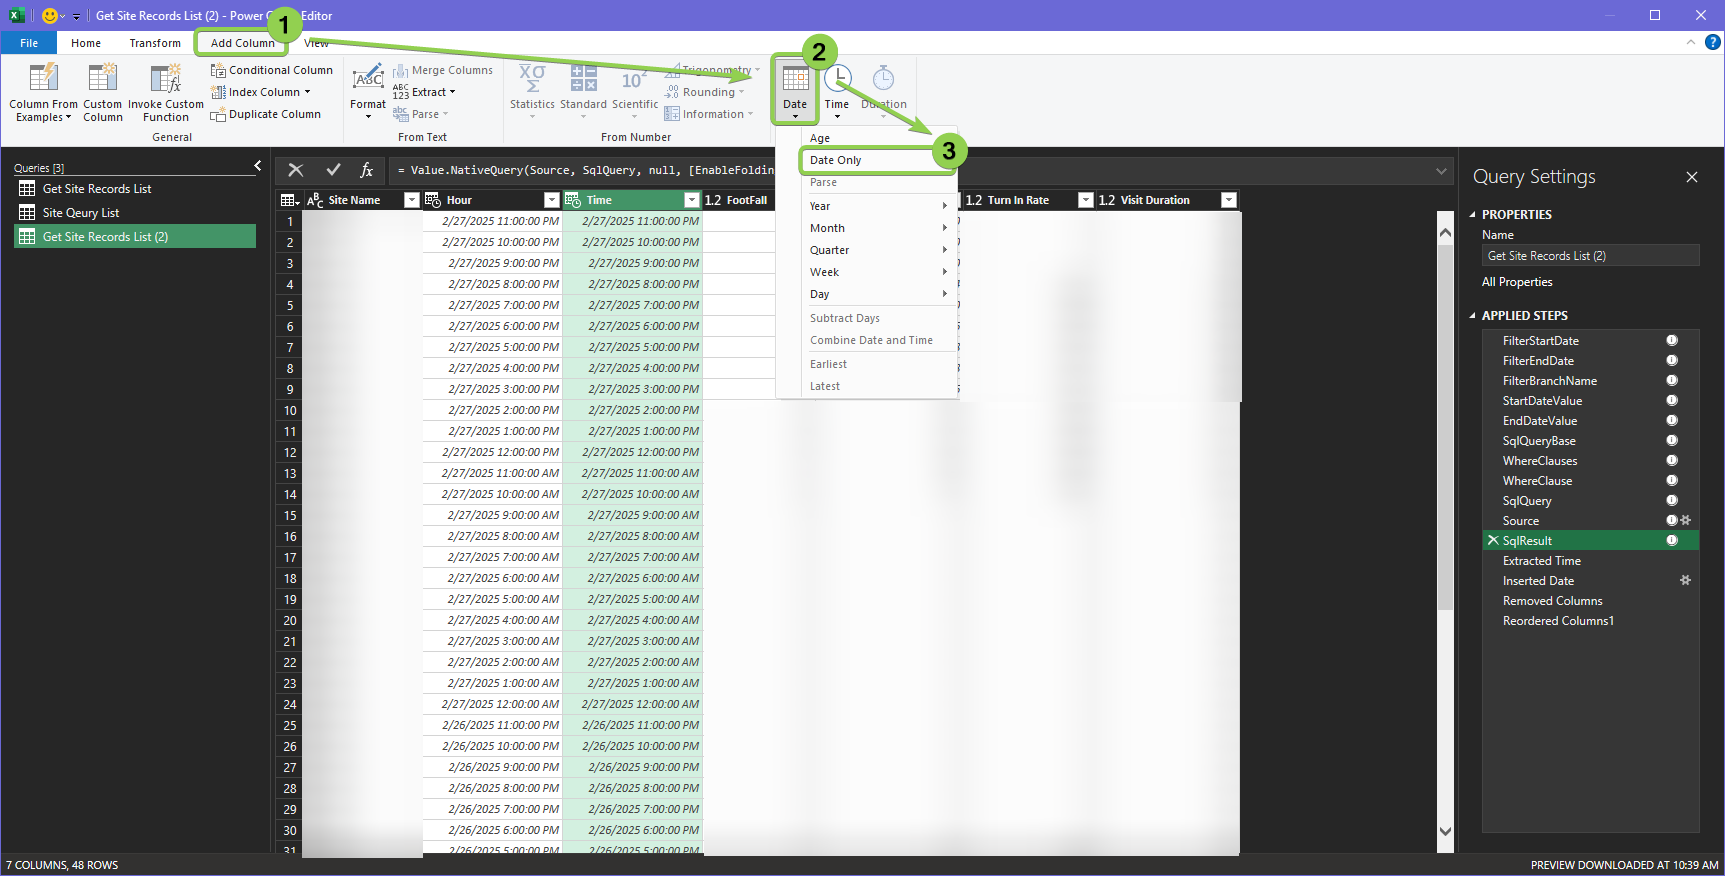
After adding the column, the Applied Step will show a new step named "Inserted XXXX"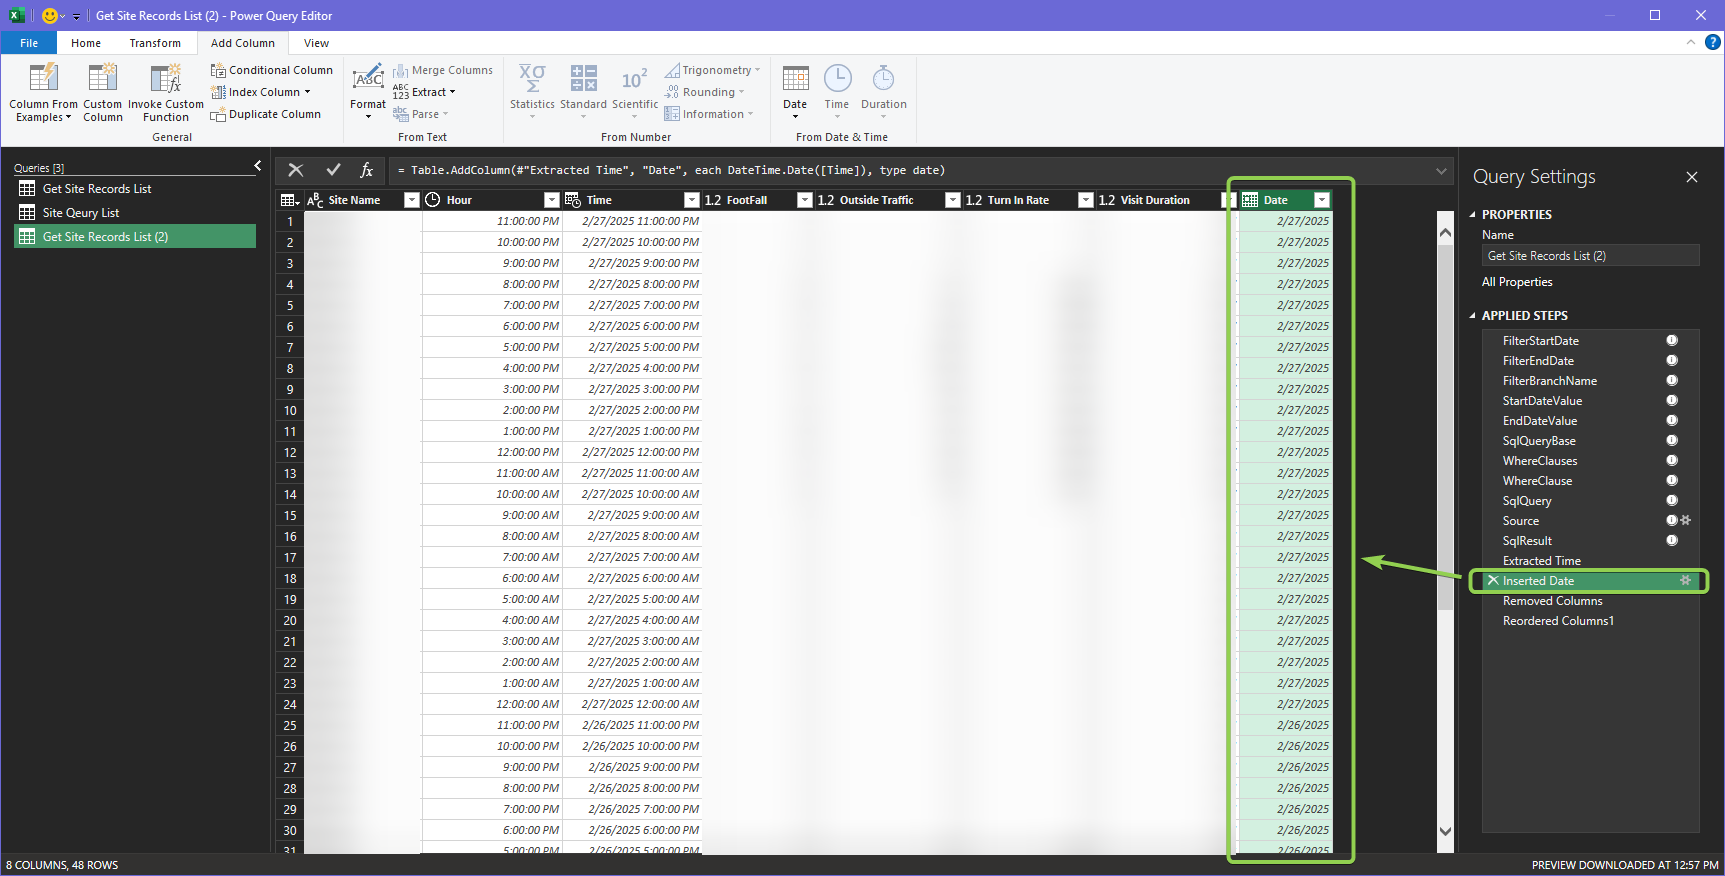
Remove an existing column
After adding or modifying the column, you can go to Home > Remove Columns to delete the selected column.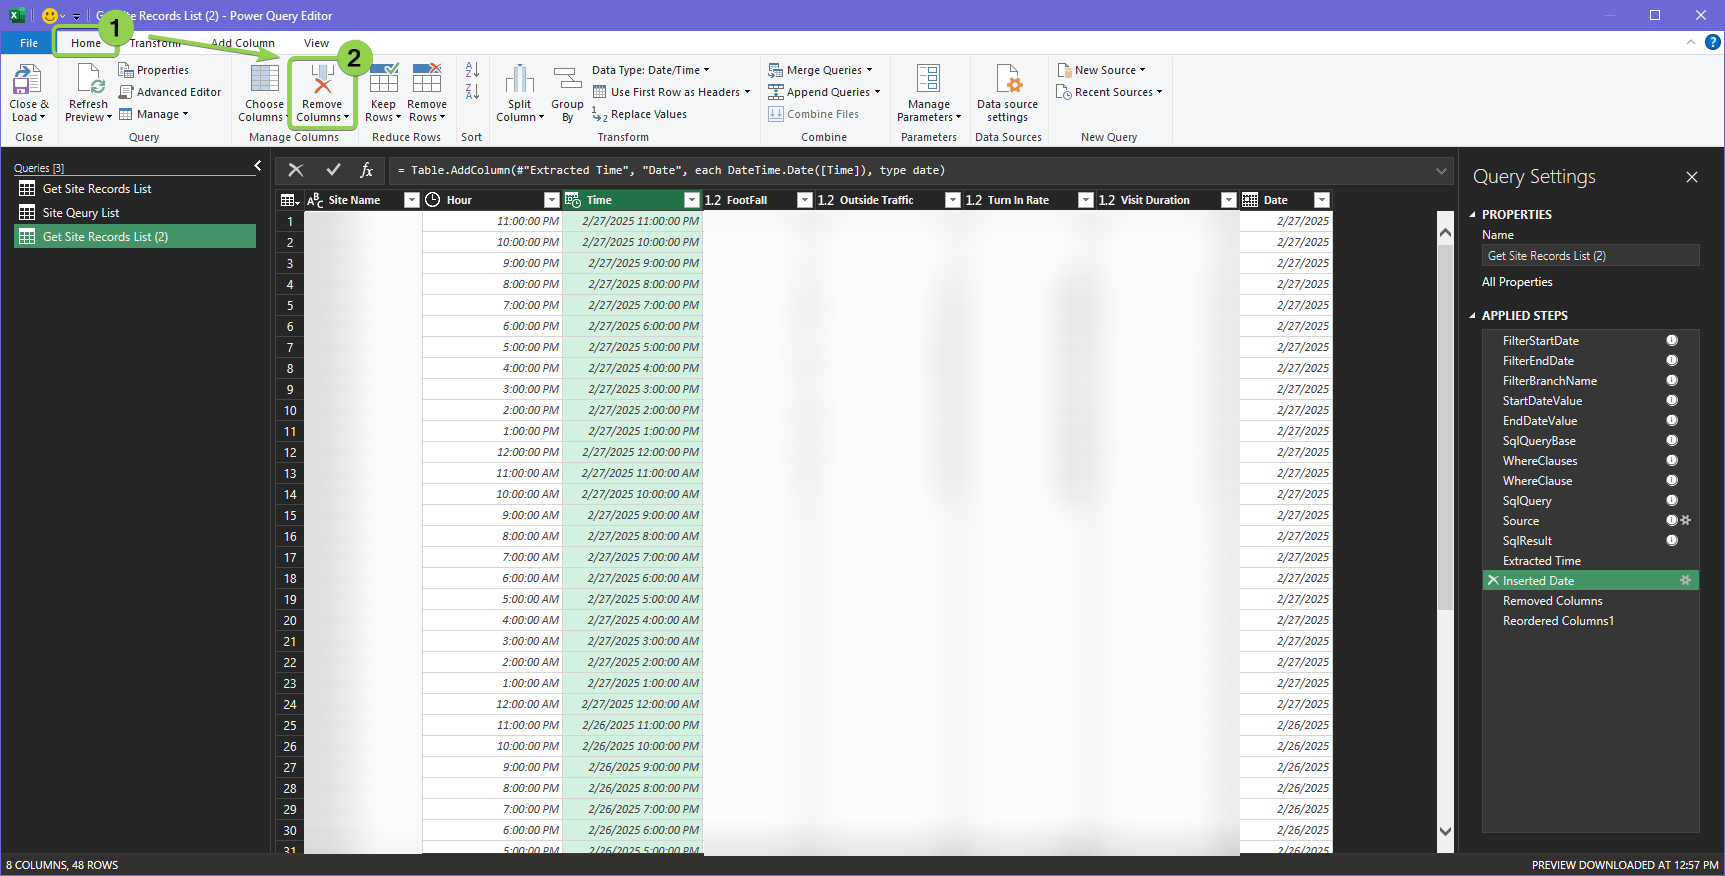
2.3.3 Tableau
Section Coming Soon...