


1.1 Heat Map
1.1.1 Overview
A heat map is a data visualization technique that shows magnitude of a phenomenon as color in two dimensions. The variation in color may be by hue or intensity, giving obvious visual cues to the reader about how the phenomenon is clustered or varies over space. In this case, the foot traffic and dwell time data is represented in the form of a floor plan in which data values are represented as colours. The Heat Map feature is to provide Zone Analytics to identify Hotspot Zone in a premise.
1.1.2 Function
-
Intelligently Track the Number of People Engaged in a Specific Area of Interest
-
Specific Area of Interest can be use for Strategizing Marketing Campaign, Promotional Events and Ads Placement.
-
Understand the Average Visitor's Behavior and Shopping Journey
-
Track Customer Journey through the Outlet / Mall
1.1.3 How does it work?
1.1.3.1 Heatmap Counting
The Heatmap Counting is primarily taking Timestamp and Dwell Time into account.
| Item | Description |
| Timestamp | Timestamp indicates the date and time when the event occurred. |
| Dwell Time | Dwell indicates the duration for an individual enters and stays within tracking zone for more than 1 second (Default Configurable Threshold). |
The longer the dwell time, the more intensity the colours are on the Heatmap.
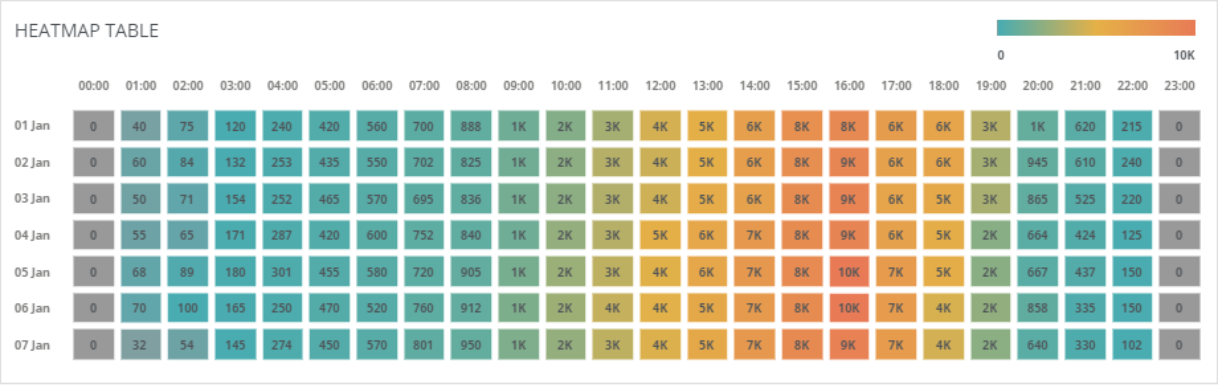
1.1.3.2 Heatmap Table
The Heatmap Table is used to visualize hot spots within data sets, and to show patterns or correlations. The intensity of the colour increases from 0 to 10K. Please refer to the image below for the table:
1.1.3.3 Heatzone
The heat zone will be configured to two coordinates, the x geometry axis and the y geometry axis on the floorplan of the premise. The geometry data will be scaled for the live view for the feature to work.
1.1.3.4 Heat Map Duration
The heat map has two different type of report:
HOURLY - Data aggregated and updated to the dashboard hourly
DAILY - Data aggregated and updated to the dashboard daily
1.2 Heatmap Analytical Report
1.2.1 Customer To-Do
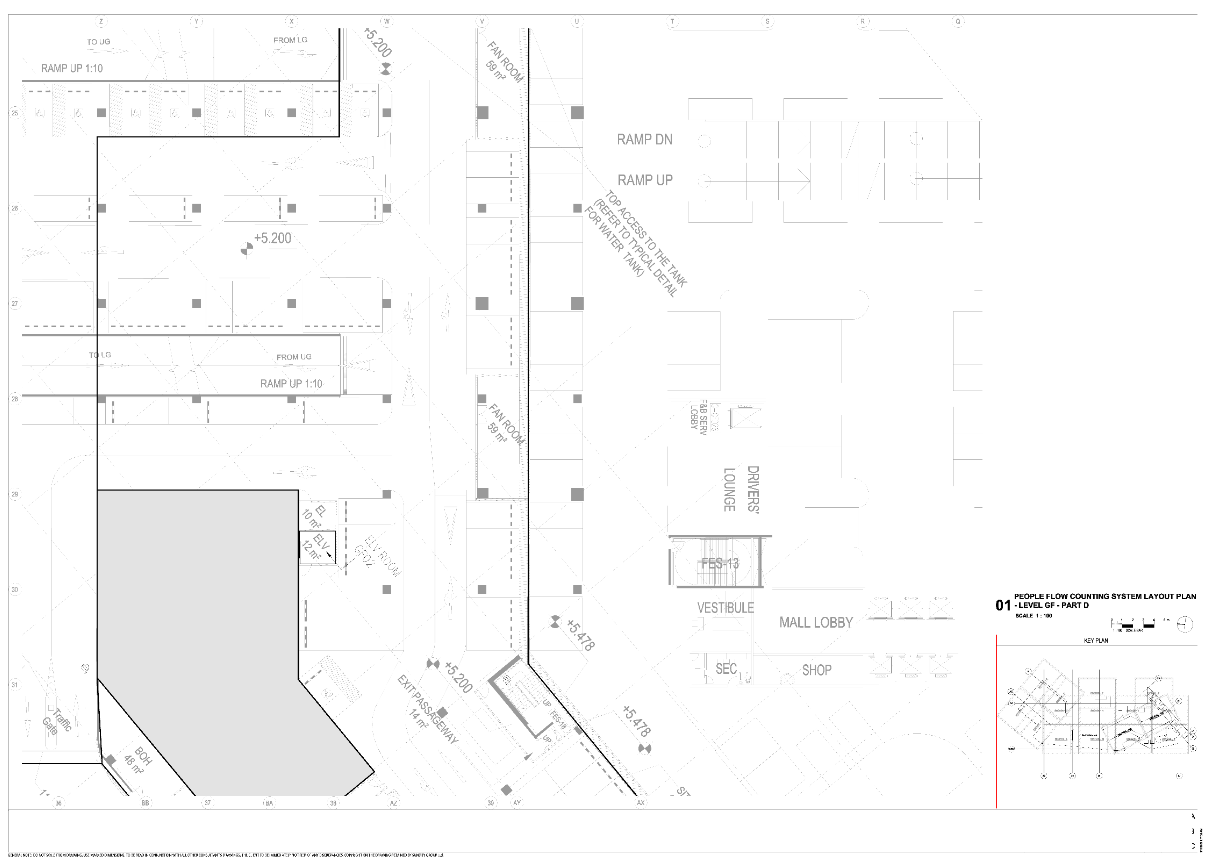
In order to configure the heat map feature, customer have to send us the following documents:
-
Floor Plan with Dimension (Raw / Plain)
-
Floor Plan with Dimension Showing the Location of the Counter with Counter Name or Serial (Plotting or Sketching will do)
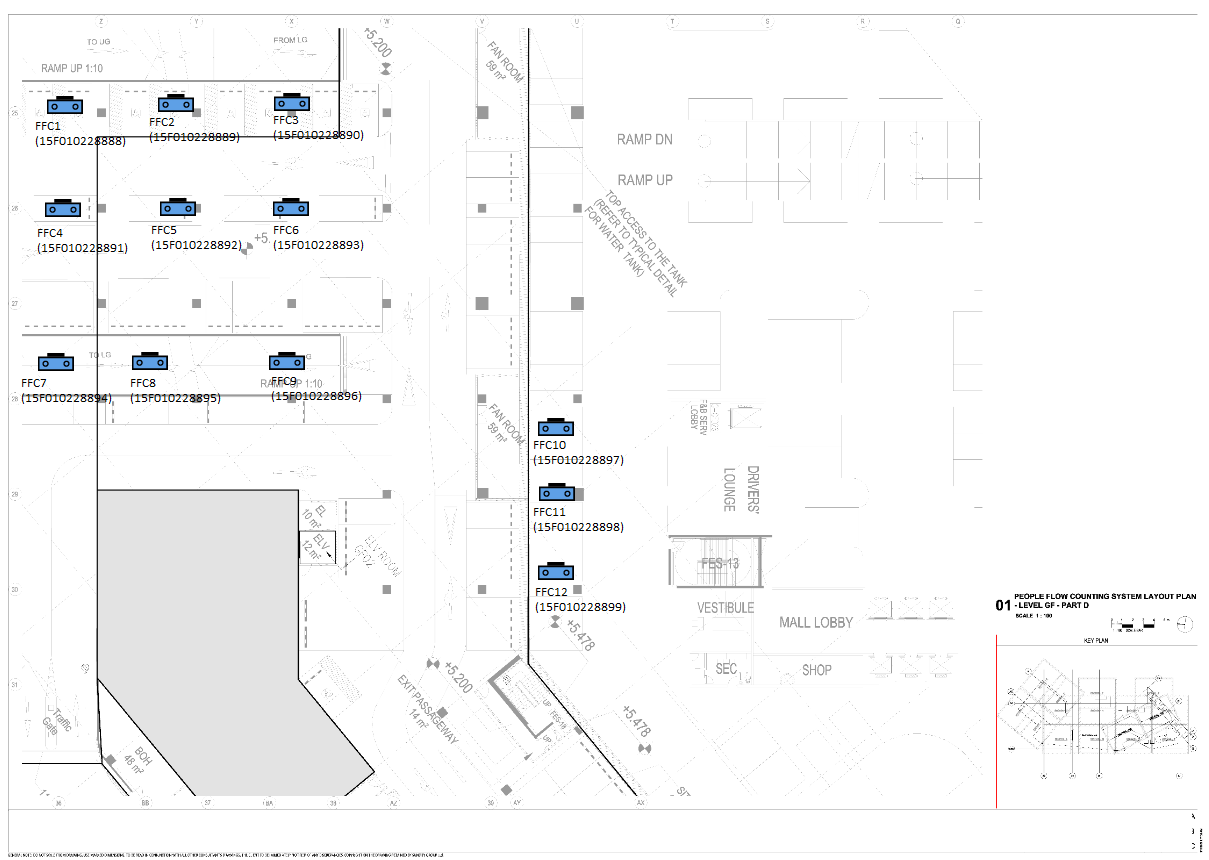
With the relevant documents, FootfallCam team will be able to configure the counter and dashboard to enable the heatmap feature.
1.2.2 Report Content
The report will contain the following floorplan:
-
Heatmap Analysis
-
Daily Passer-by
-
Daily Engaged Customer
-
Hourly Passer-by
-
Hourly Engaged Customer
-
Summary Table of Data
Sample Report:
1.3 Floorplan
1.3.1 Upload Floorplan
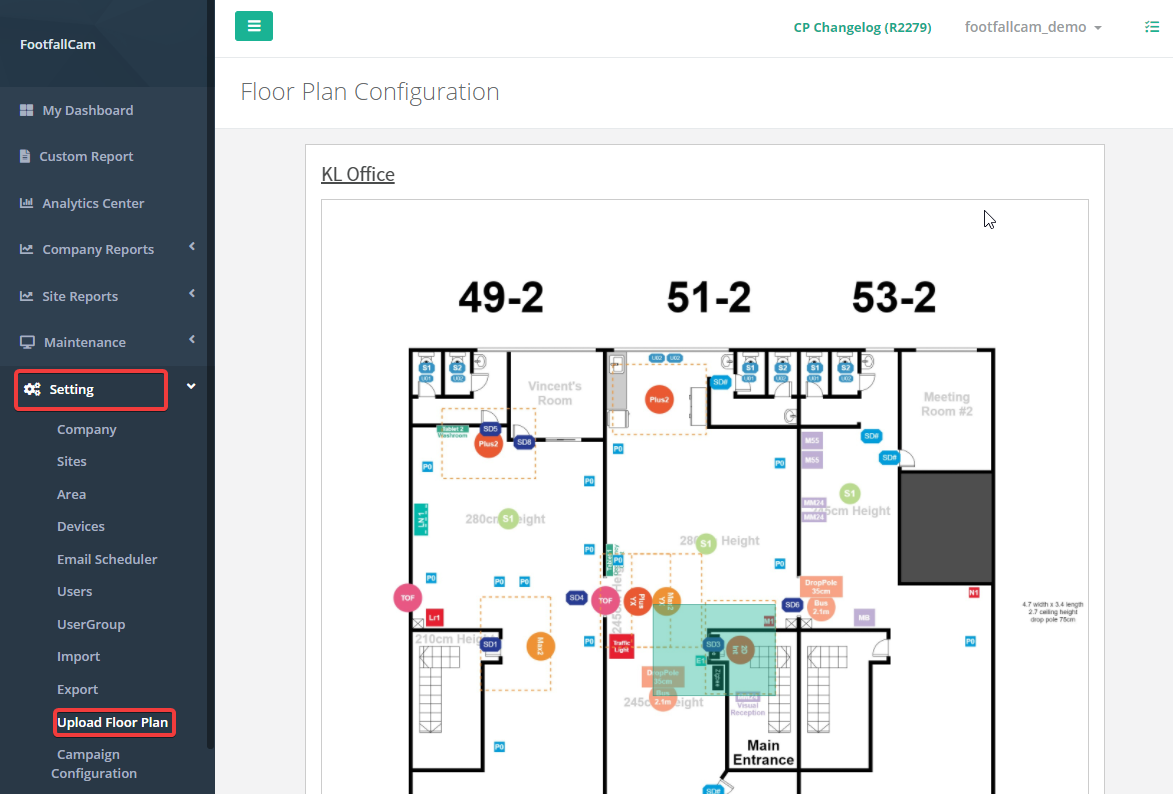
STEP 1 - Access to FootfallCam Analytic Manager V9™: http://v9.footfallcam.com via Google Chrome.
STEP 2 - Click on Setting > Upload Floorplan to access the Floorplan Configuration Page page.
STEP 3 - Make sure that there is already an existing site for the floorplan. If there is no site yet for the floorplan, follow 3.1 Set up site individually https://www.footfallcam.com/people-counting/knowledge-base/chapter-3-setting-up-sites/
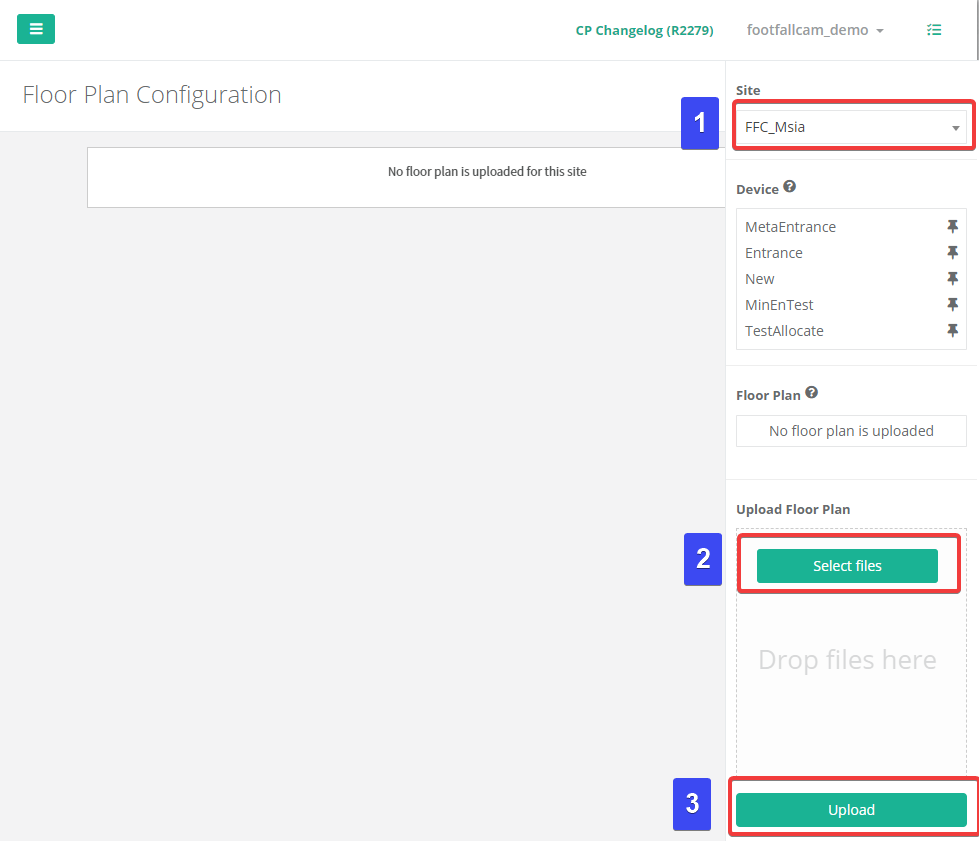
STEP 4 - On the right-side bar, select the site that the floorplan is being upload for. Then select the the floorplan to be uploaded to the website and select upload.
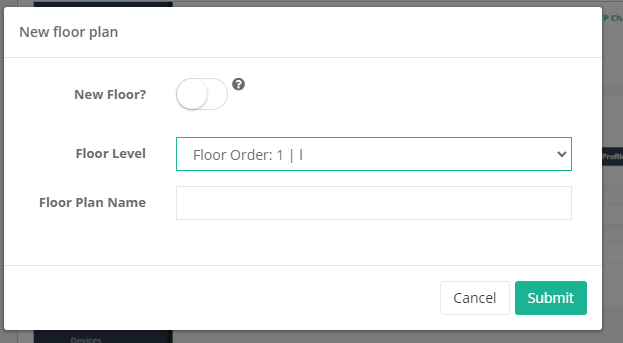
STEP 5 - Enter the floor name as well as the floor plan name. As there is currently no other floor in the site, the first floorplan will be considered as the 1st floor of the site.
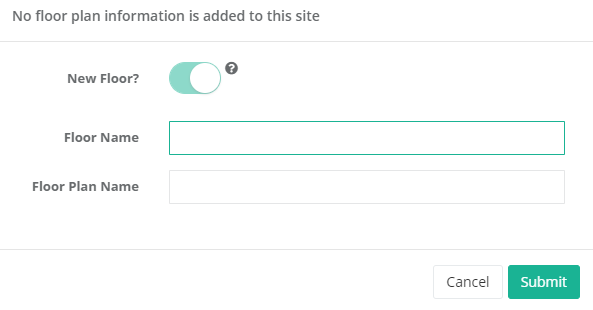
Multiple Floorplan can be added for the site, the floorplan that is uploaded can be on the same floor or on different floor or on different floor. For floorplan on a new floor, a new floor name is required for the floor if the new floorplan is on existing created floor. Select the floor level the floorplan is for.