


















The Integration 360 app is a centralized management hub designed to streamline, automate, and monitor all data exchanges between our system and external platforms.
Why?
- Automated Workflows: Eliminates manual data handling by allowing users to configure one-off or recurring jobs, such as automated secure SFTP data transfers or periodic CSV file lookups.
- Compatibility: Supports a wide array of data formats (JSON, CSV, Excel) and connection protocols (FTP, SFTP, EPOS, Shopify) to meet diverse client and third-party integration requirements.
- Visibility & Diagnostics: Provides real-time status tracking (Successful, Pending, Failed) across all jobs, making it easier to oversee operations and quickly troubleshoot connection timeouts or authentication issues.
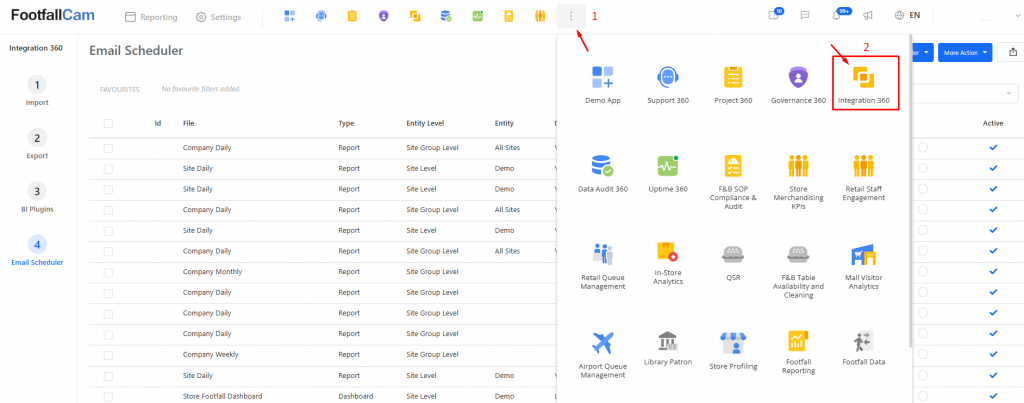
1.1 Import
The Import section allows you to manage incoming data from external sources. The main dashboard provides an overview of all configured import jobs, displaying their execution frequency, last run time, and current status (e.g., Successful, Pending, Failed).
Creating a New Import Job
Step 1: Initial Setup
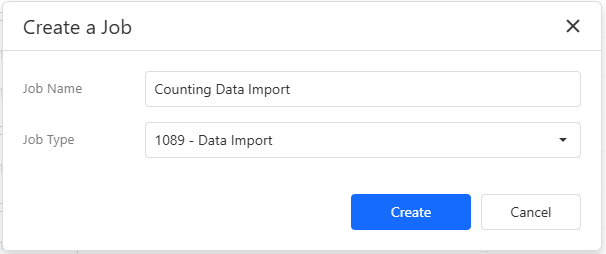
Click the blue + Create a Job button in the top right corner of the dashboard. A popup modal will appear. Enter your desired Job Name, select the Job Type (Import), and proceed to navigate to the detailed configuration form.
Step 2: Data Extraction
Define what data you are pulling. Select the Data type from the dropdown. The available Data Source options will dynamically update based on your selection.
| Data Type | Supported Data Sources |
| Sales Data | FTP, SFTP, EPOS, Shopify, Excel |
| Counting Data, Flight Counter Allocation | FTP, SFTP, Excel |
| Floorplan Data | JSON |
| Other Data Types | Excel |
Step 3: Connection Settings (FTP & SFTP)
If you are securely pulling data from a server, you must provide the necessary connection credentials.
- FTP: Requires Hostname, Port, Path, Username, and Password.
- SFTP: Requires all standard FTP fields, plus an uploaded SSH Key File and the corresponding Key File Password.
Step 4: Parser and File Settings
- Parser Type: Choose the appropriate parser from the dropdown to ensure the system reads your incoming data structure correctly.
- File Pattern: If using FTP or SFTP, specify the file pattern (e.g.,
data_.csv) so the system knows exactly which files to look for and extract from the server directory. - Once these details are configured, click Next to proceed to the scheduling options.
Step 5: Data Load (Scheduling)
In the final step, you will determine when and how often the import job runs.
- Mode: Select One-off if you only need to import data for a specific, singular instance, or Recurring to set up a continuous, automated schedule.
- Date Range: Specify the start and end dates to define the timeframe of the data being imported.
After configuring your scheduling preferences, click the blue Create Job button in the bottom right corner to finalize and save your setup.
References & Documentation:
Sales data import video guide:
Full supported user guide:
1.2 Export
The Export section allows you to extract and push data from our system out to external platforms, clients, or specific file destinations.
Similar to the Import dashboard, the main view provides a comprehensive list of all your configured export jobs. It displays the execution frequency, the timestamp of the last run, and the current status (e.g., Successful, Pending, Failed).
Pro Tip: In the Action column on the right, you will find a Duplicate Job option. This is highly useful for quickly cloning an existing complex export setup if you only need to make minor adjustments for a new job.
Creating a New Export Job
Step 1: Initial Setup
Click the blue + Create a Job button in the top right corner. A modal will prompt you to enter your Job Name and select the Job Type (choose "Export"). Click proceed to navigate to the detailed configuration form.
Step 2: Data Extraction
This section defines exactly what data you are packaging and how it will be formatted for delivery. Configure the following fields based on your requirements:
- Data: Select the core category of data you wish to export (e.g., Counting Data, Sales Data, Operating Hours).
- Entity Level: Define the hierarchical level of the data (e.g., Site level, Area level, or Company level).
- Entity: Specify the exact entity (e.g., choose the specific branch or site name you are pulling data for).
- Time Granularity: Select how the data should be grouped chronologically (e.g., Hourly, Daily, Weekly).
- Export Mode: Choose the delivery method for your data. Common options typically include FTP/SFTP, Email Delivery, or generating a direct Download Link. (Note: Selecting FTP/SFTP will prompt additional connection setting fields).
- File Format: Select the desired output format for the destination system (e.g., CSV, Excel, JSON).
Step 3: Data Load (Scheduling)
In the final section, determine when and how often the system should generate and send this export.
- Select One-off to generate a single export for a specific, historical date range.
- Select Recurring to set up an automated, continuous schedule (e.g., sending yesterday's data every morning).
Once all configurations are set, click the blue Create Job button in the bottom right corner to finalize, save, and activate your data export.
References & Documentation:
1.3 BI Plugins
The BI Plugins section provides options for connecting third-party Business Intelligence (BI) tools and reporting platforms directly to FootfallCam data. This section is organized into three tabs: API, Power BI, and Excel.
1.3.1 API Integration
Use this option to programmatically query and export FootfallCam Cube data directly into your custom applications or third-party platforms.
Step 1: Get Credentials
- Click the blue Get Credential button to generate your authentication credentials.
- Copy the generated Username and Password to connect to the FootfallCam Cube in your API application.
Step 2: Export Data via API
- Follow the link provided in the step-by-step guide on the page to structure your API requests and export data.
1.3.2 Power BI Integration
Connect FootfallCam counting data directly into Microsoft Power BI Desktop for interactive dashboards and custom visualizations.
Step 1: Get Credentials
- Click the Get Credential button to obtain your dedicated Power BI authentication credentials (Username and Password).
Step 2: Install Power BI Application
- If you do not have Power BI Desktop installed, click the Install button to download and install Microsoft Power BI Desktop.
Step 3: Connect and Build Reports
- Watch the embedded # Internal Training Power BI tutorial video for a walkthrough on connecting your credentials and creating your first graph using FootfallCam counting data.
1.3.3 Excel Integration
Import FootfallCam counting data directly into Microsoft Excel spreadsheets for easy analysis and reporting.
Step 1: Get Credentials
- Click the Get Credential button to generate your Excel access credentials (Username and Password).
Step 2: Install Npgsql Driver
- Click the Install button to go to the driver download page.
- Download
Npgsql-4.0.17.msiunder the Assets section. - Open the downloaded file and follow the installation wizard to complete the driver setup. (Refer to the embedded training video for guidance).
Step 3: Download Excel File
- Click Download to get the FootfallCam Data Connecter.xlsx template.
- This pre-configured Excel workbook utilizes the FootfallCam API, allowing you to input your credentials to fetch data directly into your spreadsheet.
Step 4: Retrieve Data in Microsoft Excel
- Follow the steps shown in the Data Integration with Excel video tutorial to set your date range, select sites, and populate counting data into your workbook.
References & Documentation:
- Refer to the Cube Documentations to view available data cubes, dimensions, and measures.
- Refer to the Metric Definitions to review the full list of available metrics.
1.3.4 DataBricks Integration
Connect FootfallCam counting data directly into Microsoft Power BI Desktop for interactive dashboards and custom visualizations.
Step 1: Get Credentials
Click the Get Credential button to obtain your dedicated authentication credentials (Username and Password).
Step 2: Log into DataBricks
Log into Databricks using your account
Step 3: Connect and Query
Connect to Databricks through Postgres using credentials obtained from step 1
Refer to Import and Export for more information on connecting to CubeJS with Databricks and start querying
1.4 Email Scheduler
The Email Scheduler section allows you to automate the delivery of specific reports, analytics, and dashboards directly to designated inboxes.
The main dashboard provides a clear overview of all active and inactive email schedules. You can quickly monitor the Next Scheduled Date Time and review the Last 5 Job Status column, which offers a quick visual indicator (green checkmarks for success) to ensure your automated emails are sending correctly.
Managing Schedules
At the top right of the dashboard, you have two primary dropdown buttons to manage your automated emails:
- + New Scheduler: Allows you to create a Single Schedule or set up Bulk Scheduling.
- More Action: Allows you to select multiple existing jobs from the dashboard to perform a Bulk Update or Bulk Delete, saving time on mass administration.
Option A: Creating a Single Schedule
- Click the blue + New Scheduler button and select Single Schedule.
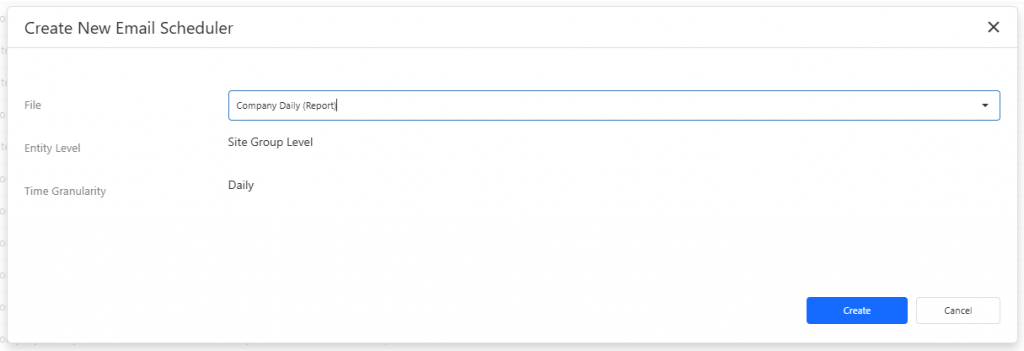
- A "Create New Email Scheduler" popup modal will appear.
- File: Click the dropdown to select the exact report or dashboard you want to export (e.g., Company Daily (Report), Site Sales Daily (Report), Analytics Workspace).
- Entity Level & Time Granularity: Depending on the file selected, define the hierarchy (e.g., Site Level, Site Group Level) and how the data should be grouped chronologically.
- Proceed through the subsequent prompts to finalize the recipient and scheduling details.
Option B: Setting up Bulk Scheduling
Use this option when you need to configure mass report deliveries across multiple entities or groups simultaneously.
- Click the blue + New Scheduler button and select Bulk Scheduling.
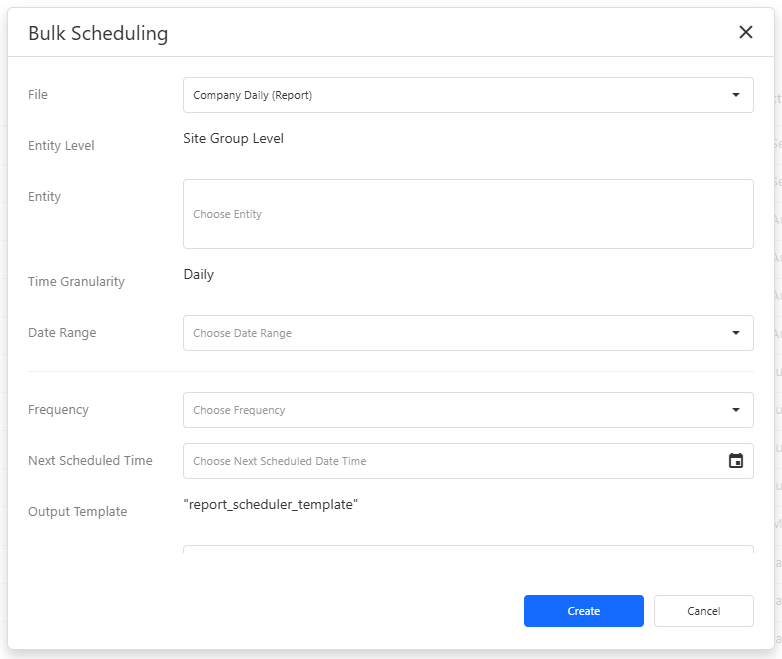
- A comprehensive "Bulk Scheduling" popup modal will appear. Configure the following parameters:
- File: Select the report or dashboard template to be exported.
- Entity: Choose the specific entities (e.g., branches or regions) the data should cover.
- Date Range: Specify the historical timeframe the report should analyze.
- Frequency: Define how often these emails trigger (e.g., Daily, Weekly, Monthly, or One Off).
- Next Scheduled Time: Use the calendar picker to set the exact date and time for the first delivery.
- Recipient Group(s): Select the predefined mailing lists or user groups that should receive these automated reports.
- Once all parameters are defined, click the blue Create button at the bottom of the modal to activate your bulk email schedules.
1.5 Data Manager Implementation Guide
FootfallCam's Data Manager Application is an open-source script that aims to assist customers with data pulling in a more streamlined and approved method.
Core Problem: Standard API polling often mistakes a successful connection response for complete data. In a distributed platform, records remain provisional while device uploads, aggregation, or reprocessing completes. A one-time poll cannot distinguish a final period from a temporarily incomplete one.
Core Business Result: Temporary processing delays will no longer become permanent database omissions, and business users gain complete visibility into period status.
In-Scope: Connection to FootfallCam V9 cube service, readiness evaluation, automatic retrieval of non-final periods, safe insertion/update (MariaDB/SFTP), logging, period watermarks, reconciliation, and backfill controls.
Out-of-Scope: Customer dimensional modeling, custom calculations, platform incident response, or substituting source-platform validation.
The workflow inspects readiness between retrieval and publication. Complete periods are idempotently upserted, while non-final periods route directly into a persistent retry queue for re-evaluation.
ARCHITECTURAL FLOW: [Trigger] -> [Retrieve Period] -> [Inspect Readiness]
├── Complete State -> [Validate & Upsert] -> [Update Audit & Watermark]
└── Non-Final State -> [Queue in Retry] -> [Re-evaluate Under Schedule]
Package Components: Config.json (Settings), DataManagerApp.py (Core engine), requirements.txt (Python dependencies), run.bat (Windows launcher), data_integration.log (Execution log).
Data Levels: ffc_site_summary (Site level), ffc_area_summary (Area/Dwell), ffc_device_summary (Device raw data).
Security & Account Access Model
Target Access: Restrict the target database account to the staging schema or SFTP landing directory assigned to the integration.
Credential Protection: Never include live passwords or tokens in configuration files, scripts, or support tickets. Restrict Config.json read permissions to the service identity and exclude it from unapproved backups.
Technical Prerequisites
Host Environment: Windows Server (for run.bat and Task Scheduler) or Linux host with cron. Python 3.x with pinned dependencies.
Network: Outbound access to V9 cube endpoint.
Configuration Reference
Below is a sanitized configuration template. Key parameters must be validated against the active environment prior to schedule activation.
{
"postgres": {
"host": "cube.footfallcam.com",
"port": 6432,
"user": "<FFC_SOURCE_USER>",
"password": "<FROM_APPROVED_SECRET_STORE>",
"dbname": "postgres"
},
"mariadb": {
"host": "<CUSTOMER_DATABASE_HOST>",
"port": 3306,
"user": "<CUSTOMER_DATA_MANAGER_USER>",
"password": "<FROM_APPROVED_SECRET_STORE>",
"database": "footfallcam_stage"
},
"level": "ffc_site_summary",
"granularity": "daily",
"table_name": "ffc_site_daily_stage"
}
| Granularity Name | V9 Concept | Implementation Rule |
| daily | Time with day granularity | Standard daily reporting grain |
| hourly | Time with hour granularity | Standard hourly intraday grain |
| minute | Time with minute granularity | Use only where metrics & policy support. |
| 15_minute | Time15Minute dimension |
V9 Aggregation Status Decision Rules
| Status | Published Meaning | Data Manager Action | Reporting Treatment |
| Complete | No data hole identified for period. | Validate & idempotently upsert; record status timestamp. | Publishable |
| Delay | Late data present; may become Complete. | Store state; queue exact period for retry. | Provisional |
| On Hold / To Aggregate / To Reaggregate | Period is pending checking | Store state; retry on next controlled cycle. | Pending |
| Missed | Data hole identified in source. | Record hole; retain values without converting to 0; retry. | Exception |
| Data Spike Detected | Data spike detected in source. | Record spike; If genuine, keep, otherwise, raise to FootfallCam for checking | Provisional |
Idempotent Upsert & Schema Strategy
Target tables must enforce a composite unique key (e.g., site_id + period_start + granularity) to ensure reruns update existing records rather than inserting duplicates.
-- Illustrative MariaDB Idempotent Upsert
INSERT INTO ffc_site_daily_stage (
site_id, period_start, granularity, a01, a02,
aggregationstatus_a01, source_status_updated_utc, ingestion_updated_utc
) VALUES (
:site_id, :period_start, :granularity, :a01, :a02,
:aggregationstatus_a01, :source_status_updated_utc, UTC_TIMESTAMP()
) ON DUPLICATE KEY UPDATE
a01 = VALUES(a01),
a02 = VALUES(a02),
aggregationstatus_a01 = VALUES(aggregationstatus_a01),
source_status_updated_utc = VALUES(source_status_updated_utc),
ingestion_updated_utc = UTC_TIMESTAMP();
Reconciliation Windows
Incremental Lookback: Current period + prior 7 completed days on every routine run.
Daily Reconciliation: Prior 7 days, prioritizing unresolved status queues.
Weekly Reconciliation: Prior 35 days to ensure complete historical alignment and capture long-delayed device uploads.
Note: Daily is recommended.
Scheduling Guidelines
Windows Task Scheduler: Configure task using 'Run whether user is logged on or not' with a dedicated service account. Set 'Start in' to the application directory so relative paths resolve.
Concurrency Control: Enable 'Do not start a new instance' if the task is already running to prevent concurrent overlapping executions.
Transient Technical Retries: Use exponential backoff with jitter (e.g., 30s, 2m, 5m, 15m) for network/timeout errors. Do NOT use transient retries for non-final aggregation statuses.
Operational Troubleshooting Matrix
| Symptom | Primary Cause | Resolution Steps |
| No Run Record | Scheduler / Host Issue | Check Task Scheduler history, service identity, host logs |
| Auth Failure | Invalid / expired credentials | Halt retries; verify account status and credentials |
| Zero Rows Returned | Date range or filter mismatch | Verify filters |
| Late Data Persists | Delayed upstream uploads | Keep queued; monitor and raise to FootfallCam if persists |
| Duplicate Rows | Unique key missing in target | Halt reporting; define composite unique key on the target table |
Responsibility Matrix (RACI)
Responsible | Accountable | Consulted | Informed
| Activity | FootfallCam | User IT / Data | Business Owner |
| Provision Source Access & Definitions | R / A | C | I |
| Host, Configure & Schedule Data Manager / Self-Written Scripts | C | R / A | I |
| Investigate V9 Readiness / Source Issues | R / A | C | I |
| Investigate Local Network / Target Issues | C | R / A | I |
| Approve Data Publication Rules | C | C | R / A |
Go-Live Acceptance Criteria
1. Connectivity: Service accounts verify least-privilege target access.
2. Readiness Loop: Test payloads containing Late Data enter retry queues without populating reports.
3. Idempotency Proof: Consecutive manual runs of identical parameters leave row counts completely unchanged.
4. Interruption Recovery: Forced network drops during execution recover safely without advancing watermarks prematurely.
Link to example script: Data Manager External App