













1.1 Data Readiness at Reporting Cut-off
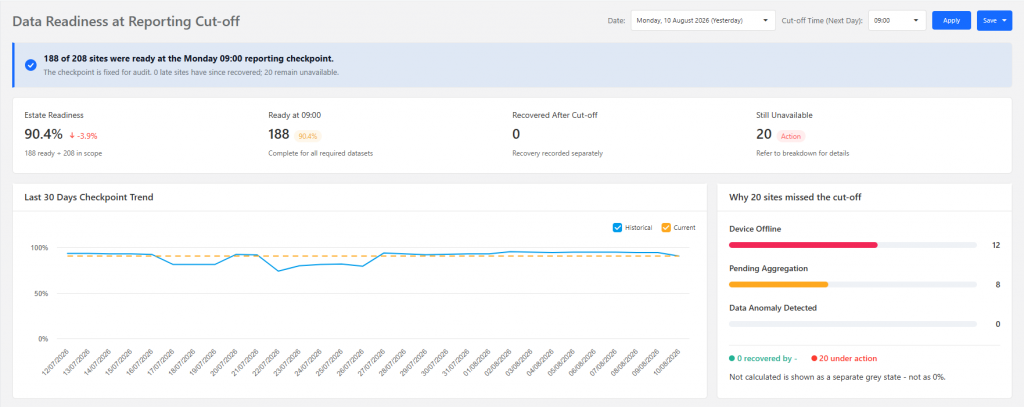
The Data Readiness at Reporting Cut-off dashboard provides an overview of how many sites have completed all required data processing by the reporting cut-off time. The dashboard shows the overall readiness percentage, based on the number of sites that are ready compared with the total number of sites in scope. It also shows how many sites were ready by the cut-off time, recovered after the cut-off or are still unavailable.
The dashboard shows the overall readiness percentage, based on the number of sites that are ready compared with the total number of sites in scope. It also shows how many sites were ready by the cut-off time, recovered after the cut-off or are still unavailable.
The Last 30 Days Checkpoint Trend shows how the readiness percentage has changed over the previous 30 days, helping users identify improvements or declines in data readiness.
For sites that missed the cut-off, the dashboard provides a breakdown of the reasons, such as Device Offline, Pending Aggregation and Data Anomaly Detected. Sites that recovered after the cut-off are tracked separately, while sites that remain unavailable are highlighted for further action.
1.2 Site Data Audit
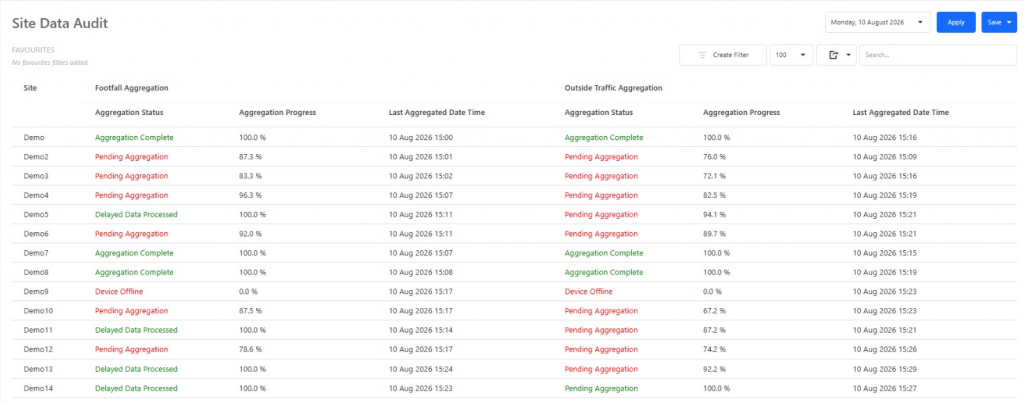
Site Data Audit provides a daily overview of data aggregation for each site. It displays the site name, Footfall and Outside Traffic aggregation status, aggregation progress and the last aggregated date and time. This allows users to quickly monitor the completeness and timeliness of site data and identify any sites with missing, delayed or incomplete aggregation.
1.3 Device Certification
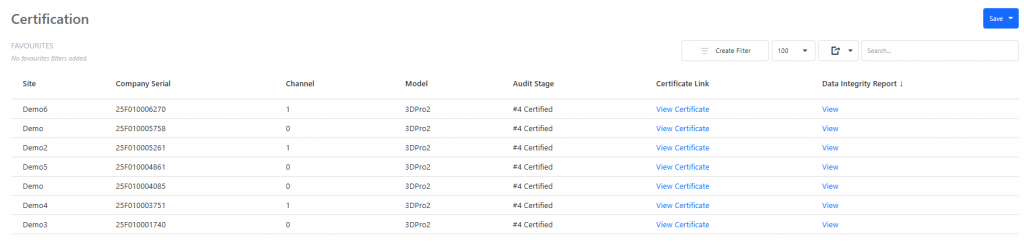
The Certification page provides an overview of the certification status and supporting information for each device.
1.4 Device Accuracy
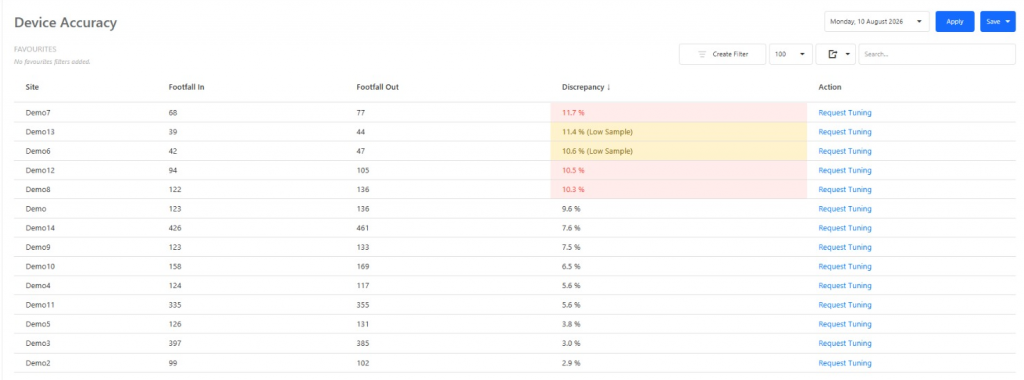
The Device Accuracy page provides an overview of each site's daily footfall counting accuracy.
The page helps users identify sites with potential device accuracy issues and provides a direct way to request tuning when required.
1.5 Data Audit Rules
The Data Audit Rule page allows users to create and manage data audit rules used to monitor the quality, completeness, and reliability of site data.
There are six types of rules that can be created:
- 1295 - Queue Data Monitoring Alert Rule
- 1298 - Till Active Status Data Monitoring Alert Rule
- 1352 - Live VS Historical Discrepancy Check
- 1353 - Live Data Freshness Monitoring Rule
- 1354 - Historical Data Completion and Quality Check
- 1355 - Drift Detector for Data Check Rule
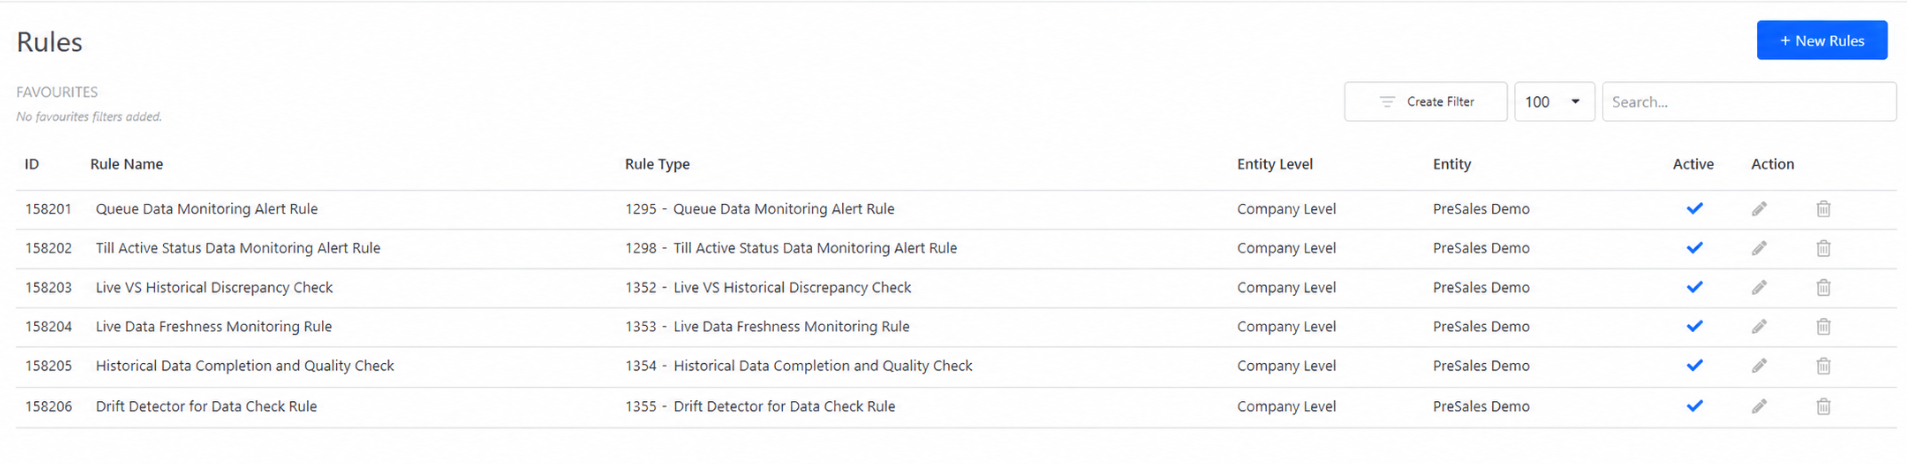
Users can configure and create the appropriate rule based on the type of data quality or monitoring requirement they need to address.
1.5.1 How to Create Rule
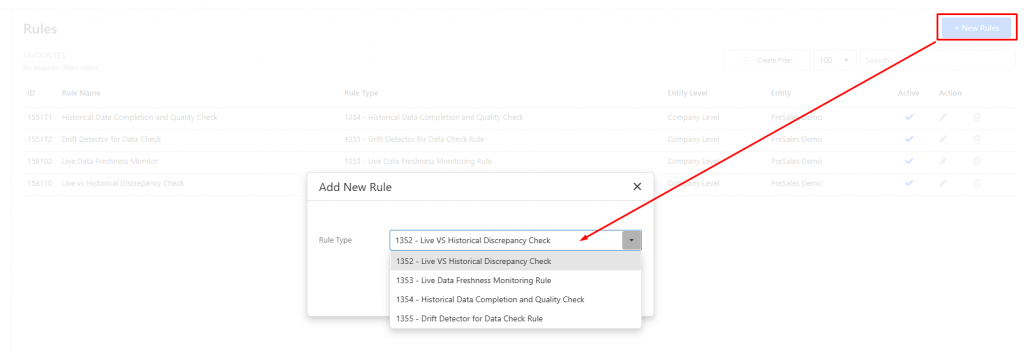
- Click on "New Rule", and select the rule type to be configured and click on "Create".
- It will bring user to the next page where certain configurations can be done:
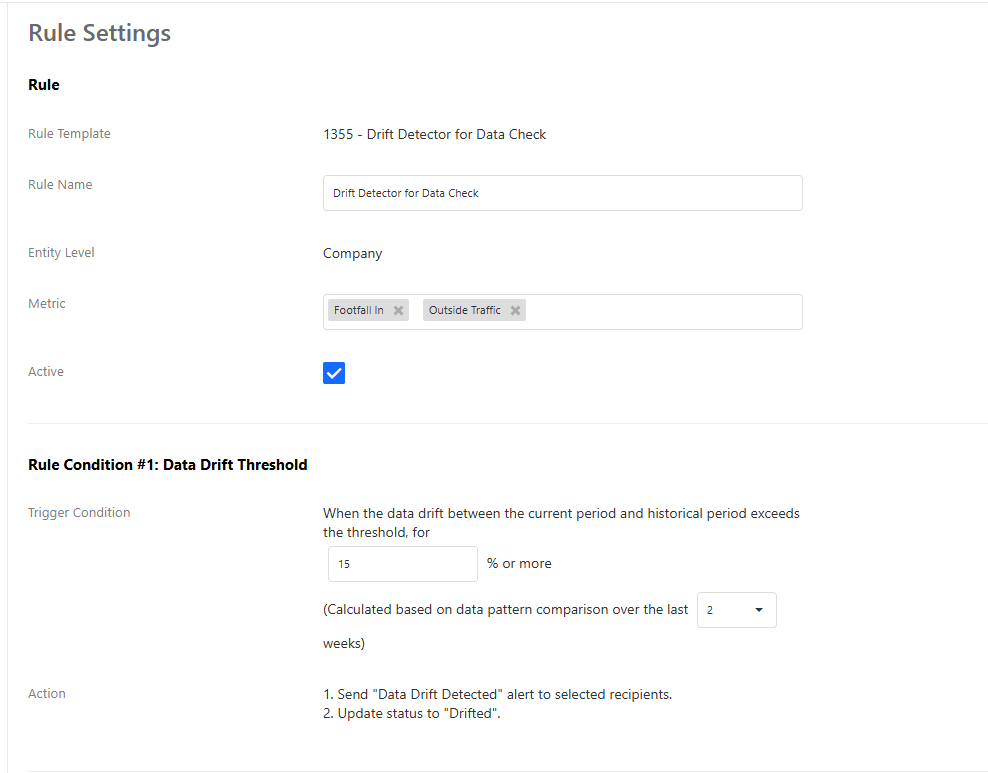
- Metric: The metrics that will be evaluated by the rule.
- Trigger Condition: The data condition for the rule to trigger alerts.
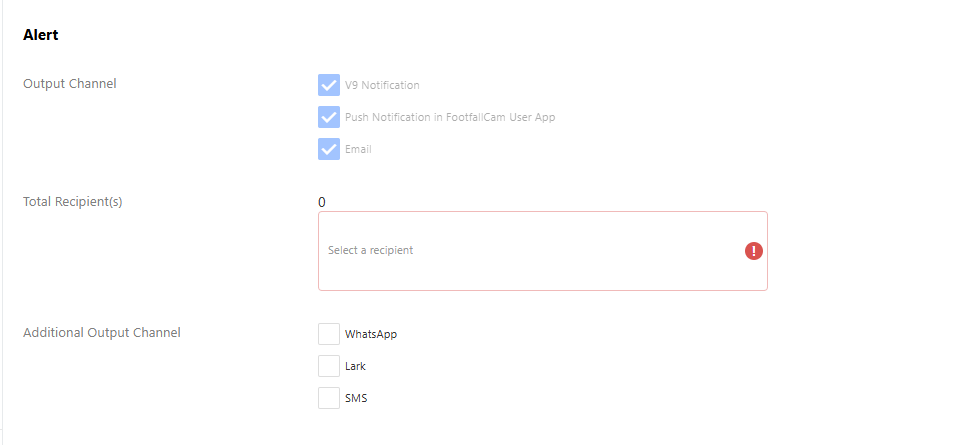
- Alert Methods: How the alert will be sent and the recipients that are expected to receive the alert notifications.
1.5.2 1295 - Queue Data Monitoring Alert Rule
This rule detects queue information that appears to be frozen or is no longer updating correctly. It monitors queue length and predicted queue waiting time, and raises an alert when the same high value is repeatedly reported throughout the configured monitoring period.
The rule runs every five minutes. If the issue continues, another alert can be sent after the configured re-alert interval. When the queue data starts changing normally again, the alert status returns to normal.
1.5.3 1298 - Till Active Status Data Monitoring Alert Rule
This rule checks whether the active-lane status agrees with the till's actual activity. It raises an alert when till throughput is greater than zero while the number of active lanes is zero.
The rule runs every five minutes for the selected till areas. If the condition continues, another alert can be sent after the configured re-alert interval. A recovery record is created when all monitored till areas return to normal.
1.5.4 1352 - Live VS Historical Discrepancy Check
This rule confirms that live data is transferred and processed into historical reporting without unexpected differences. It compares live and historical values for Occupancy, Average Queue Waiting Time and Number of Active Areas or Till Throughput.
The rule runs hourly and raises an alert when the difference exceeds the configured discrepancy percentage. It continues reporting the discrepancy while the issue remains unresolved.
1.5.5 1353 - Live Data Freshness Monitoring Rule
This rule identifies delayed live data or device outages before they affect live reporting. It monitors whether selected live metrics, such as Footfall, Outside Traffic, Occupancy and Queue data, are received within the configured time threshold during site operating hours.
The rule runs according to the configured monitoring interval. It raises an alert when data is delayed or when all devices responsible for Footfall or Outside Traffic are offline. Closed sites and periods outside operating hours are excluded, and a recovery record is created when the data returns to normal.
1.5.6 1354 - Historical Data Completion and Quality Check
This rule identifies incomplete or missing historical data before it is used in reports. It checks the previous day's processing status for selected metrics, including Footfall, Outside Traffic, Queue, Touch Point, Heatmap, Gender and Age Group data.
The rule runs hourly and raises an alert when the completion percentage of a selected metric is below 90%. Sites that were closed on the day being checked are excluded.
1.5.7 1355 - Drift Detector for Data Check Rule
This rule identifies gradual or sudden changes in data patterns that may indicate a sensor, configuration or data-quality problem. It compares the current period with an earlier historical period for selected metrics such as Footfall, Occupancy, Outside Traffic, Touch Point, Heatmap, Gender and Age Group.
The rule calculates the difference between the two periods and raises an alert when it exceeds the configured drift threshold. The data check is scheduled to run weekly, and a recovery record is created when all monitored metrics return to their expected range.
1.6 Notification List
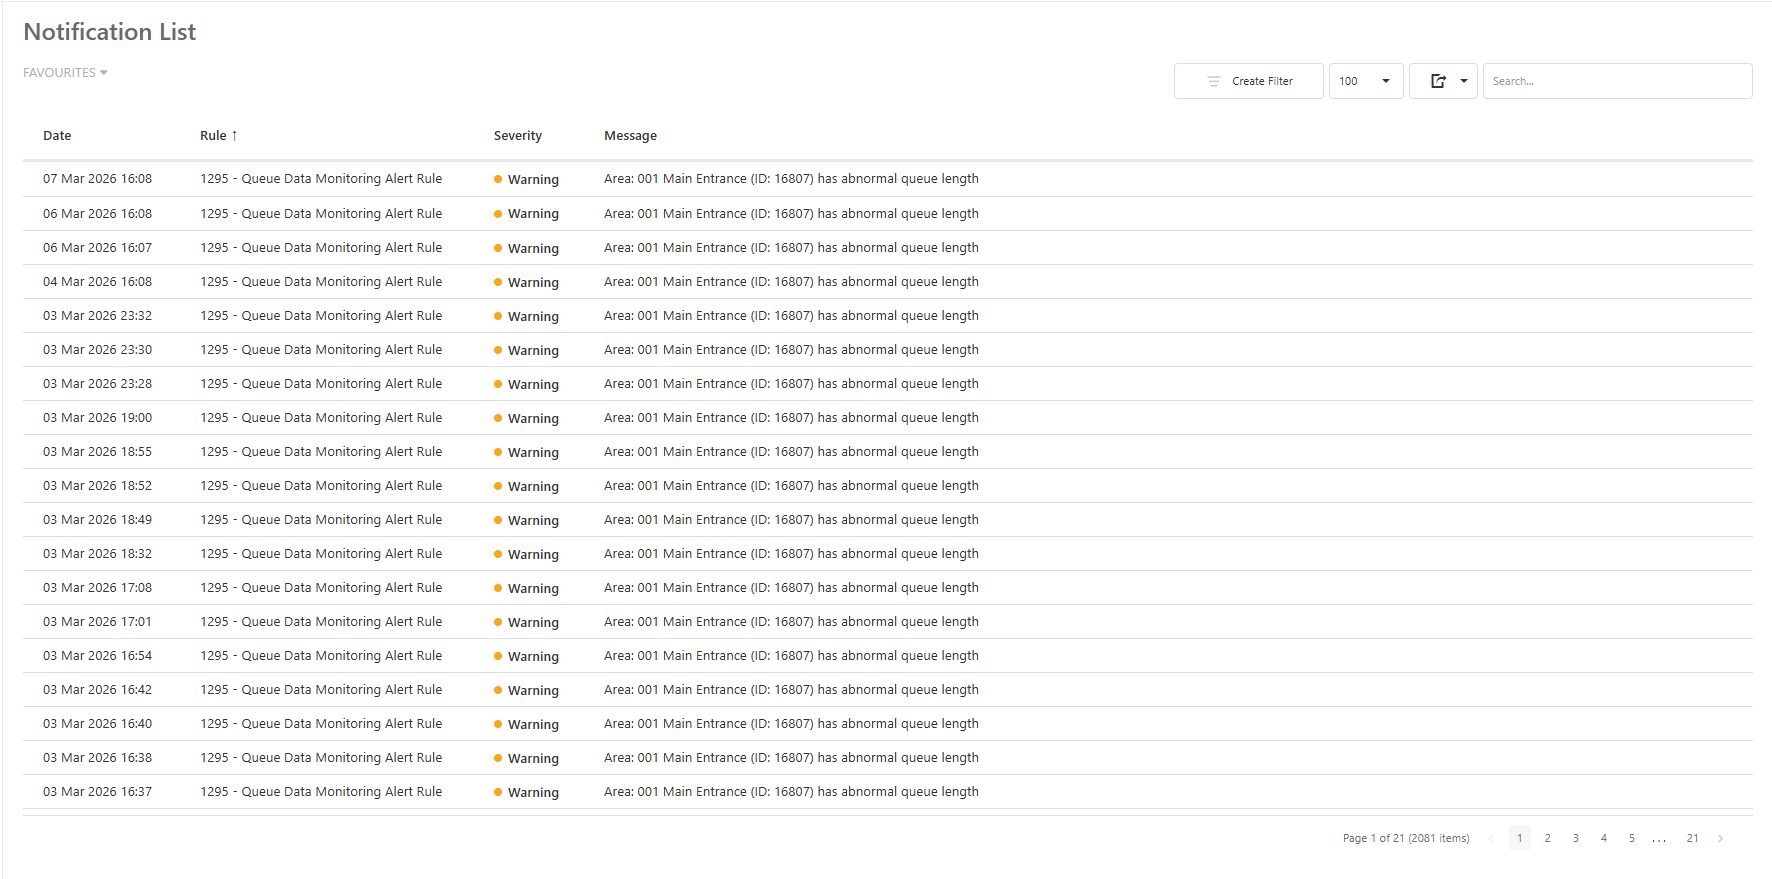
The Notification List page displays notifications generated by the rules configured in 1.5 Data Audit Rule, together with the date and time each notification was created. Clicking on the notification message will bring the user to the rule settings page to reconfigure rule settings if needed.
The Notification List contains the following information:
- Date: Shows the date and time when the notification was generated.
- Rule Type: Identifies the data audit rule that generated the notification.
- Severity: Indicates the status and level of attention required for the detected condition. Refer to the severity descriptions below.
- Message: Provides details of the detected issue, including the affected site, area or metric where applicable. Clicking the message opens the related rule settings page for review or reconfiguration.
Severity meanings:
- Critical / P1: The highest severity level. It indicates a critical condition that requires immediate attention.
- Error / P2: Indicates a significant failure or data-processing problem that should be investigated promptly.
- Warning / P3: Indicates that a rule has detected an abnormal condition that requires attention. For the current Data Audit rules, conditions such as breached thresholds, delayed data or offline devices normally appear as Warning.
- Information / Info: Provides an informational update that does not require immediate corrective action.
- Success: Indicates that an operation or check was completed successfully.
- Restored: Indicates that a previously detected problem has recovered and the monitored data or service has returned to its normal state.