









In Out Counting (Pro2)
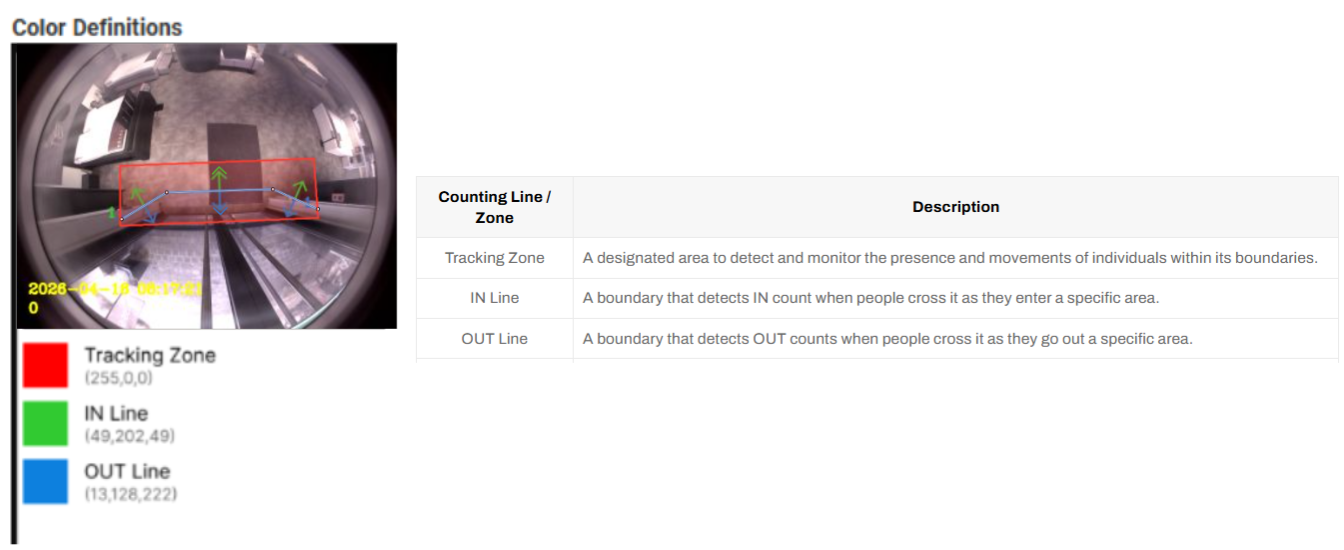
Working Principle:
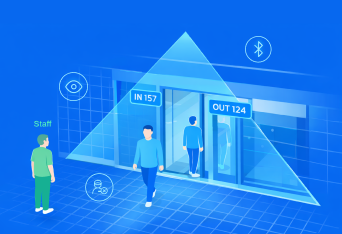
- Tracking each human detected by AI algorithm
- Constantly checking if the human is within the tracking zone
- If the human crosses either the In-line or Out-line, a counting event is registered.
- However, the event is ignored if the human makes a U-turn.
- When the human leaves the tracking zone, the event is collected and sent.
Counting Line/Zone Definition
Data Integrity Report (Accuracy Validation)
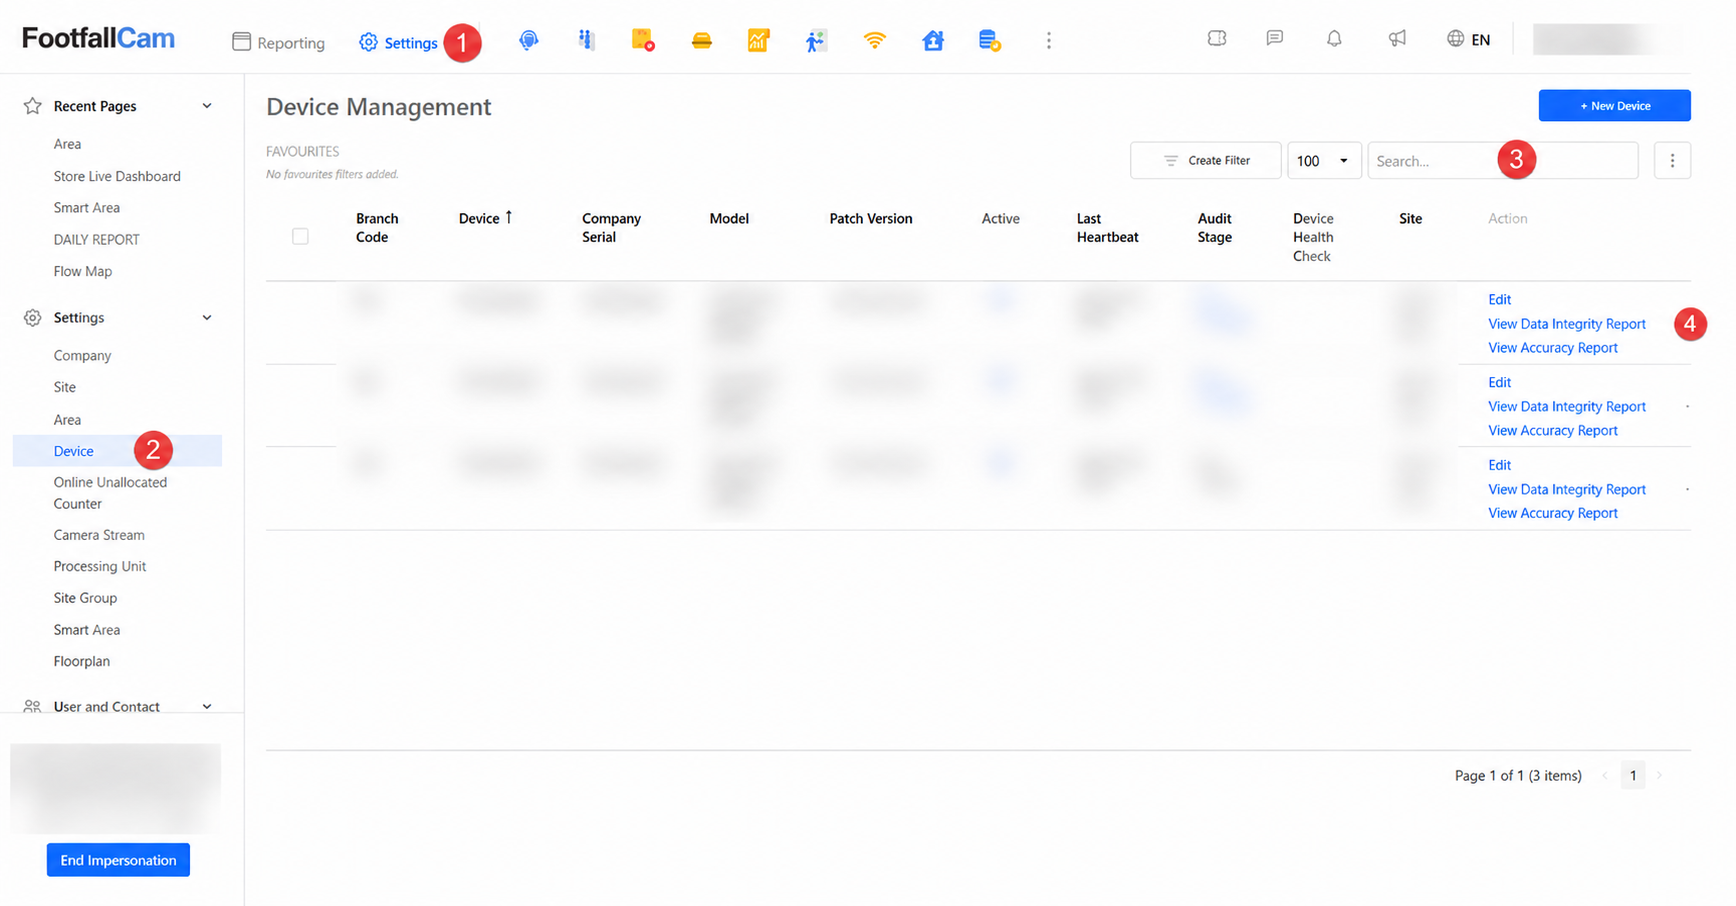
Step 1: Click on "Settings"
The v9 page starts off with showing the "Reporting page", which then has to be navigated to the "Settings" page.
Step 2: Click on "Device"
Upon clicking on "Settings", head over to the left column and look for the "Device" button, and click on it.
Step 3: Use the "Search" Filter to Find the Specific Device to View the Report
Upon completing the steps, there is a search bar which contains filters that can be used to filter specific devices of the user's choice.
Step 4: Viewing the Device Info
Upon Completing the steps mentioned above, there will be a "Edit" for the filtered device, click on the "Edit" button.
Step 5: Viewing the Data Integrity Tab
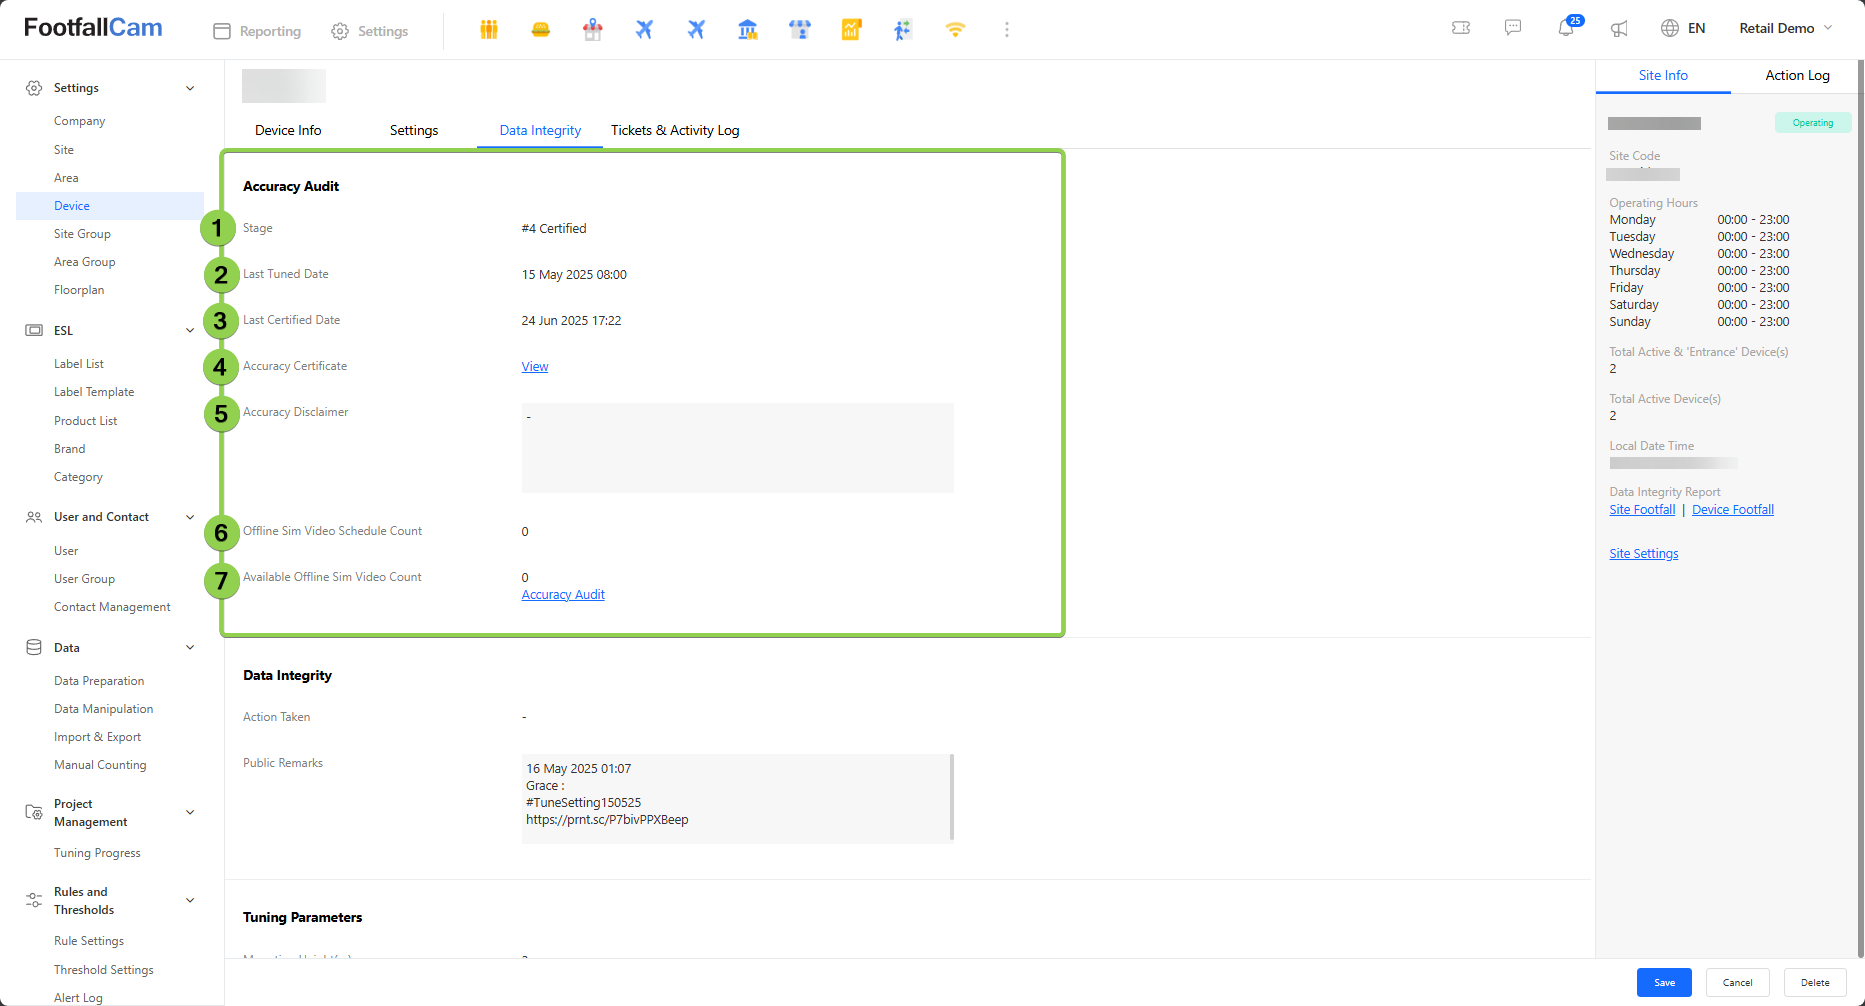
| Item | Description |
| 1. Stage | Display the stage of the device. |
| 2. Last Tuned Date | Display the last tuned date |
| 3. Last Certified Date | Display the last certified date |
| 4. Accuracy Certificate | Display the button to navigate to the accuracy certificate. |
| 5. Accuracy Disclaimer | Display the accuracy disclaimer |
| 6. Offline Video Schedule Count | Display the count of offline video |
| 7. Available Offline Video Count | Display the count of the available offline video Note: Click the hyperlink to schedule Online Sim video |
Step 6: Schedule Video (Click Hyperlink from previous Item 7)
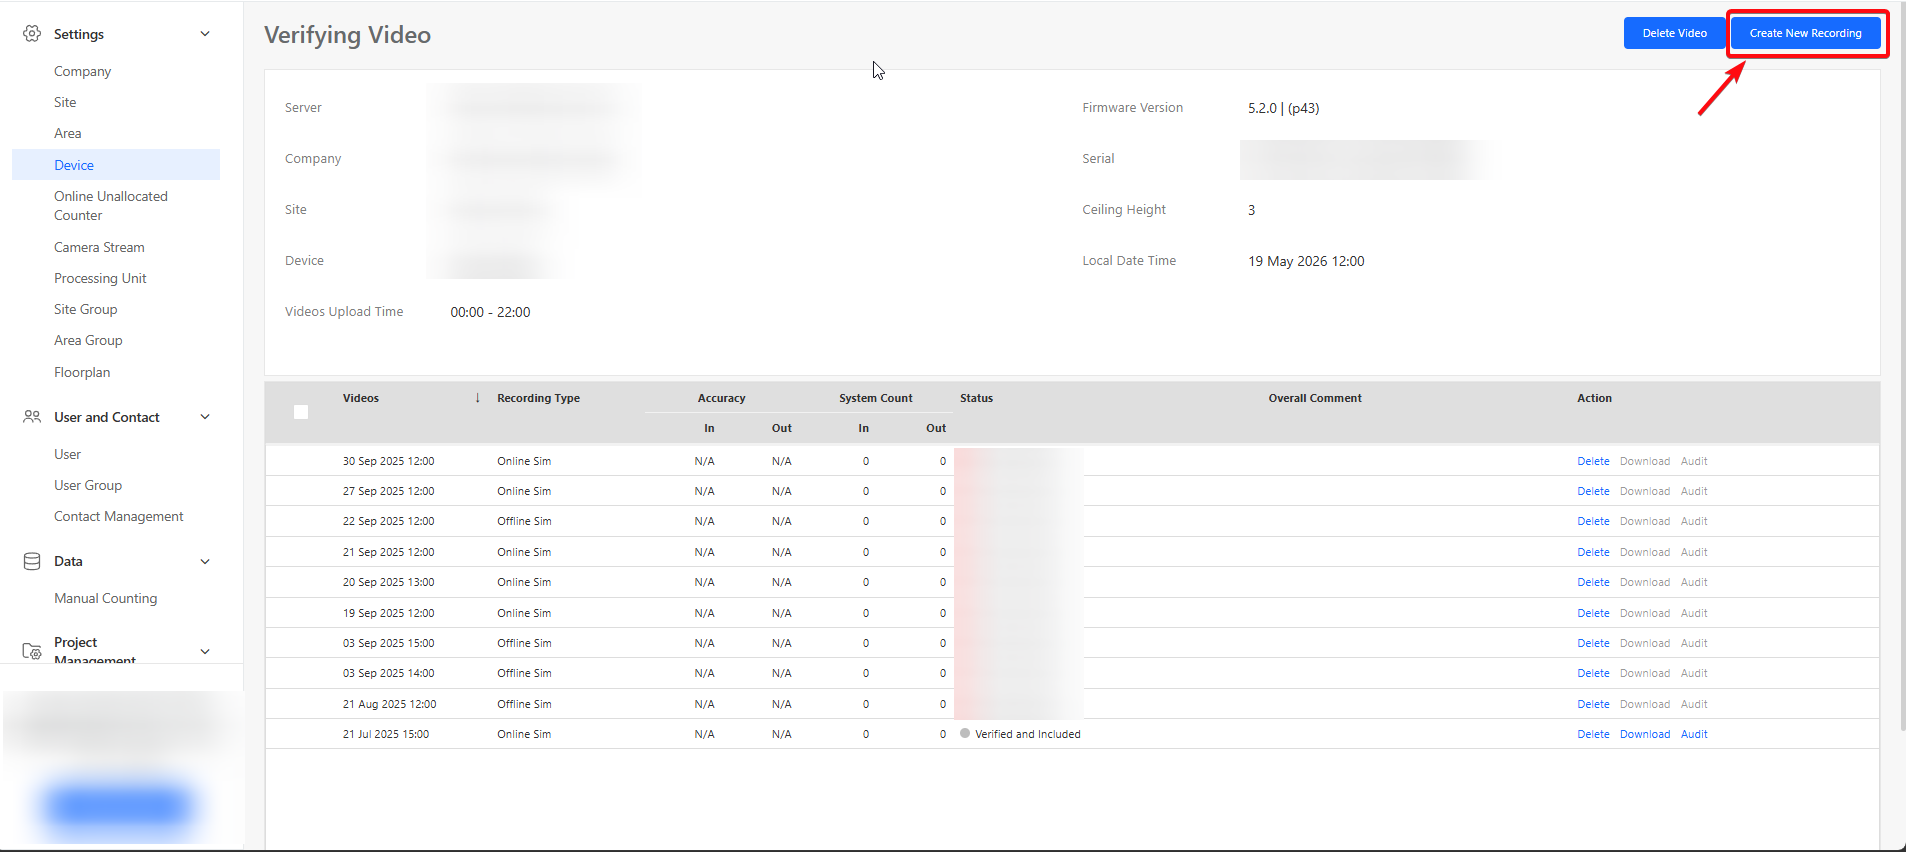
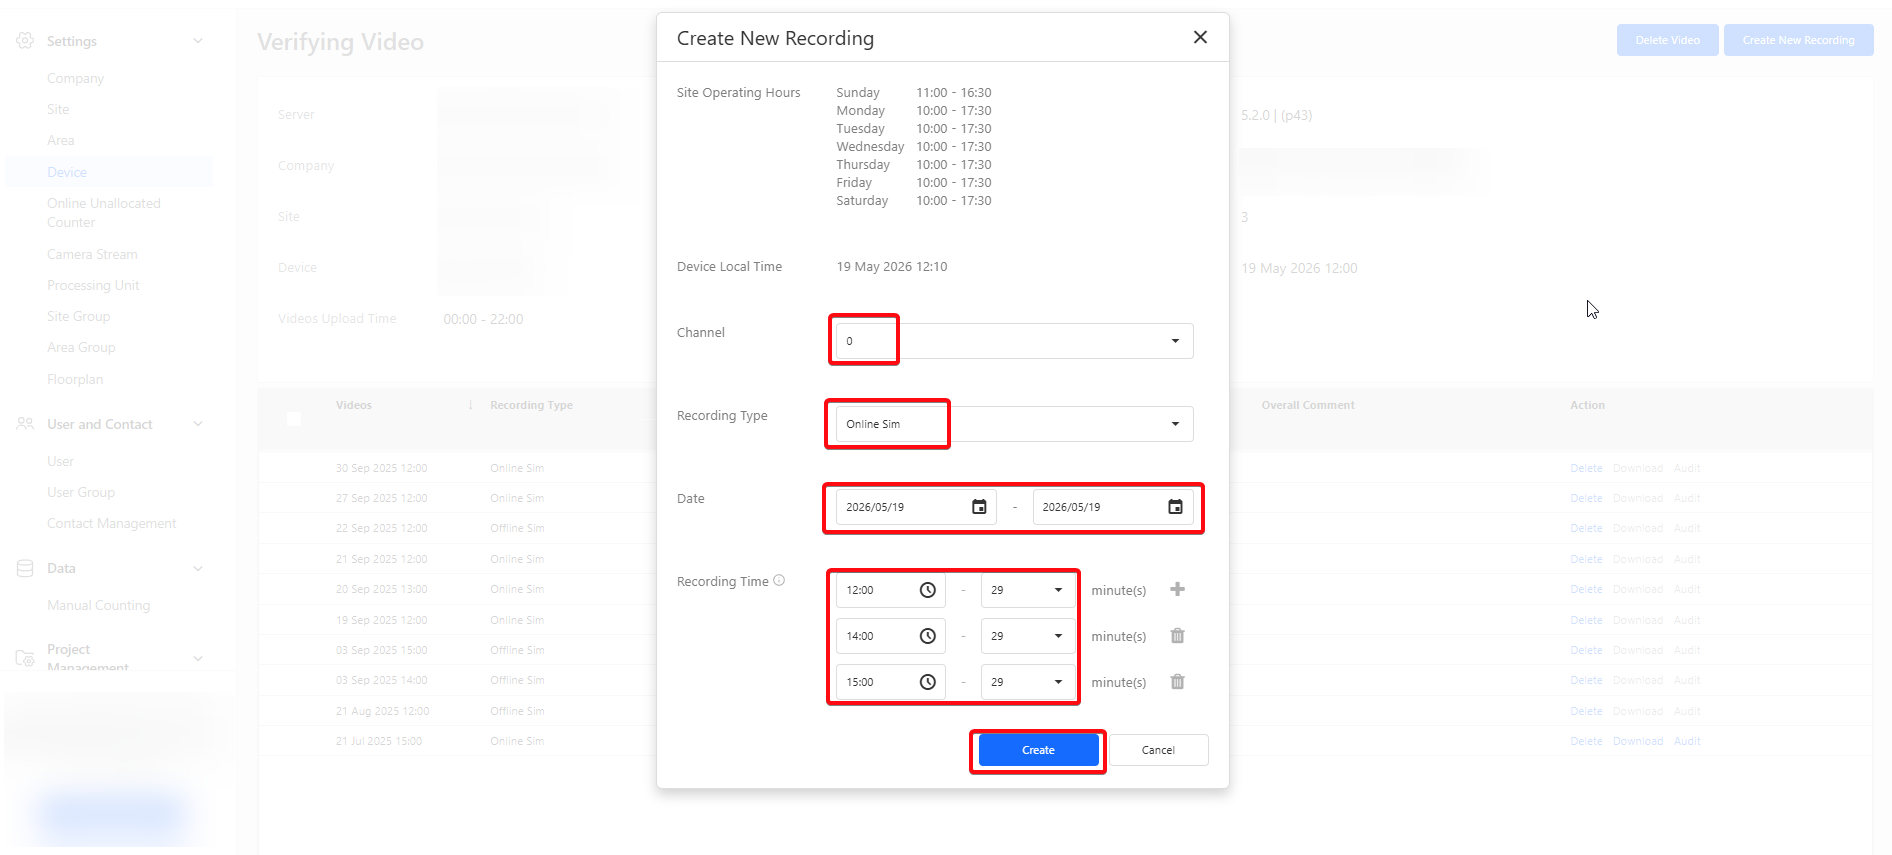
Step 7: Verifying Video
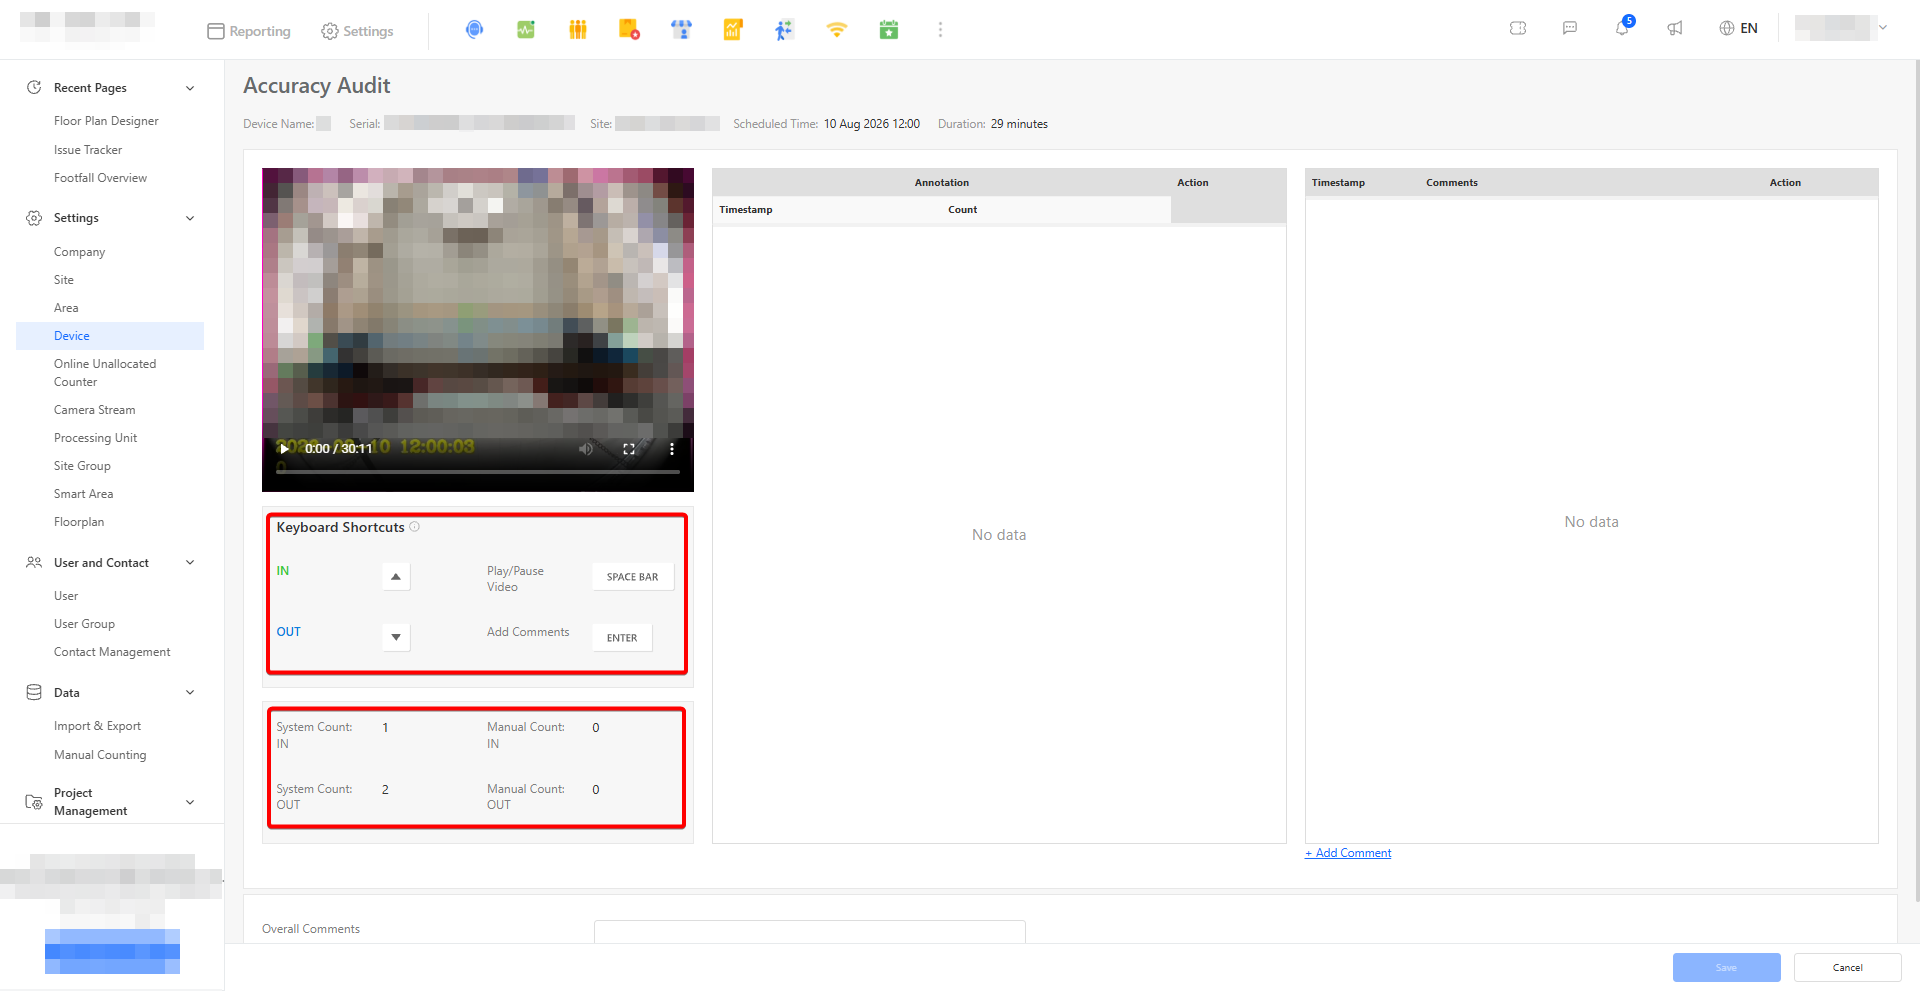
Once the recording has been successfully scheduled, the Audit button will become available for the recorded video(s). Clicking the Audit button will navigate you to the Accuracy Audit page.
On this page, you can perform the audit by using the provided keyboard shortcuts for efficient counting. The system will display both System Count and Manual Count, allowing easier comparison and assessing the accuracy.
Accuracy Certificate Report
This is a guide on checking for certificate reports after a device has been certified, along with the certificate reports of sub-channels (if any) will all be shown in this menu. It is crucial to ensure that v9 has been logged into to view the v9 portal.
Step 1: Click on "Settings"
The v9 page starts off with showing the "Reporting page", which then has to be navigated to the "Settings" page.
Step 2: Click on "Device"
Upon clicking on "Settings", head over to the left column and look for the "Device" button, and click on it.
Step 3: Use the "Search" Filter to Find the Specific Certified Device to View the Report
Upon completing the steps, there is a search bar which contains filters that can be used to filter specific devices of the user's choice.
Step 4: Viewing the Accuracy Report(s) Included during Certification
Upon Completing the steps mentioned above, there will be a "View Accuracy Report" for the filtered device, click on the "View Accuracy Report" button to view the amount of channels of the device and their report links.
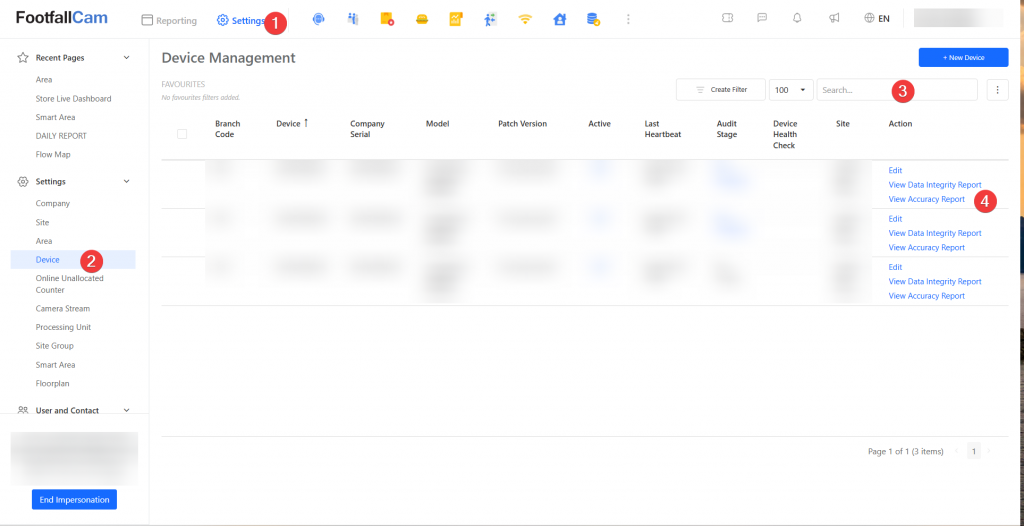
Step 5: Select a Report to View the Certificate Included During Certification
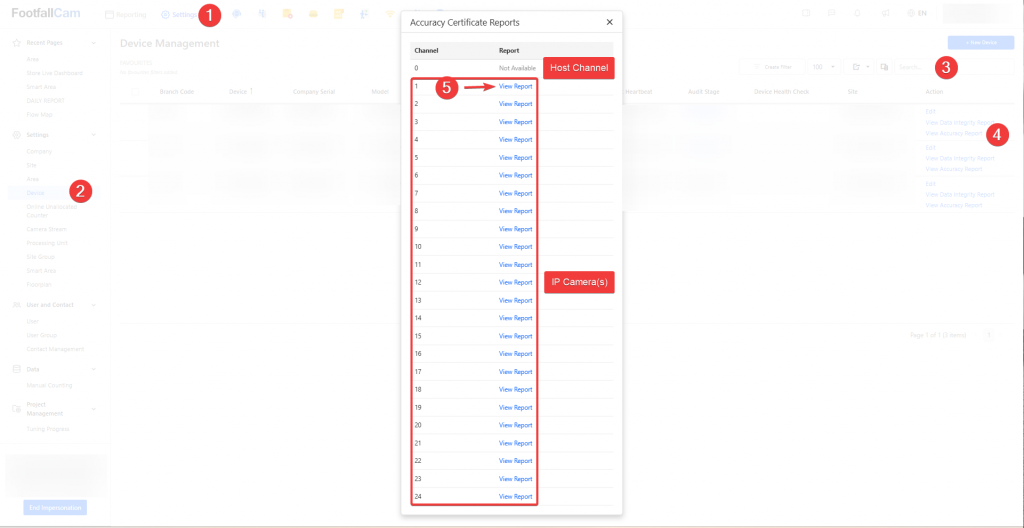
Step 6: Viewing the Details Included in The Certificate Report of the Certified Devices or Channels
After clicking on "View Report", the page will be redirected to the Certificate report that has been included, full details, and video proof(s), will be shown in the report.
Staff Exclusion
The Staff Exclusion Validation Workspace is designed to help users verify and improve the accuracy of staff exclusion within the people counting system.
In many retail environments, employees may tend to move in and out of the store during their shifts. Without proper identification and exclusion, staff movements may be incorrectly counted as shopper traffic, which can significantly distort analytics such as:
- Actual customer footfall in
- Store conversion rates
- Customer traffic trends
This section focuses on how users can validate, benchmark, and confirm that staff members are correctly excluded from shopper traffic counts using annotated images and comparison tools, whilst feeding the model accurate data to improve future predictions.
The system will automatically generate machine-inferred predictions that estimate whether a person entering the store is a staff member or a visitor based on an AI model. However, validation can be done:
- If there are doubts about the accuracy of the machine-inferred results.
- To help improve our future predictions for a specific site by correctly identifying staff and visitors for further model training.
- To understand the different movement trends of customers and visitors in a store.
The process of the Validation Workspace enables users to compare our current machine predictions with ground truth annotations collected from scheduled image campaigns, and users can review differences and determine whether the model is accurately distinguishing staff from visitors via graphs, summaries, and path analysis tools, to name a few.
By analysing this data, users can validate the effectiveness of staff exclusion and improve the reliability of shopper traffic metrics for their store environment.
Overview
Users can use the Overview Section to obtain an overall high-level summary of the number of staff being predicted and excluded when entering the store. This page also provides a visual comparison between machine-inferred predictions and ground truth annotations, allowing users to quickly evaluate model performance and identify discrepancies.
The data is presented through a series of charts and summary panels that highlight:
- Hourly distribution of staff and visitors
- Total visitor and staff predictions in a day
- Differences between machine-inferred results and annotated data
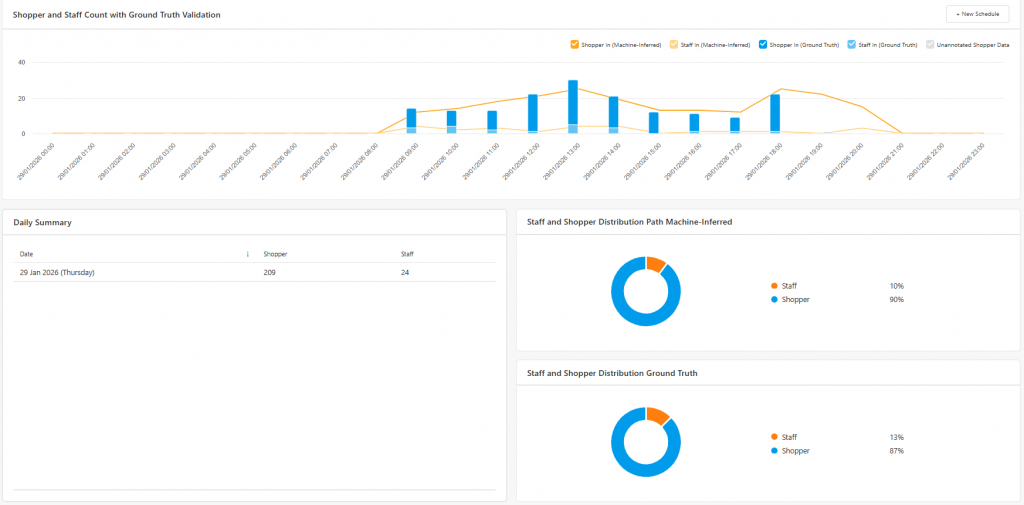
The validation graph compares the number of annotated images (Ground Truth) against the machine-inferred predictions.
This comparison allows users to identify potential differences between:
- Predicted staff counts
- Actual staff counts identified during manual annotation
These differences can be analysed on an hourly basis, helping users determine whether the model consistently misclassifies individuals during certain periods of the day.

Users can also view a daily summary of machine-inferred predictions of the number and trend of the shoppers and staff by selecting a date range, as demonstrated in the picture below. This summary shows the overall trend of predicted staff and visitors.
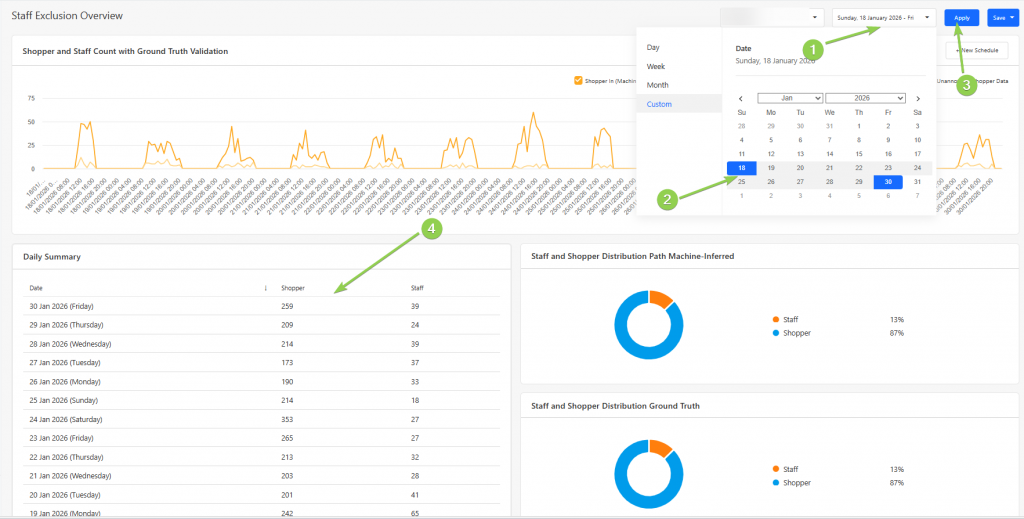
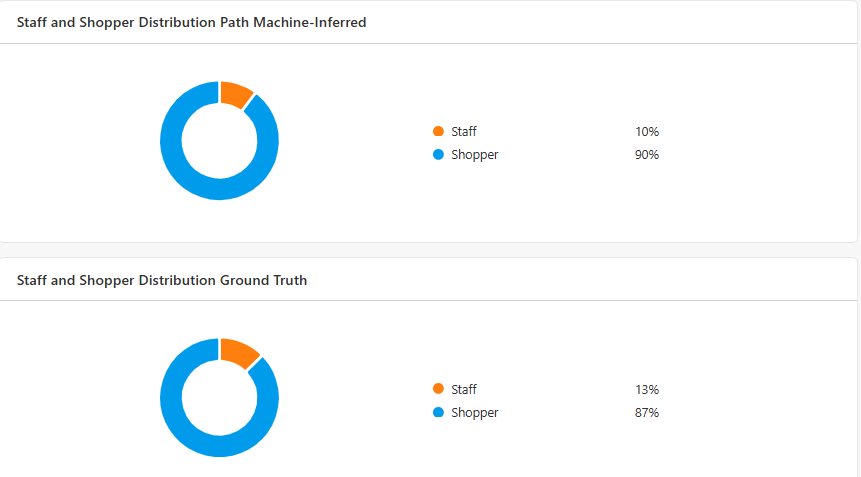
The pie charts provide a quick visual representation of the distribution between staff and visitors based on both machine-inferred predictions and ground truth annotations.
By comparing these distributions, users can quickly determine whether the system's classification performance aligns with the manually validated data, where a discrepancy of 5% is an acceptable difference to take into consideration.
If significant differences exist, further annotation campaigns may be required to retrain the model.
Scheduler
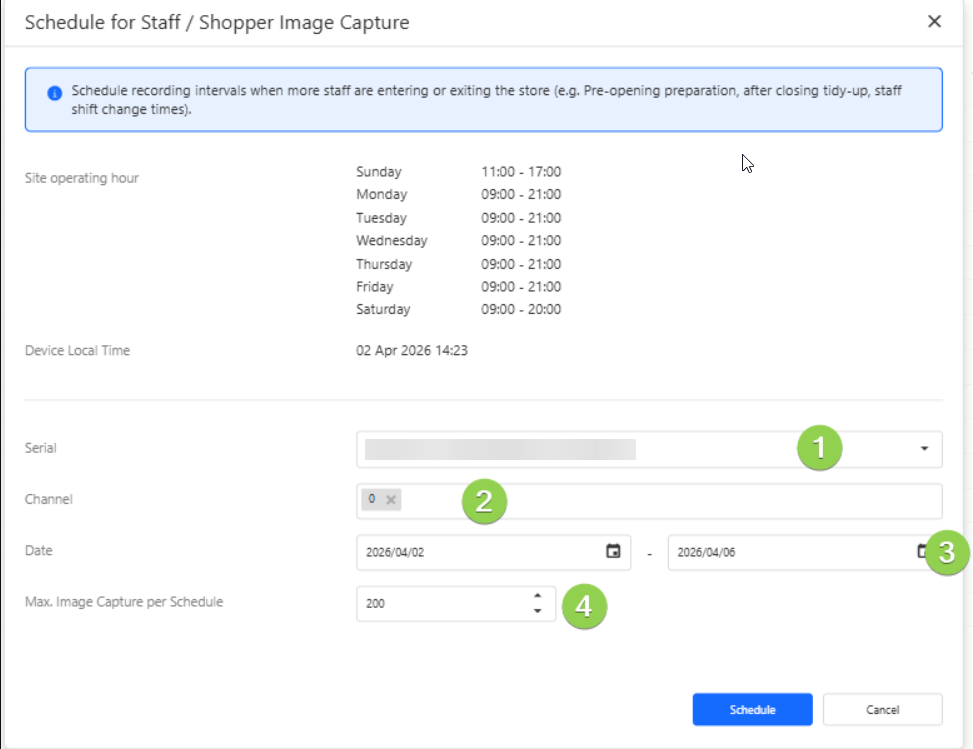
Users can schedule a campaign via the Scheduler Section, where images of each person entering the store at the scheduled hour are captured. To do so, press the "New Schedule" Button.

In order to schedule a campaign, users would need to:
When creating a schedule, users need to
- Device Serial Number - identifies the specific people counting device.
- Channel Number - provides the specific channel(s) needed to be recorded.
- Recording Dates - the day(s) on which the recordings should be performed on.
- Maximum Number of Images - the limit for the total number of images captured during the campaign.
To obtain useful training data, it is recommended to schedule campaigns during periods with a mixture of staff and customer activity, such as:
- Predicted staff counts
- Actual staff counts identified during manual annotation
Once successfully recorded, a list of rows are produced, with a Harvest Status "Pending". To harvest a campaign, or to turn a recording into a list of ready-to-use annotations, select the rows that would need to be harvested and press "Start Harvest" to harvest a single schedule, or "Bulk Harvest" for multiple campaigns.
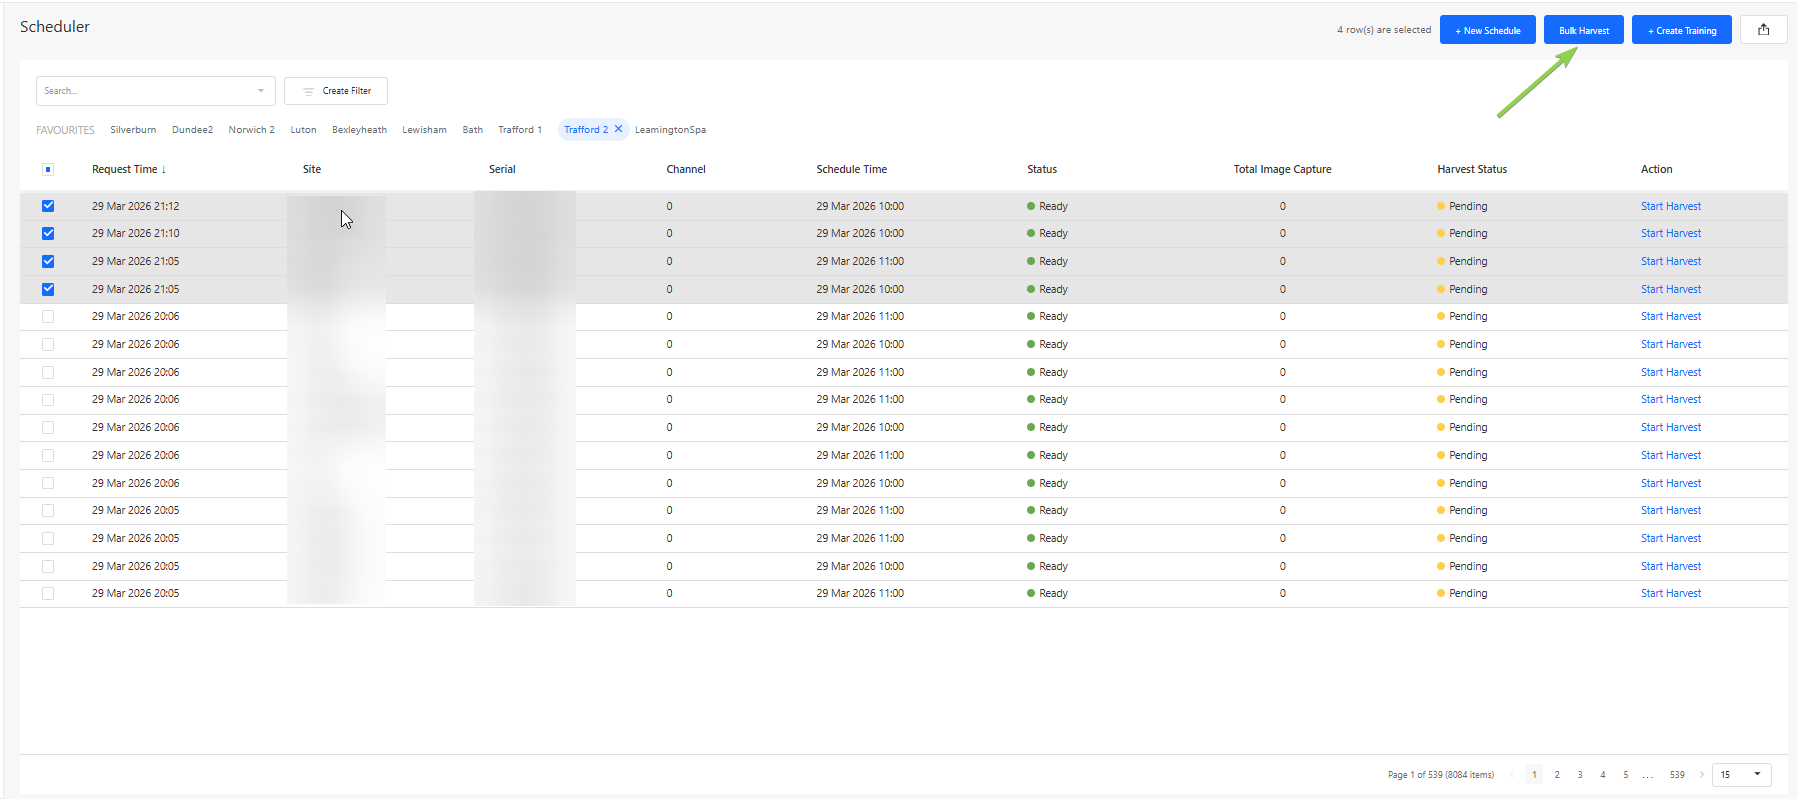
Once harvesting is done, there should be 2 statuses in the "Harvest Status" Column:
- Ready: The row is ready for training creation.
- Failed: The harvesting failed, and is not possible for training creation.
There will be row(s) available for annotation to be done, which can be selected on and begin creating an annotation training dataset by pressing "Create Training"
Training
In the Training Section, users can perform manual annotations on captured images from scheduled campaigns.
These annotations form the ground truth dataset, which is used to validate and improve the machine learning model responsible for identifying staff members.
Each campaign contains a collection of images captured during the scheduled recording window. The number of captured images should generally correspond with the number of detected entries into the store during that time period.
There are several use cases for the training workspace, namely for creating a ground truth to be compared with in the Overview section, or to provide additional training to improve the accuracy of the model.
This retraining of the model would be helpful in several operational scenarios:
- If a store layout changes (e.g., relocating entrances, installing barriers, or modifying checkout areas), movement patterns may change and require revalidation.
- If previously distinct staff uniforms change or staff no longer wear identifiable clothing, the system may require retraining to maintain classification accuracy.
To begin annotating a campaign, users can click the "Annotate" button.

The goal of the annotation process is to classify each captured individual as one of the following:
- Staff Member
- Visitor
- Disqualified Image
These labels allow the system to classify and then train the model via visual and behavioural features that are associated with staff members and visitors.
How to Perform Annotations
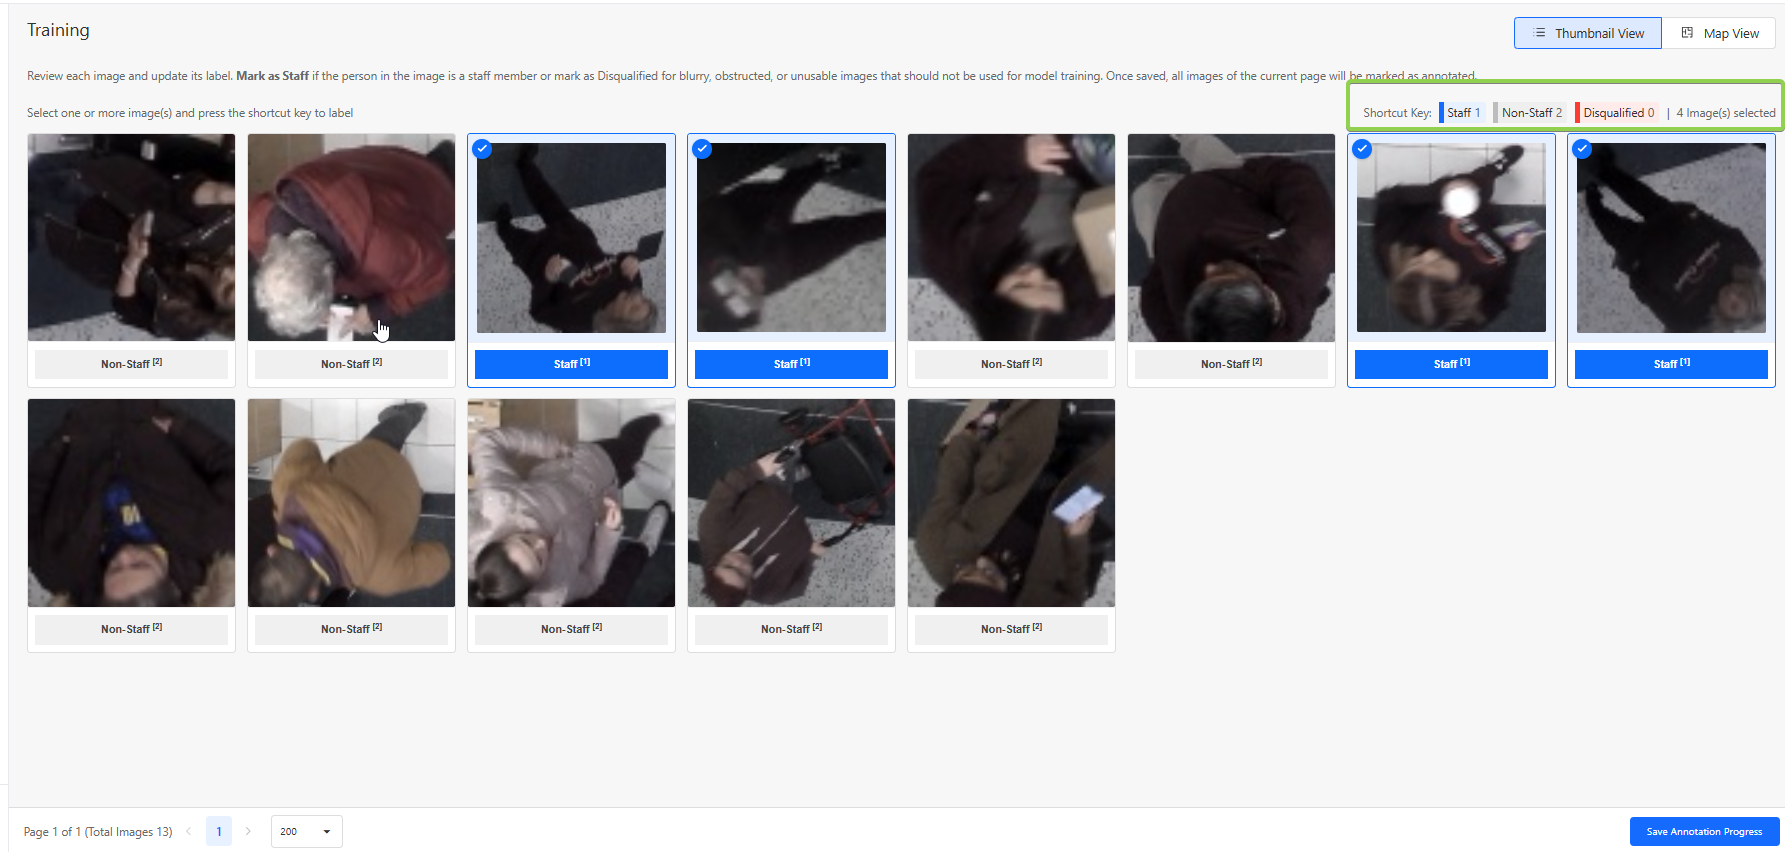
Users can annotate on a campaign by identifying and annotating the images captured as a staff member or a visitor.
If the image shows a staff member, select all of the staff images and press the "1" button.
If the image shows a visitor, no action is required, as visitors are considered the default category. However, if you wish to change the status from "staff" or "disqualified", select all relevant images and press the "2" button.
Disqualified Images
Some captured images may not be suitable for model training. These should be marked as Disqualified, by selecting all disqualified images and selecting "q"
Examples include:
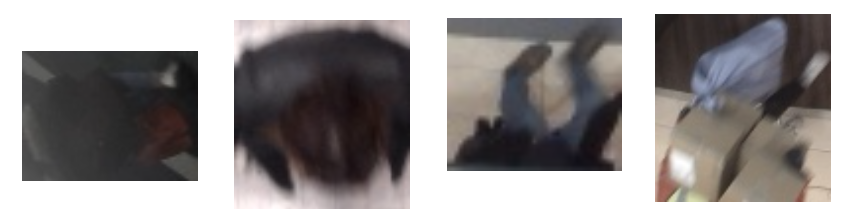
- Extremely blurry images
- Images where the person is extremely obstructed
- Images where the person cannot be clearly identified
- Images where the image is falsely captured as a human
- Images with extreme lighting conditions
Below are some examples of images that are likely to be disqualified:
Using the Map View
For additional context, users may click on a selected image and open the Map View.
The Map View displays:
- The movement path of the detected individual
- Up to three images captured during different moments of the same trajectory
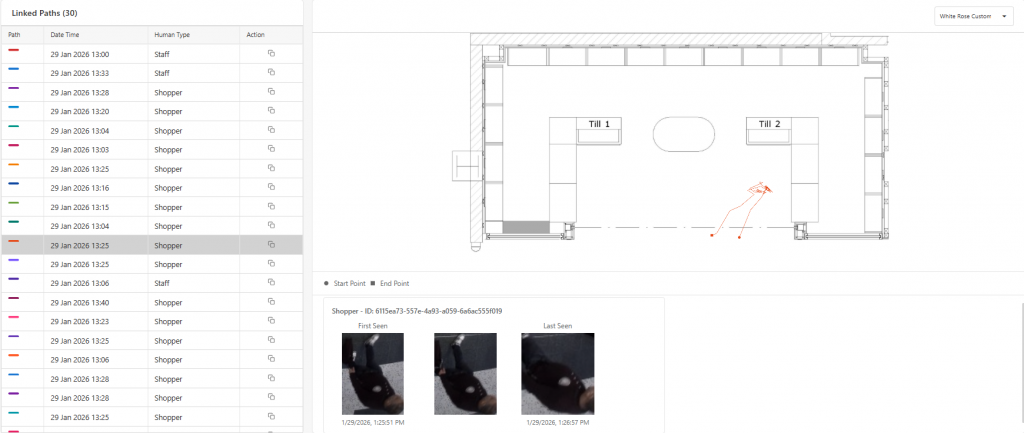
By observing these movement patterns, users can make more accurate annotations.
Annotation Status
Once annotation is completed, the user can click on "Save Annotation Progress", and an option to change the stage to 3 different categories can be made.
These statuses are:
- In Progress: The campaign annotation is partially completed or requires further review.
- Completed: All images in the campaign have been successfully annotated and are ready for training.
- Not Useful: The campaign data is unsuitable for model training (e.g., poor image quality or incorrect scheduling).
Risk Map
The Risk Map Section allows users to analyse movement behaviour and spatial patterns derived from the annotated data.
Using this data, the system generates visualisations that help users compare how staff and visitors move within the store environment.
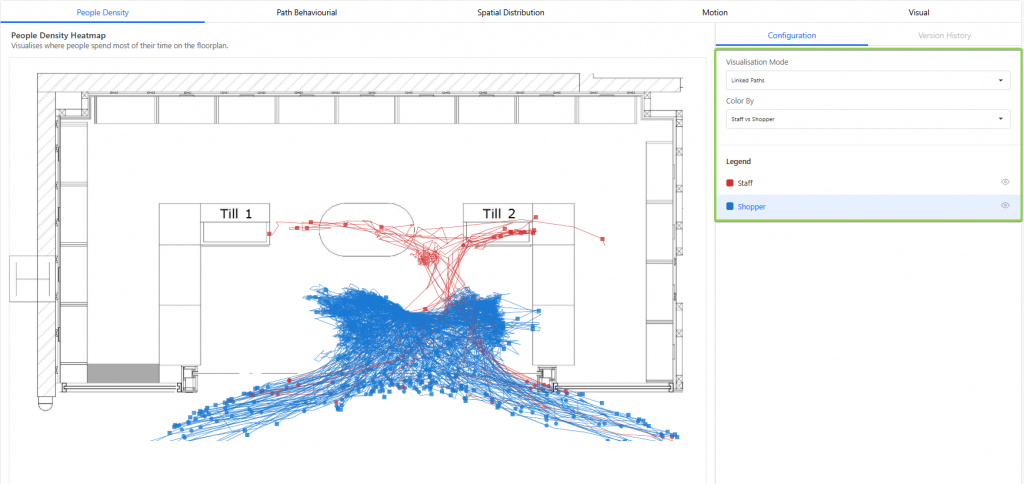
Two main visualisation modes are available:
- Heat Map: Highlight areas with high movement or dwell density.
- Linked Paths: Allows for viewing of each individual path taken by a person.
Users can toggle between staff-only data and visitor-only data to observe behavioural differences.
Analytical Tabs
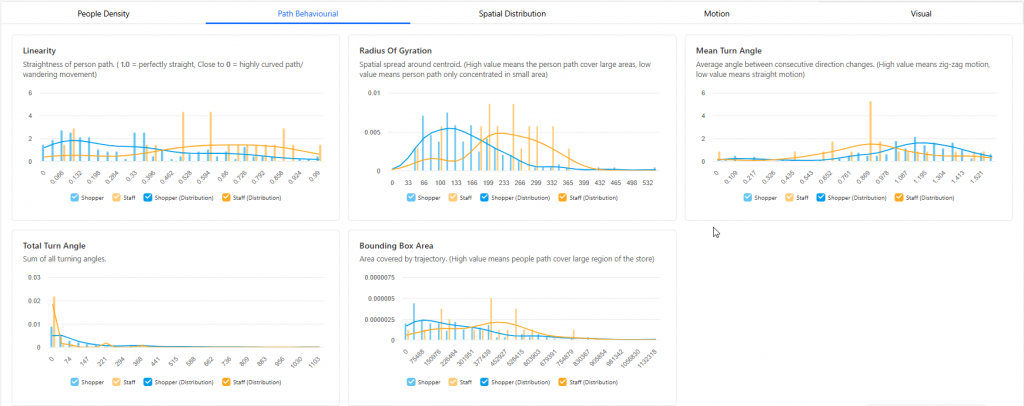
Several other tabs also allow for the comparison of data between staff and visitors, which can be accessed via the 4 tabs:
- Path Behavioural: Data being derived from overall movement patterns to understand how individuals navigate and interact with a space.
- Spatial Distribution: Where movement is primarily located within the space by capturing the average position and the furthest points reached along both the X and Y directions.
- Motion: Data derived from how fast and consistently a person moves, including their overall speed, peak speed, speed variability, and total time spent being tracked.
- Visual: Determine the type of person entering the store based on visual cues.
Staff Validation
The goal of the validation process is to ensure that the model that was previously trained is accurate and produced optimum results. Similar to the staff annotation page, there are 2 different classes of validation, which are:
- Staff Member
- Visitor
However, these classes are already organised according to the model's inferred results, and it is the annotator's job to do a 'cross check' to see if they are indeed in the right categories, hence the term validation.
How to Perform Validations
The validation page presents the classification results for the two classes, together with the corresponding input images and prediction confidence scores. A prediction score greater than 50% indicates that the input image is classified as the "staff" class, whereas a prediction score of less than 50% or below indicates classification into the "visitor" class.
The prediction score also provides an indication of the model's confidence in its classification. Scores that deviate further from the 50% threshold represent greater confidence in the predicted class, while scores closer to 50% indicate greater uncertainty in the classification.
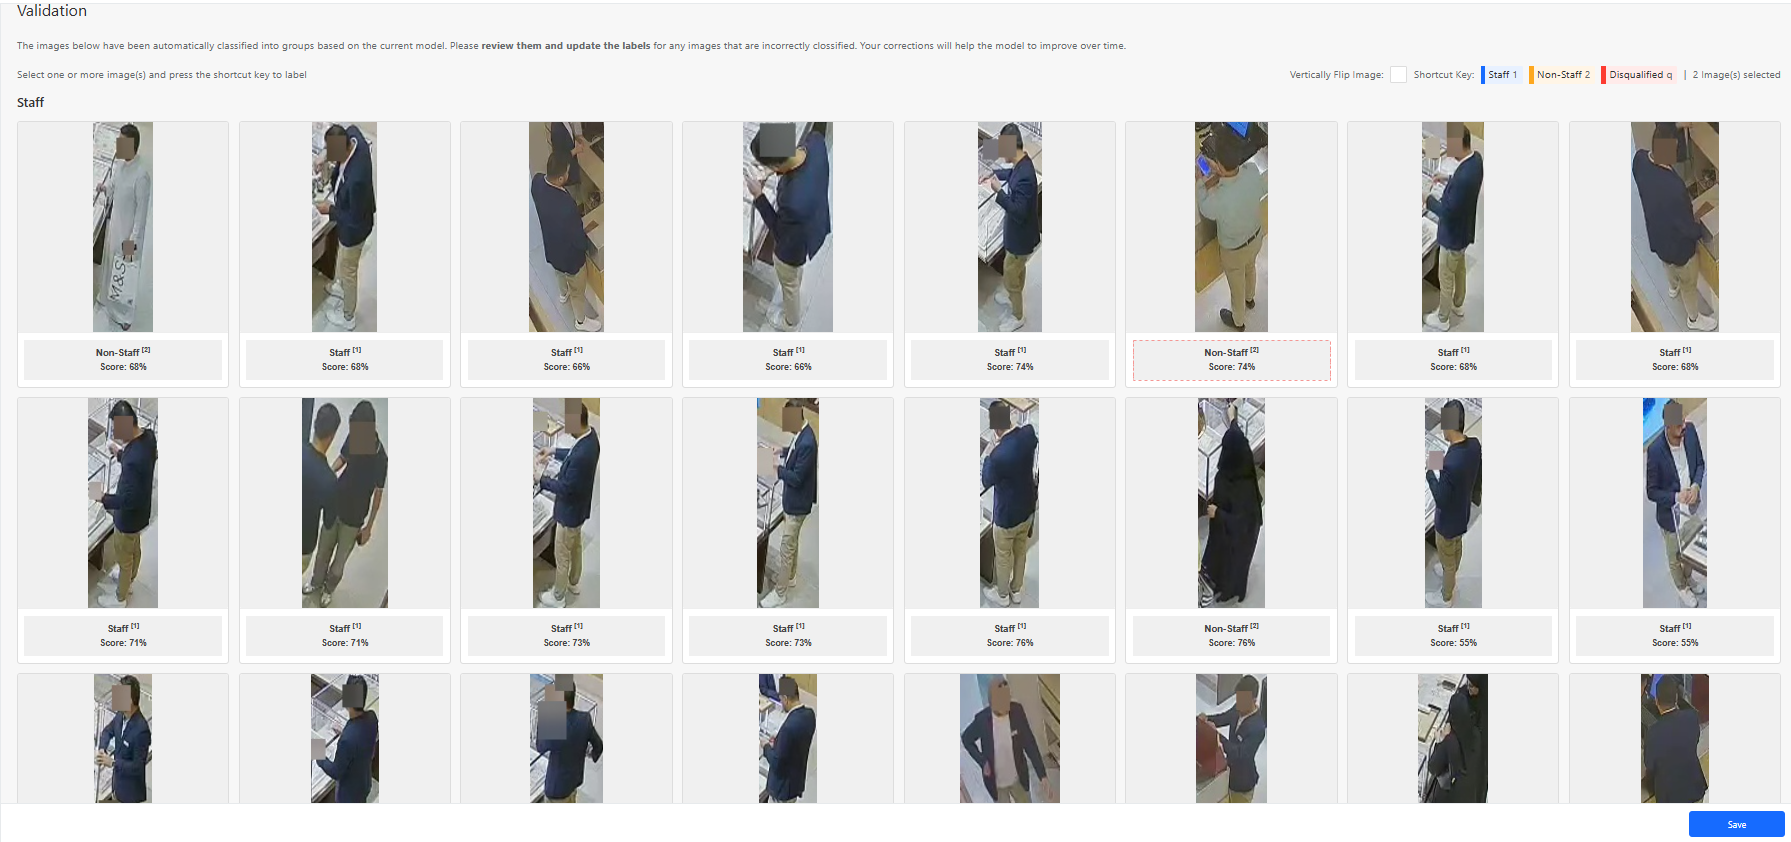
Users can validate images within a campaign by reviewing the captured images and assigning the appropriate class labels. If an image depicts a staff member, the user should select all relevant staff images and press the "1" key. If an image depicts a visitor, the user should select all relevant visitor images and press the "2" key.
Some captured images may be unsuitable for use in model training. These images should be marked as Disqualified by selecting the relevant images and pressing the "q" key. Examples of images that should be disqualified are provided in the "Disqualified Images" subsection of Section 2.3.1. Disqualified images are excluded from the model training and are therefore not considered when evaluating the model's accuracy.
If an image has been assigned an incorrect class and its status needs to be changed, the user can select the relevant image(s) and assign the appropriate class by selecting the corresponding class. The validation page will be updated accordingly, as illustrated in the figure below.
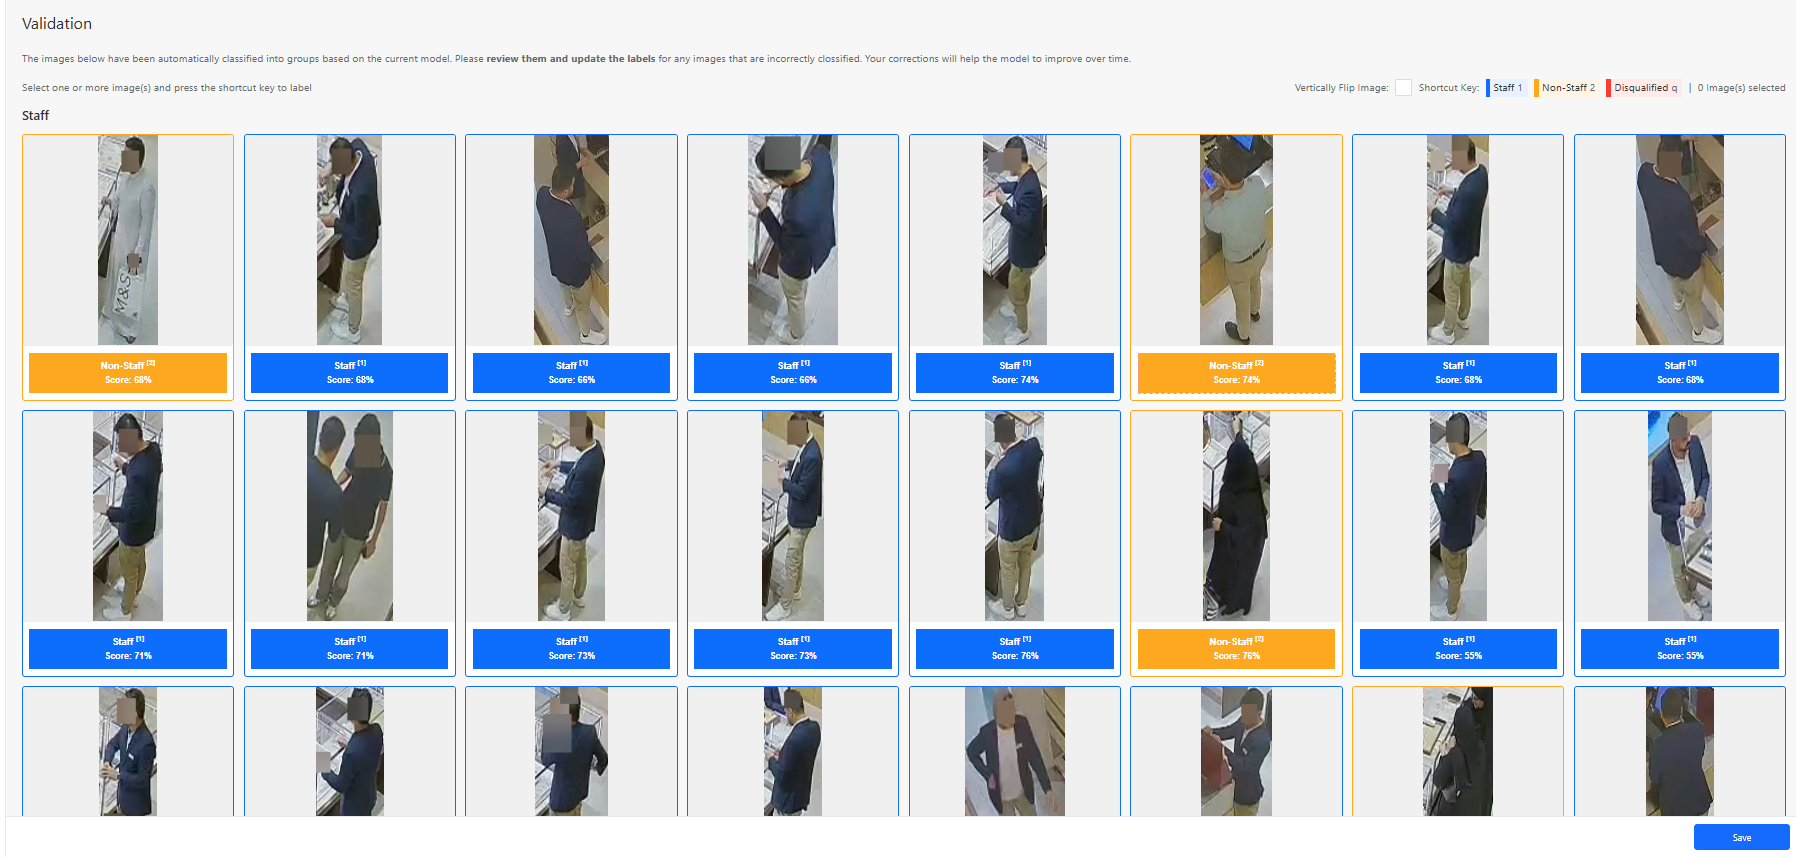
This validation process allows users to verify whether the model's predictions are correct by comparing the predicted classifications against the manually assigned labels. The resulting validation data can then be used to assess whether the model is performing at an acceptable standard or whether further configuration, validation, or model training is required.
Demographic
Gender Classification
The Gender Validation Workspace is designed to help users verify and improve the accuracy of the Gender Classification within the people counting system.
In many retail environments, people are always moving in and out of the store during operating hours. Without proper identification, the gender distribution may be incorrectly counted, which can significantly distort analytics such as:
- Gender Distribution
- Demographic trends
This section focuses on how users can validate, benchmark, and confirm the overall gender distribution of an area using annotated images and comparison tools, whilst feeding the model accurate data to improve future predictions.
The system will automatically generate machine-inferred predictions that estimate whether a person entering the store is a Female or Male based on an AI model. However, validation can be done:
- If there are doubts about the accuracy of the machine-inferred results.
- To help improve our future predictions for a specific site and can be replicated and reused for multiple sites of the same company by correctly identifying a person's gender, used for further model training.
The process of the Validation Workspace enables users to compare our current machine predictions with ground truth annotations collected from scheduled image campaigns, and users can review differences and determine whether the model is accurately predicting the right gender of a person. The workspace mainly visualises the data through the overview graph that compares both machine inferred and ground truth annotation.
By analysing this data, users can validate the effectiveness of the AI model and improve the reliability of gender data for their store environment.
Overview
Users can use the Overview Section to obtain an overall high-level summary of the number of either Female or Male being predicted when people enter the store. This page also provides a visual comparison between machine-inferred predictions and ground truth annotations, allowing users to quickly evaluate model performance and identify discrepancies.
The data is presented through a series of charts and summary panels that highlight:
- Hourly distribution of each gender category, comparing both machine-inferred predictions and ground truth annotations
- Daily summary of each gender category
- Hourly summary for each gender category
- Distribution of Machine-Inferred
- Distribution of Ground Truth Annotations
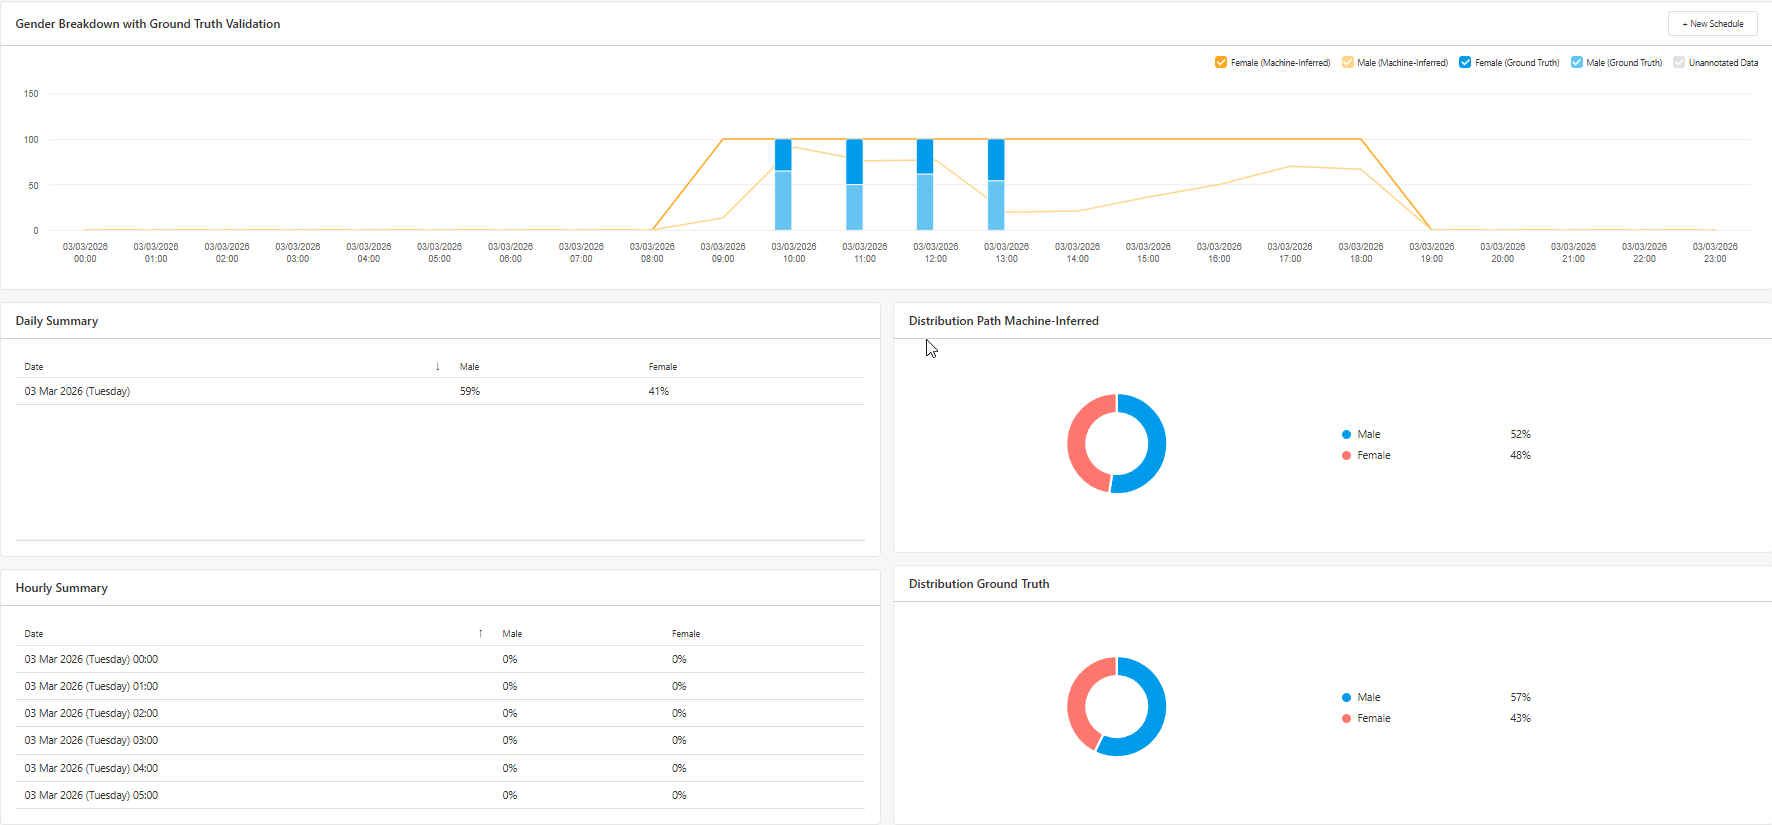
The validation graph compares the number of annotated images (Ground Truth) against the machine-inferred predictions.
This comparison allows users to identify potential differences between:
- Predicted gender category
- Actual people in each gender category identified during manual annotation
These differences can be analysed on an hourly basis, helping users determine whether the model consistently misclassifies individuals during certain periods of the day.
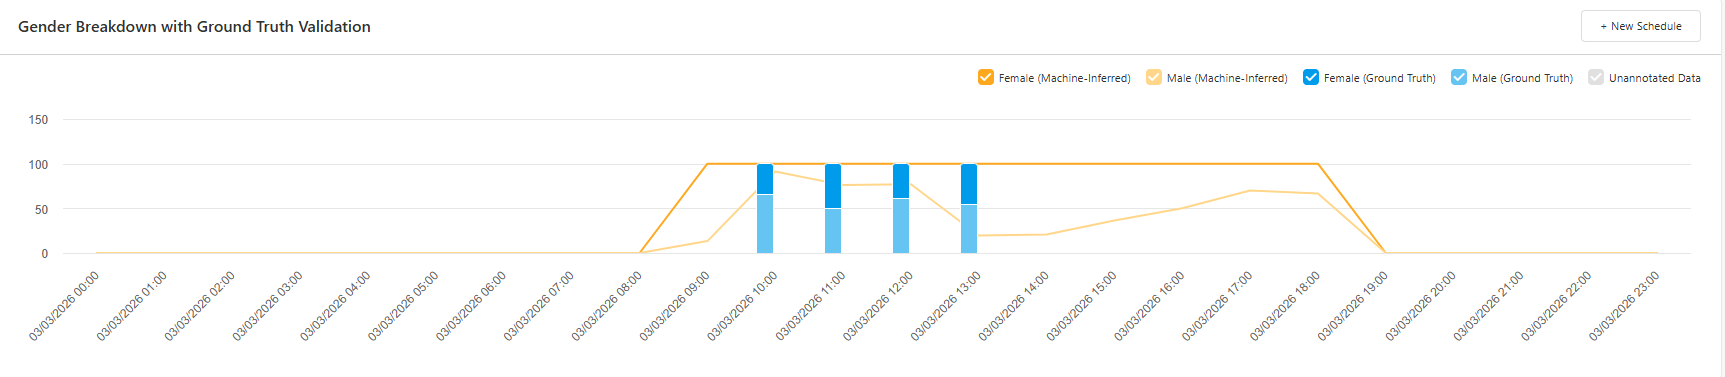
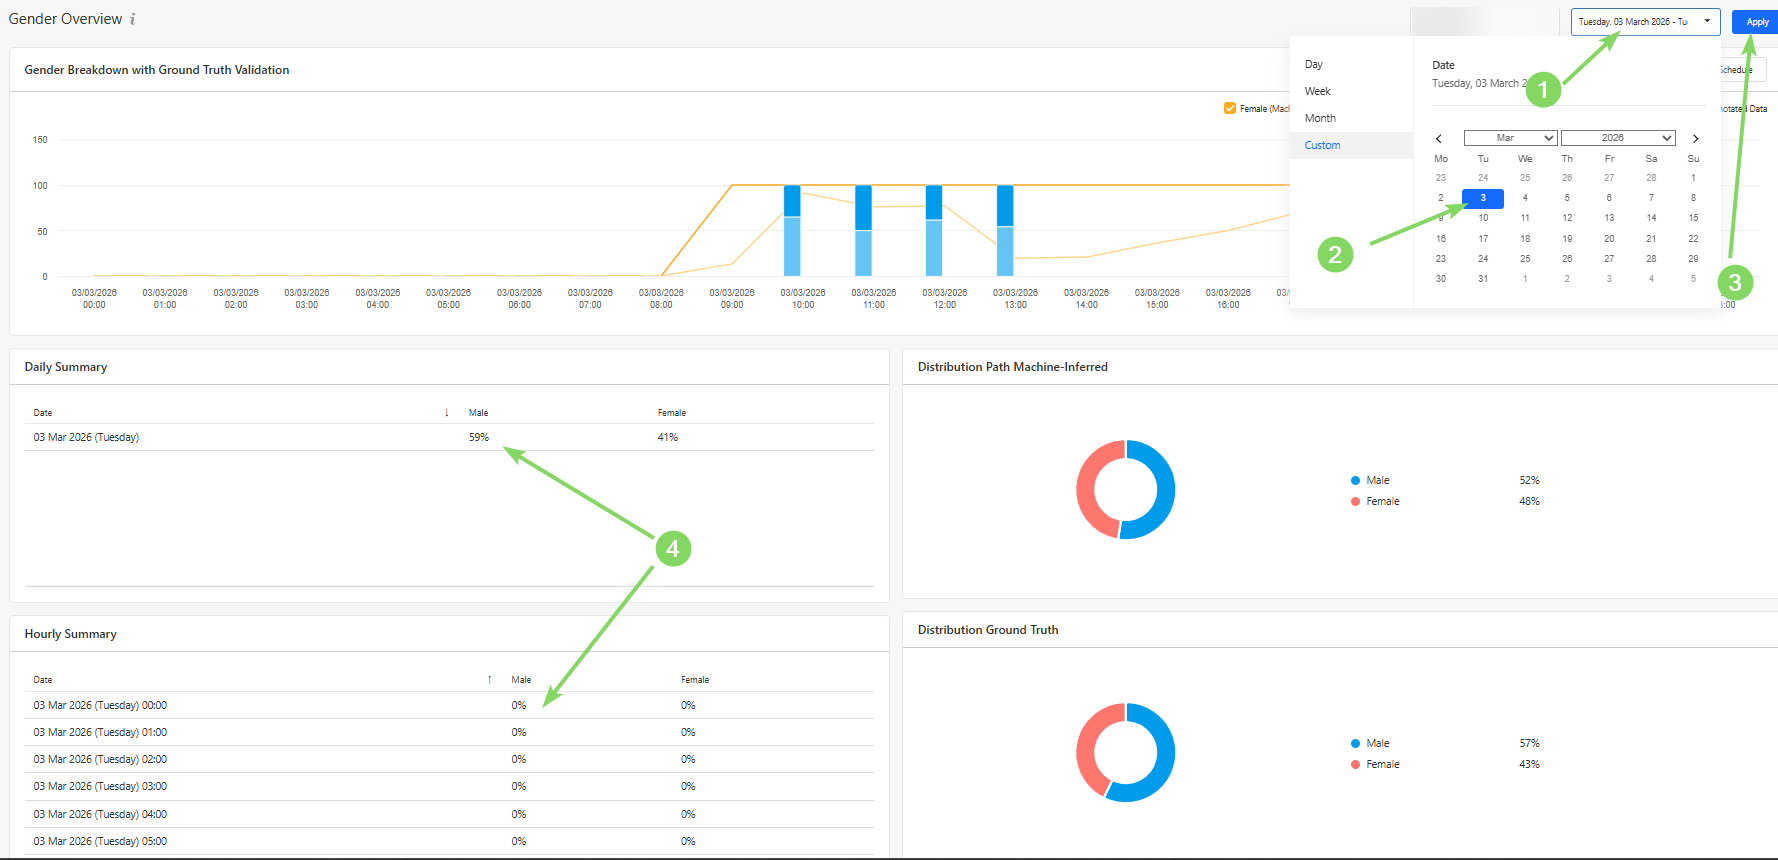
Users can also view a daily summary of machine-inferred predictions of the number and trend of each gender category by selecting a date range, as demonstrated in the picture below. This summary shows the overall trend of the predicated gender category of each person
The pie charts provide a quick visual representation of the distribution between each gender category based on both machine-inferred predictions and ground truth annotations.
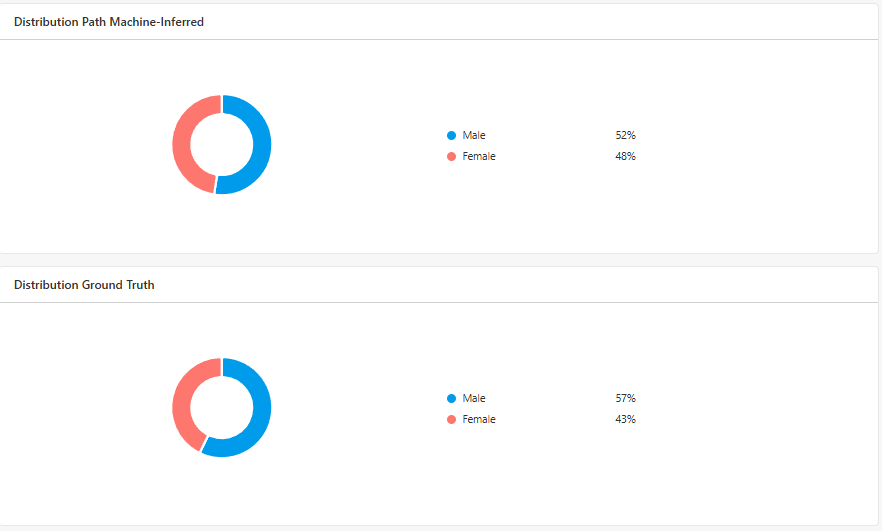
By comparing these distributions, users can quickly determine whether the system's classification performance aligns with the manually validated data, where a discrepancy of 5% is an acceptable difference to take into consideration.
If significant differences exist, further annotation campaigns may be required to retrain the model.
Scheduler
Users can schedule a campaign via the Scheduler Section, where images of each person entering the store at the scheduled hour are captured. To do so, press the "New Schedule" Button.
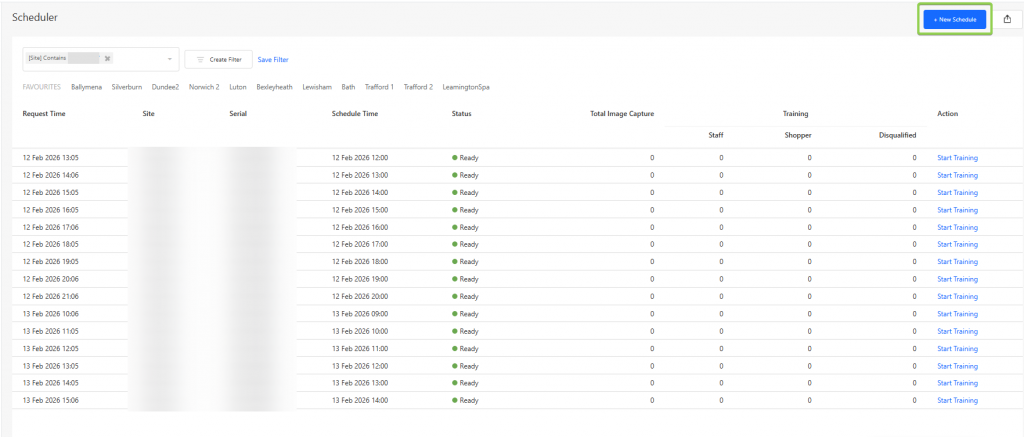
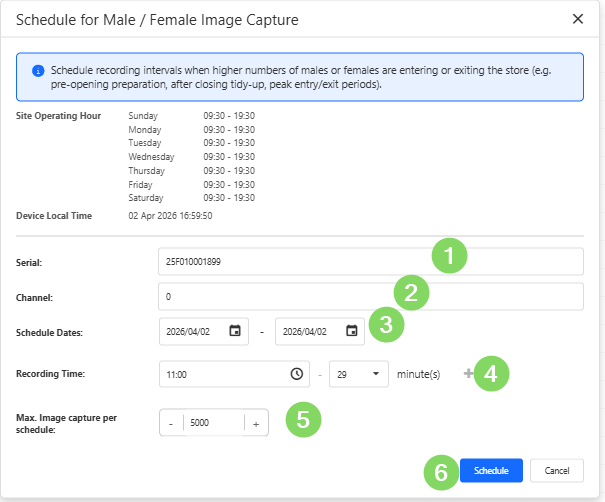
In order to schedule a campaign, users would need to:
When creating a schedule, users need to
- Device Serial Number - identifies the specific people counting device.
- Channel - the device channel of which you want to record for.
- Recording Dates - the day(s) on which the recordings should be performed on.
- Recording Time Window - the hours during which images should be captured.
- Maximum Number of Images - the limit for the total number of images captured during the campaign.
To obtain useful training data, it is recommended to schedule campaigns during periods with a mixture of both gender activities.
Once successfully recorded, the annotate button may be pressed to begin harvesting into a training campaign.
Training
In the Training Section, users can perform manual annotations on captured images from scheduled campaigns.
These annotations form the ground truth dataset, which is used to validate and improve the machine learning model responsible for identifying which gender category a person is part of.
Each campaign contains a collection of images captured during the scheduled recording window. The number of captured images should generally correspond with the number of detected entries into the store during that time period.
There are several use cases for the training workspace, namely for creating a ground truth to be compared with in the Overview section, or to provide additional training to improve the accuracy of the model.
This retraining of the model would be helpful if a store has a varied gender distribution and the current machine-inferred results do not match the ground truth annotations. The system may require retraining to maintain classification accuracy.
To begin annotating a campaign, users can click the "Annotate" button.
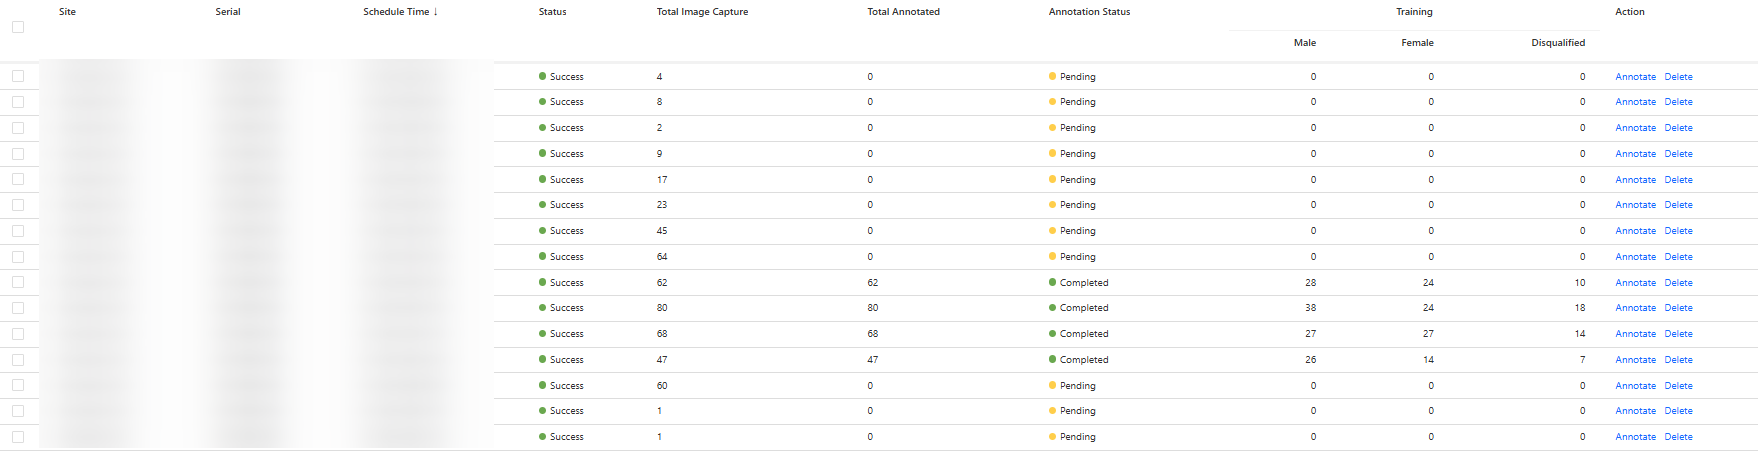
The goal of the annotation process is to classify each captured individual as one of the following:
- Female
- Male
- Disqualified Image
These labels allow the system to classify and then train the model via visual and behavioural features that are associated with the two gender categories
How to Perform Annotations
Users can annotate on a campaign by identifying and annotating the images captured as the above listed classifications
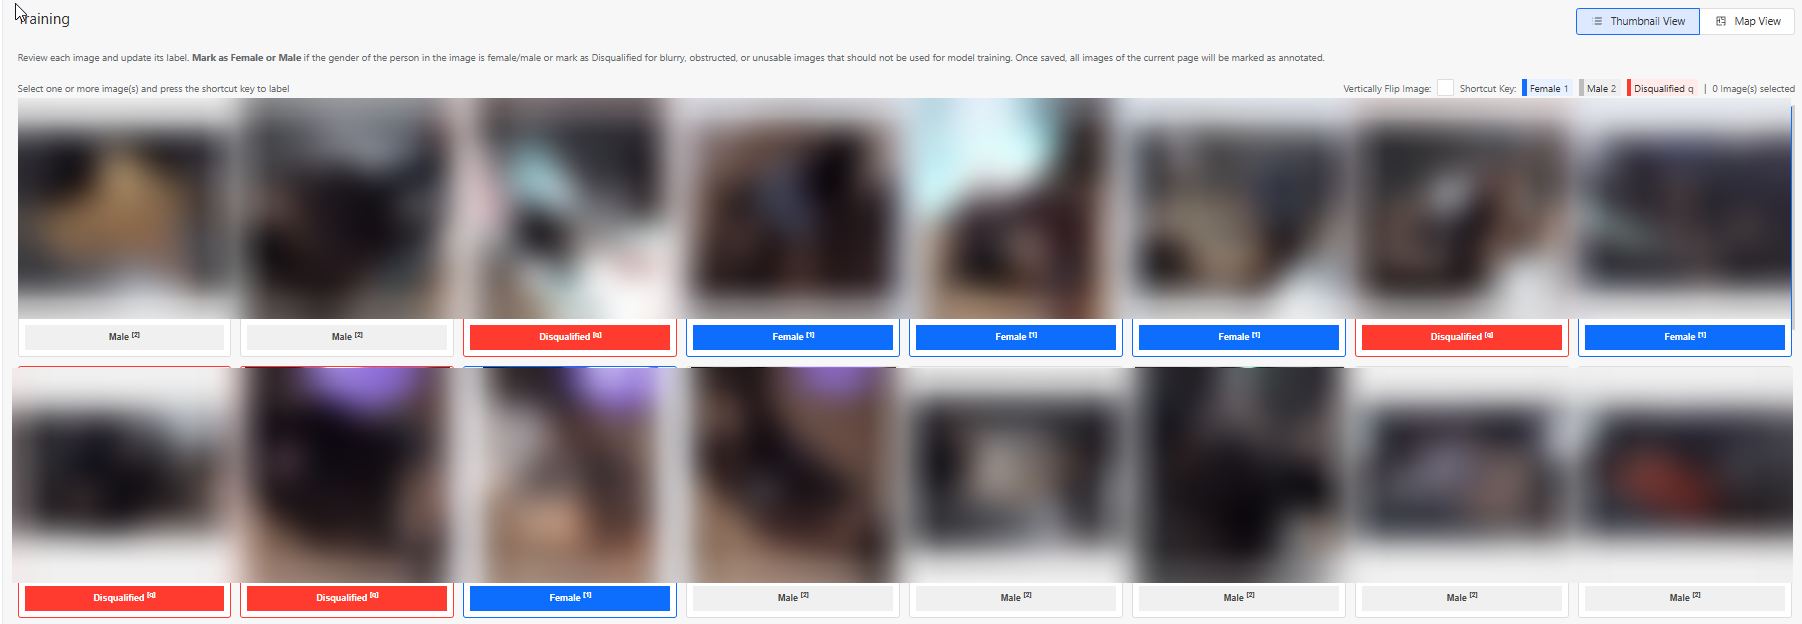
If the image shows a Female, select all of the supposed Male images and press the "1" button or click on "Female" on the top right.
If the image shows a Male, no action is required, as Male is the default category. However, if you wish to change the status from "Male" to "disqualified", select all relevant images and press the "q" button.
Disqualified Images
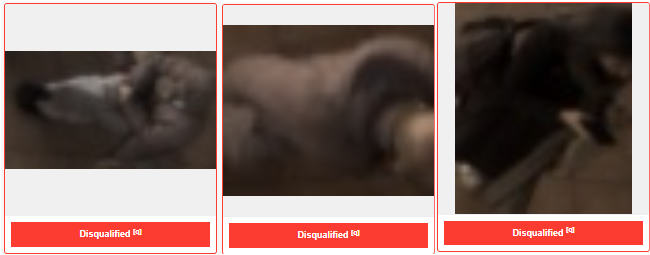
Some captured images may not be suitable for model training. These should be marked as Disqualified, by selecting all disqualified images and selecting "q"
Examples include:
- Extremely blurry images
- Images where the person is extremely obstructed
- Images where the person cannot be clearly identified
- Images where the image is falsely captured as a human
- Images with extreme lighting conditions
Below are some examples of images that are likely to be disqualified:
Using the Map View
For additional context, users may click on a selected image and open the Map View.
The Map View displays:
- Up to three images captured during different moments of the same trajectory
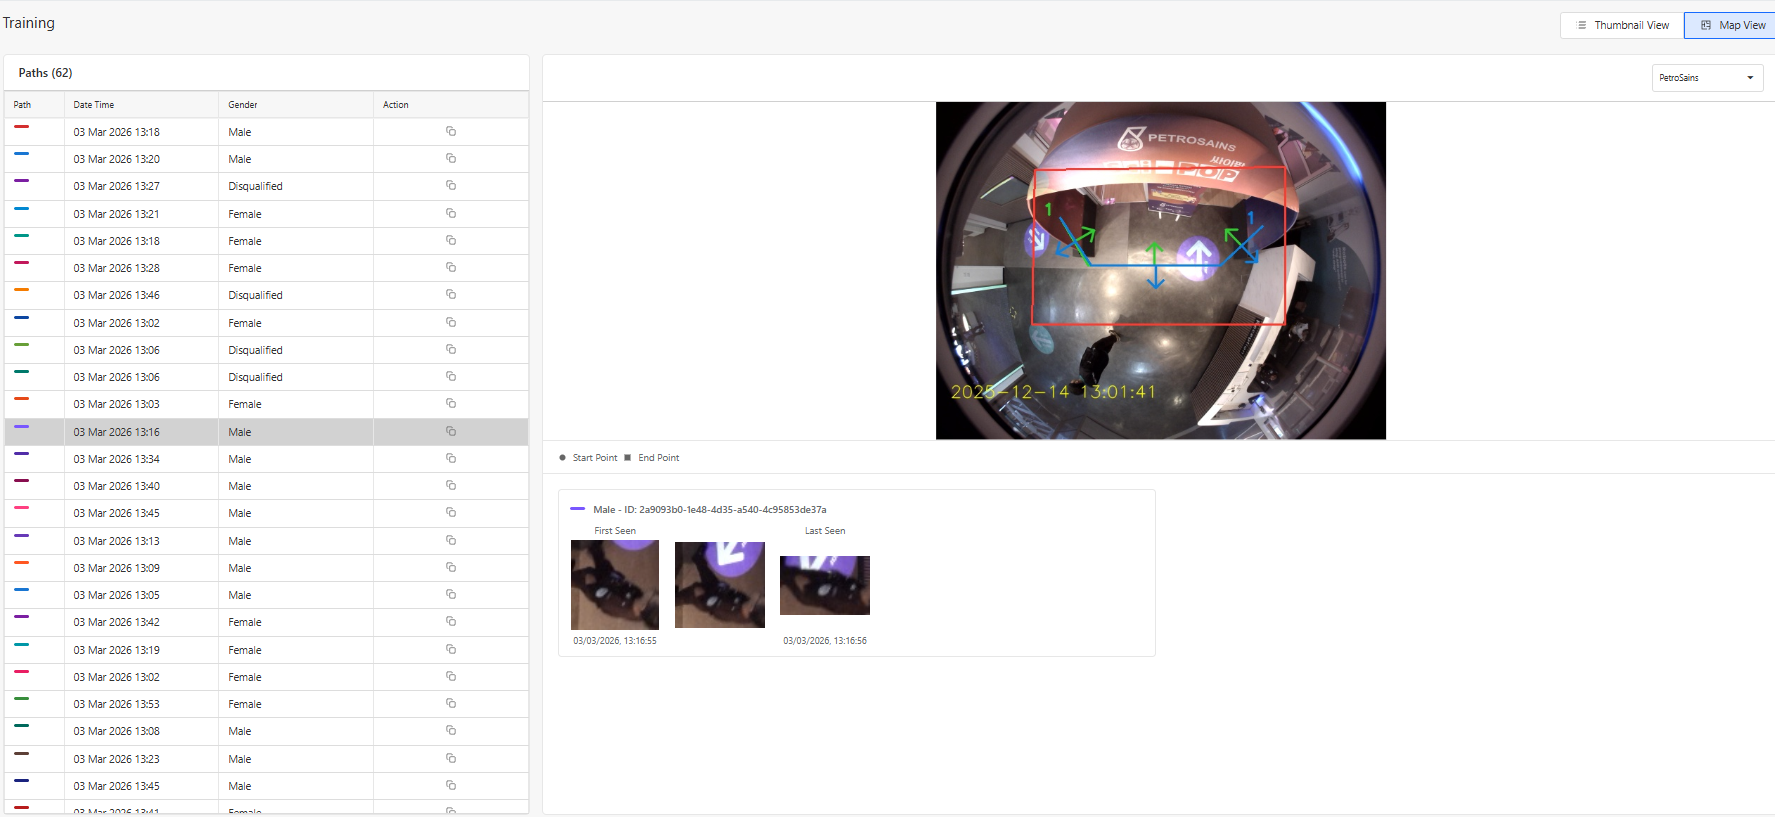
By observing these movement patterns, users can make more accurate annotations.
Annotation Status
Once annotation is completed, the user can click on "Save Annotation Progress", and an option to change the stage to 3 different categories can be made.
These statuses are:
- In Progress: The campaign annotation is partially completed or requires further review.
- Completed: All images in the campaign have been successfully annotated and are ready for training.
- Not Useful: The campaign data is unsuitable for model training (e.g., poor image quality or incorrect scheduling).
Age Classification
The Age Validation Workspace is designed to help users verify and improve the accuracy of the Age Classification within the people counting system.
In many retail environments, people are always moving in and out of the store during operating hours. Without proper identification, the age distribution may be incorrectly counted, which can significantly distort analytics such as:
- Age Distribution
- Demographic trends
This section focuses on how users can validate, benchmark, and confirm the overall age distribution of an area using annotated images and comparison tools, whilst feeding the model accurate data to improve future predictions.
The system will automatically generate machine-inferred predictions that estimate whether a person entering the store is from the "Children", "Teenager", "Adults" or the "Elderly" category on an AI model. However, validation can be done:
- If there are doubts about the accuracy of the machine-inferred results.
- To help improve our future predictions for a specific site and can be replicated and reused for multiple sites of the same company by correctly identifying a person's age category, used for further model training.
The process of the Validation Workspace enables users to compare our current machine predictions with ground truth annotations collected from scheduled image campaigns, and users can review differences and determine whether the model is accurately predicting the age category of each person. The workspace mainly visualises the data through the overview graph that compares both machine inferred and ground truth annotation.
By analysing this data, users can validate the effectiveness of the AI model and improve the reliability of age data for their store environment.
Overview
Users can use the Overview Section to obtain an overall high-level summary of the number of each age category being predicted when people enter the store. This page also provides a visual comparison between machine-inferred predictions and ground truth annotations, allowing users to quickly evaluate model performance and identify discrepancies.
The data is presented through a series of charts and summary panels that highlight:
- Hourly distribution of each age category, comparing both machine-inferred predictions and ground truth annotations.
- Daily summary of each age category.
- Hourly summary of each age category
- Distribution of Machine-Inferred
- Distribution of Ground Truth Annotations
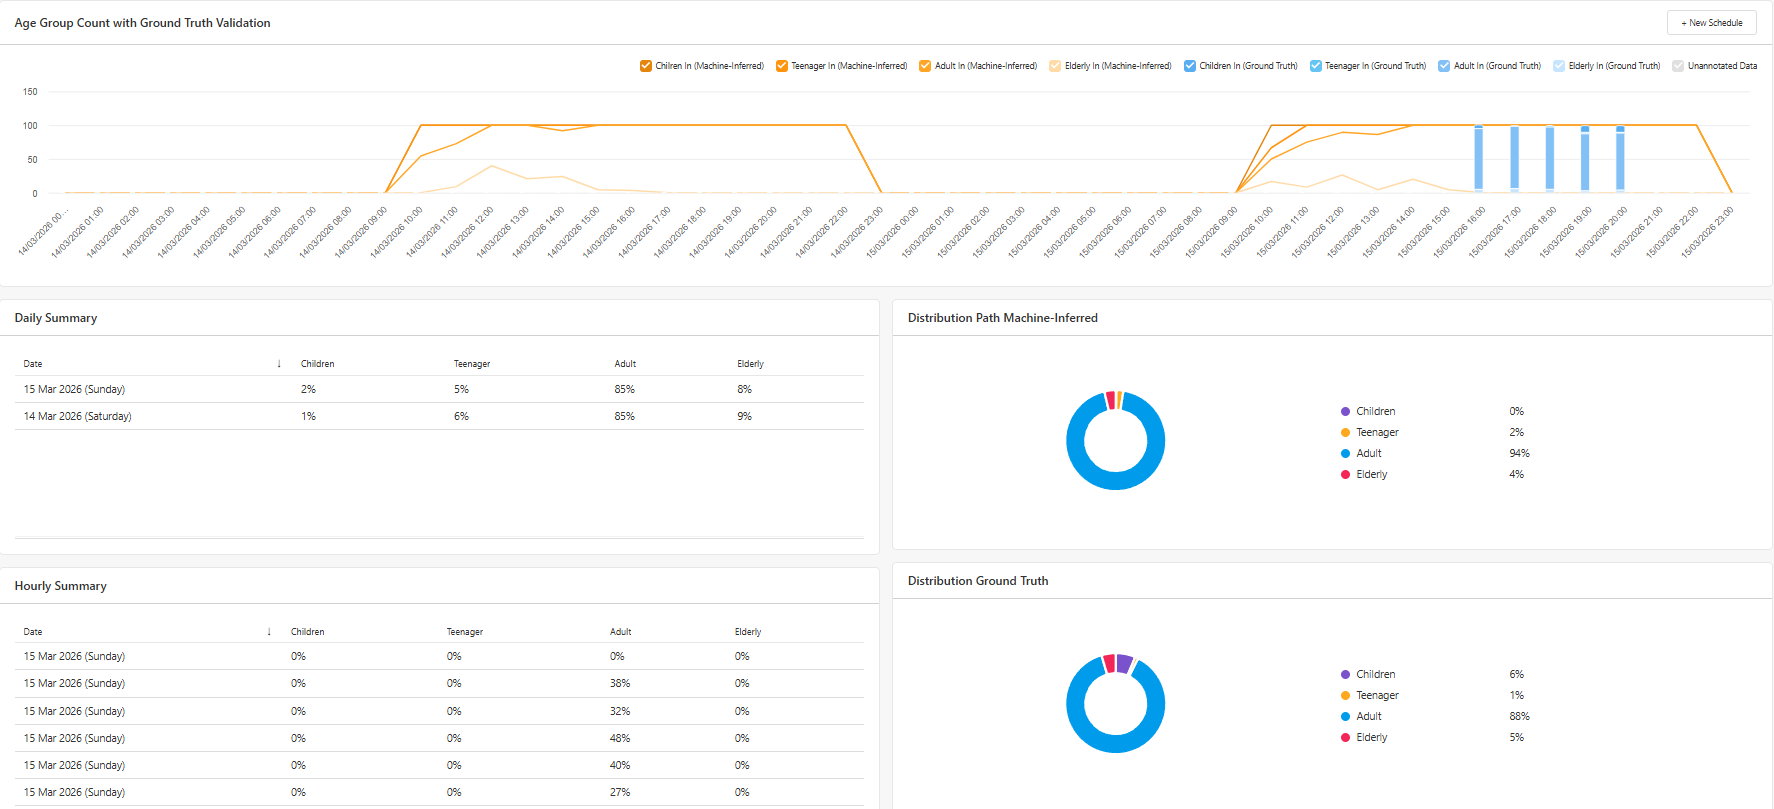
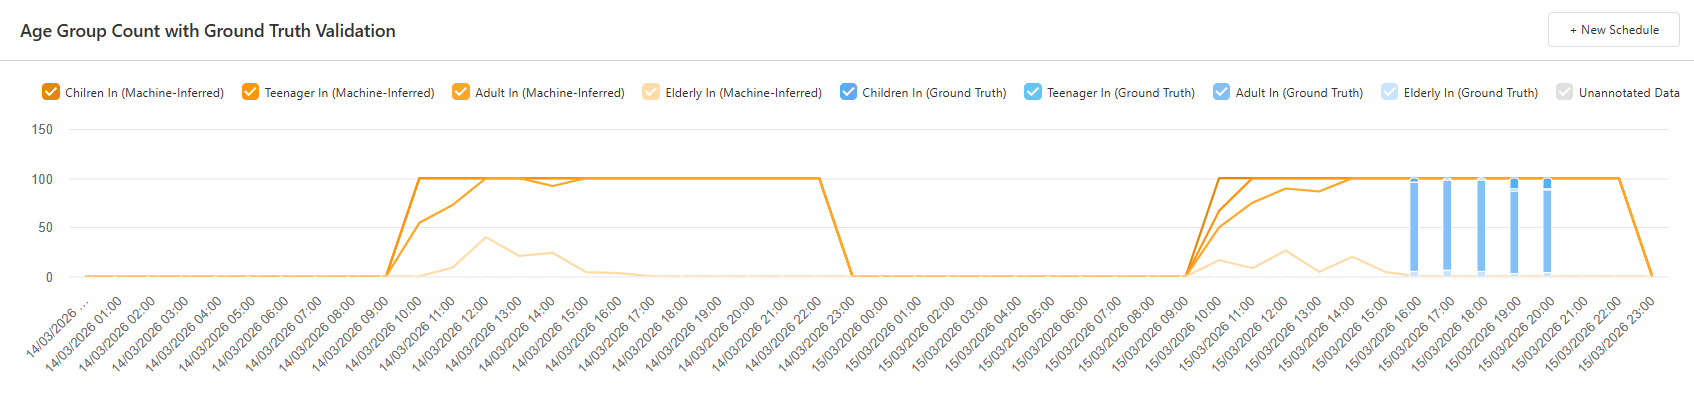
The validation graph compares the number of annotated images (Ground Truth) against the machine-inferred predictions.
This comparison allows users to identify potential differences between:
- Predicted age category
- Actual people in each age category identified during manual annotation
These differences can be analysed on an hourly basis, helping users determine whether the model consistently misclassifies individuals during certain periods of the day.
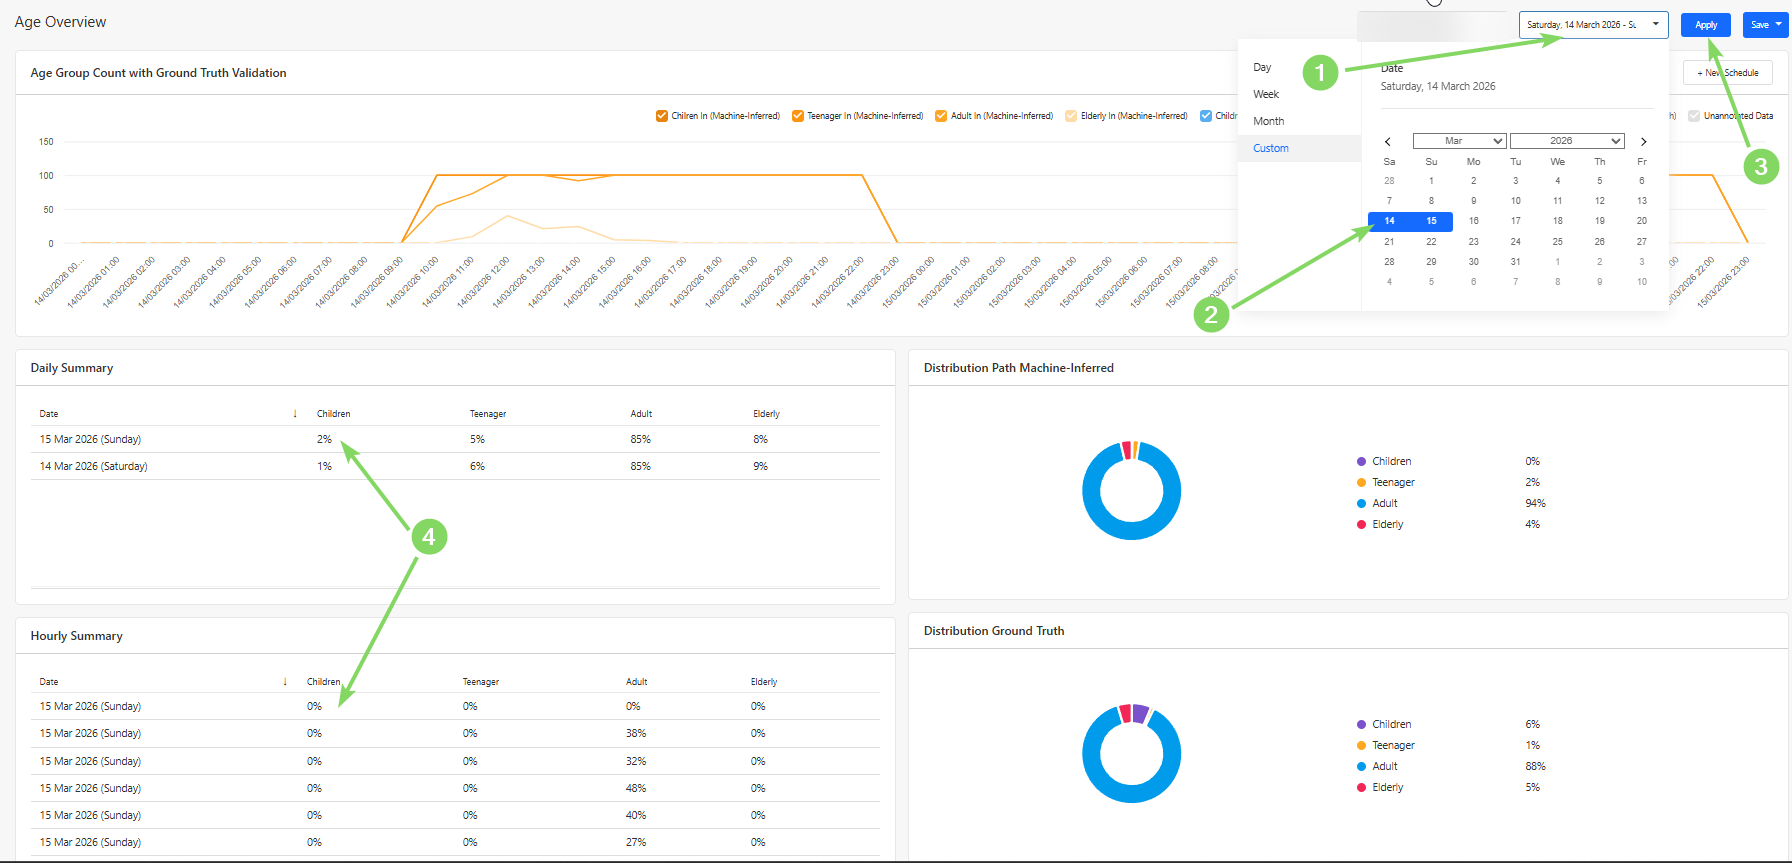
Users can also view a daily summary of machine-inferred predictions of the number and trend of each age category by selecting a date range, as demonstrated in the picture below. This summary shows the overall trend of the predicted age category of each person.
The pie charts provide a quick visual representation of the distribution between each age category based on both machine-inferred predictions and ground truth annotations.
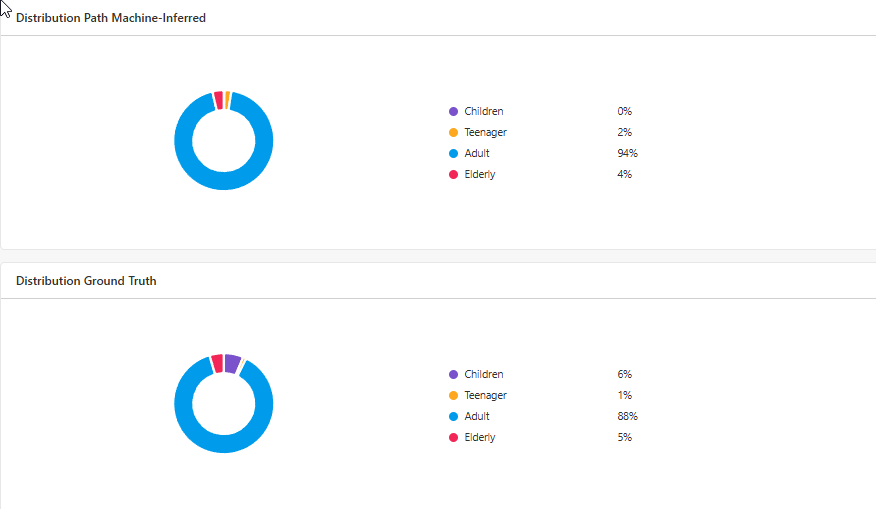
By comparing these distributions, users can quickly determine whether the system's classification performance aligns with the manually validated data, where a discrepancy of 5% is an acceptable difference to take into consideration.
If significant differences exist, further annotation campaigns may be required to retrain the model.
Scheduler
Users can schedule a campaign via the Scheduler Section, where images of each person entering the store at the scheduled hour are captured. To do so, press the "New Schedule" Button.
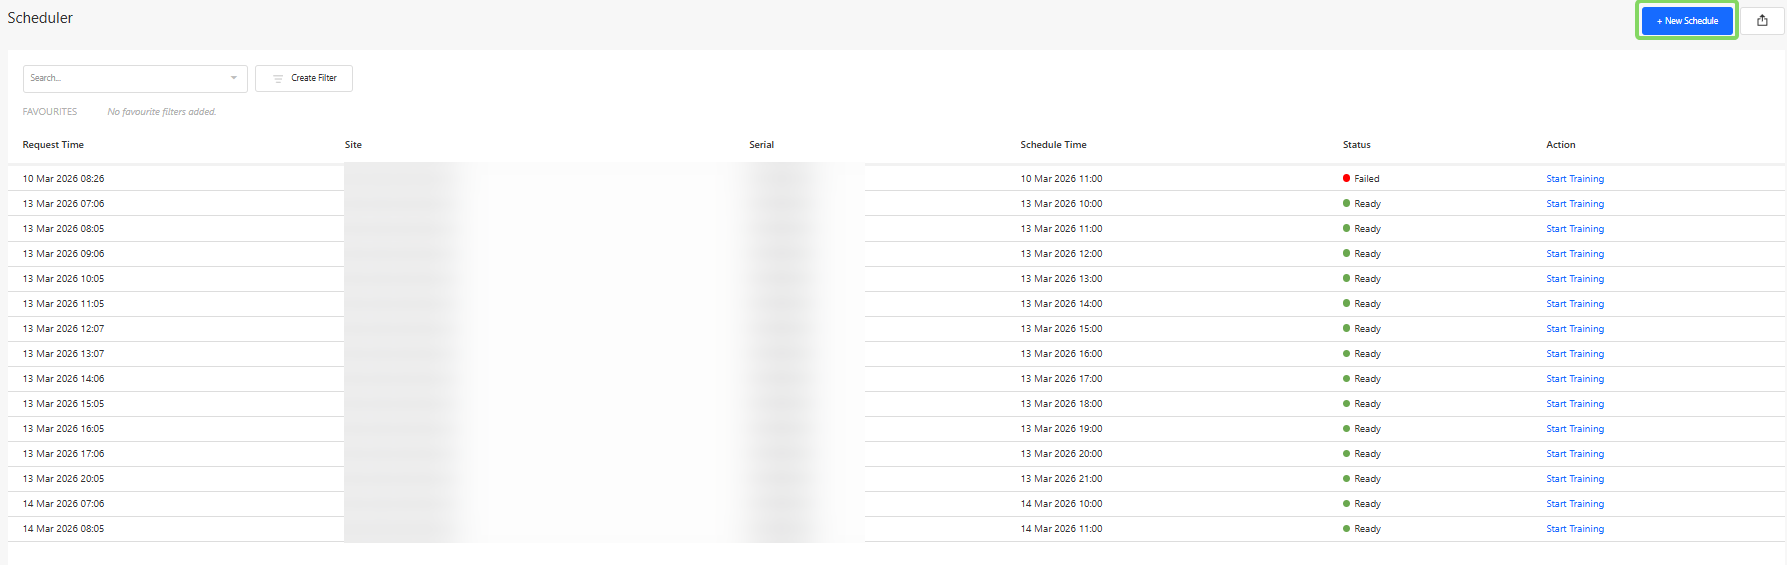
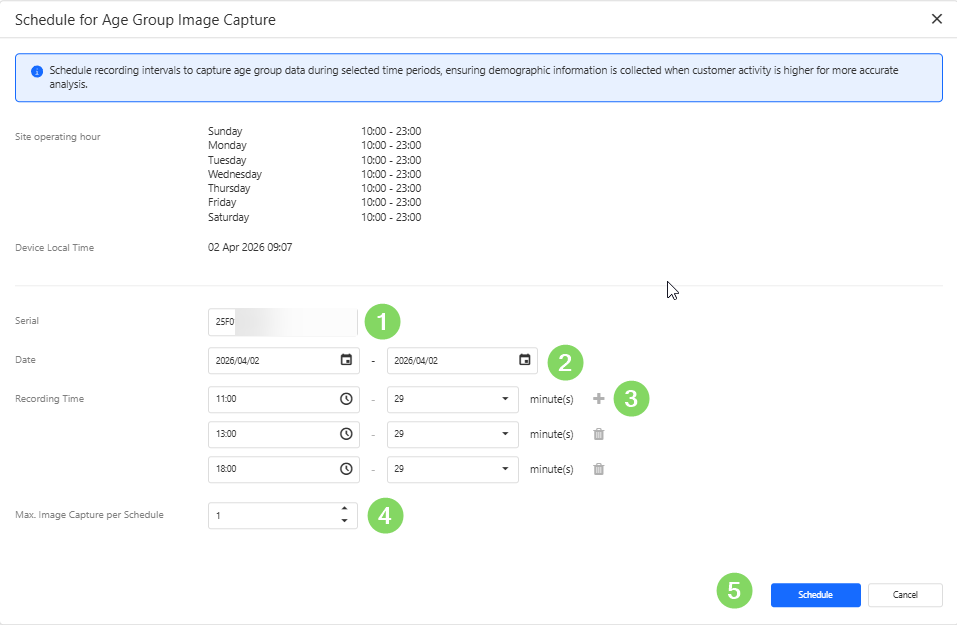
In order to schedule a campaign, users would need to:
When creating a schedule, users need to
- Device Serial Number - identifies the specific people counting device.
- Recording Dates - the day(s) on which the recordings should be performed on.
- Recording Time Window - the hours during which images should be captured.
- Maximum Number of Images - the limit for the total number of images captured during the campaign.
To obtain useful training data, it is recommended to schedule campaigns during periods with a mixture of all ages activity.
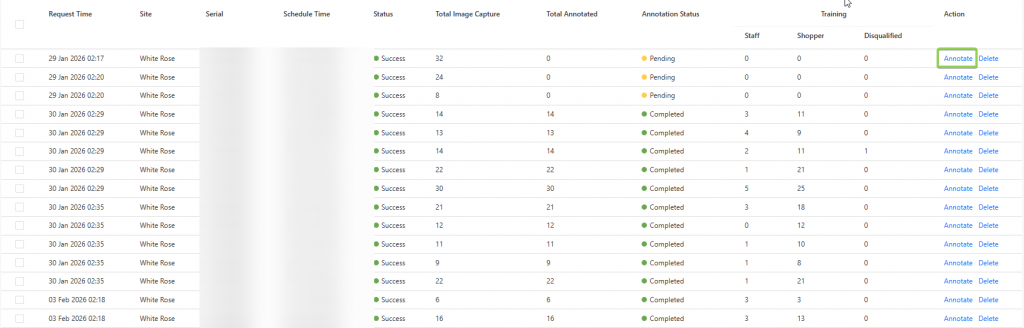
Once successfully recorded, the annotate button may be pressed to begin harvesting into a training campaign.
Training
In the Training Section, users can perform manual annotations on captured images from scheduled campaigns.
These annotations form the ground truth dataset, which is used to validate and improve the machine learning model responsible for identifying which age group a person is part of.
Each campaign contains a collection of images captured during the scheduled recording window. The number of captured images should generally correspond with the number of detected entries into the store during that time period.
There are several use cases for the training workspace, namely for creating a ground truth to be compared with in the Overview section, or to provide additional training to improve the accuracy of the model.
This retraining of the model would be helpful if a store has a varied age distribution and the current machine-inferred results do not match the ground truth annotations. The system may require retraining to maintain classification accuracy.
To begin annotating a campaign, users can click the "Annotate" button.
The goal of the annotation process is to classify each captured individual as one of the following:
- Children
- Teenager
- Adults
- Elderly
- Disqualified Image
These labels allow the system to classify and then train the model via visual features that are associated with the different age categories.
How to Perform Annotations
Users can annotate on a campaign by identifying and annotating the images captured as the above listed classifications.
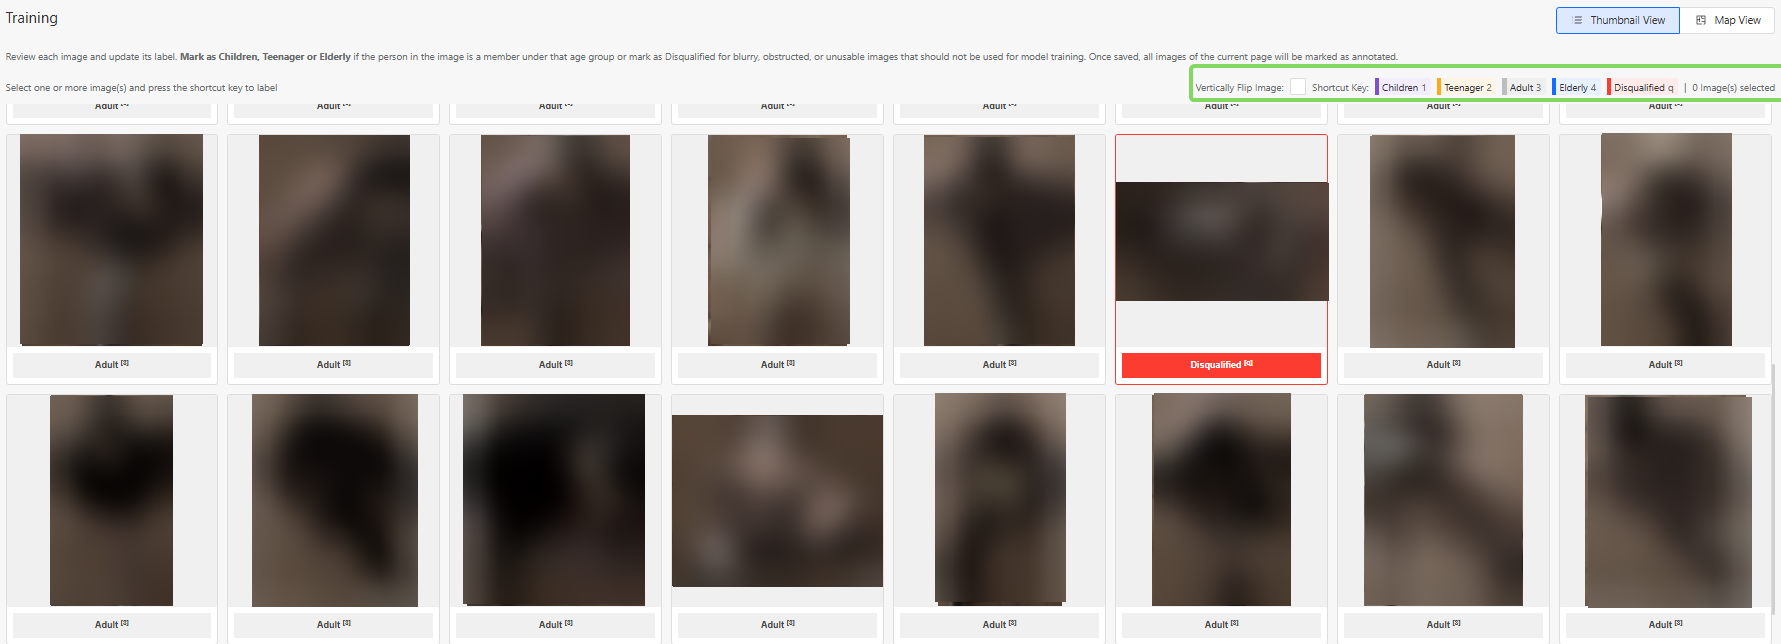
If the image shows an Elderly, select all of the supposed Elderly images and press the "4" button or click on "Elderly" on the top right.
If the image shows an Adult, no action is required, as Adults are considered the default category. However, if you wish to change the status to "Children" or "Teenagers" or "Disqualified", select all relevant images and press the respective button or its assigned number/letter.
Disqualified Images
Some captured images may not be suitable for model training. These should be marked as Disqualified, by selecting all disqualified images and selecting "q"
Examples include:
- Extremely blurry images
- Images where the person is extremely obstructed
- Images where the person cannot be clearly identified
- Images where the image is falsely captured as a human
- Images with extreme lighting conditions
Below are some examples of images that are likely to be disqualified:
Using the Map View
For additional context, users may click on a selected image and open the Map View.
The Map View displays:
- Up to three images captured during different moments of the same trajectory
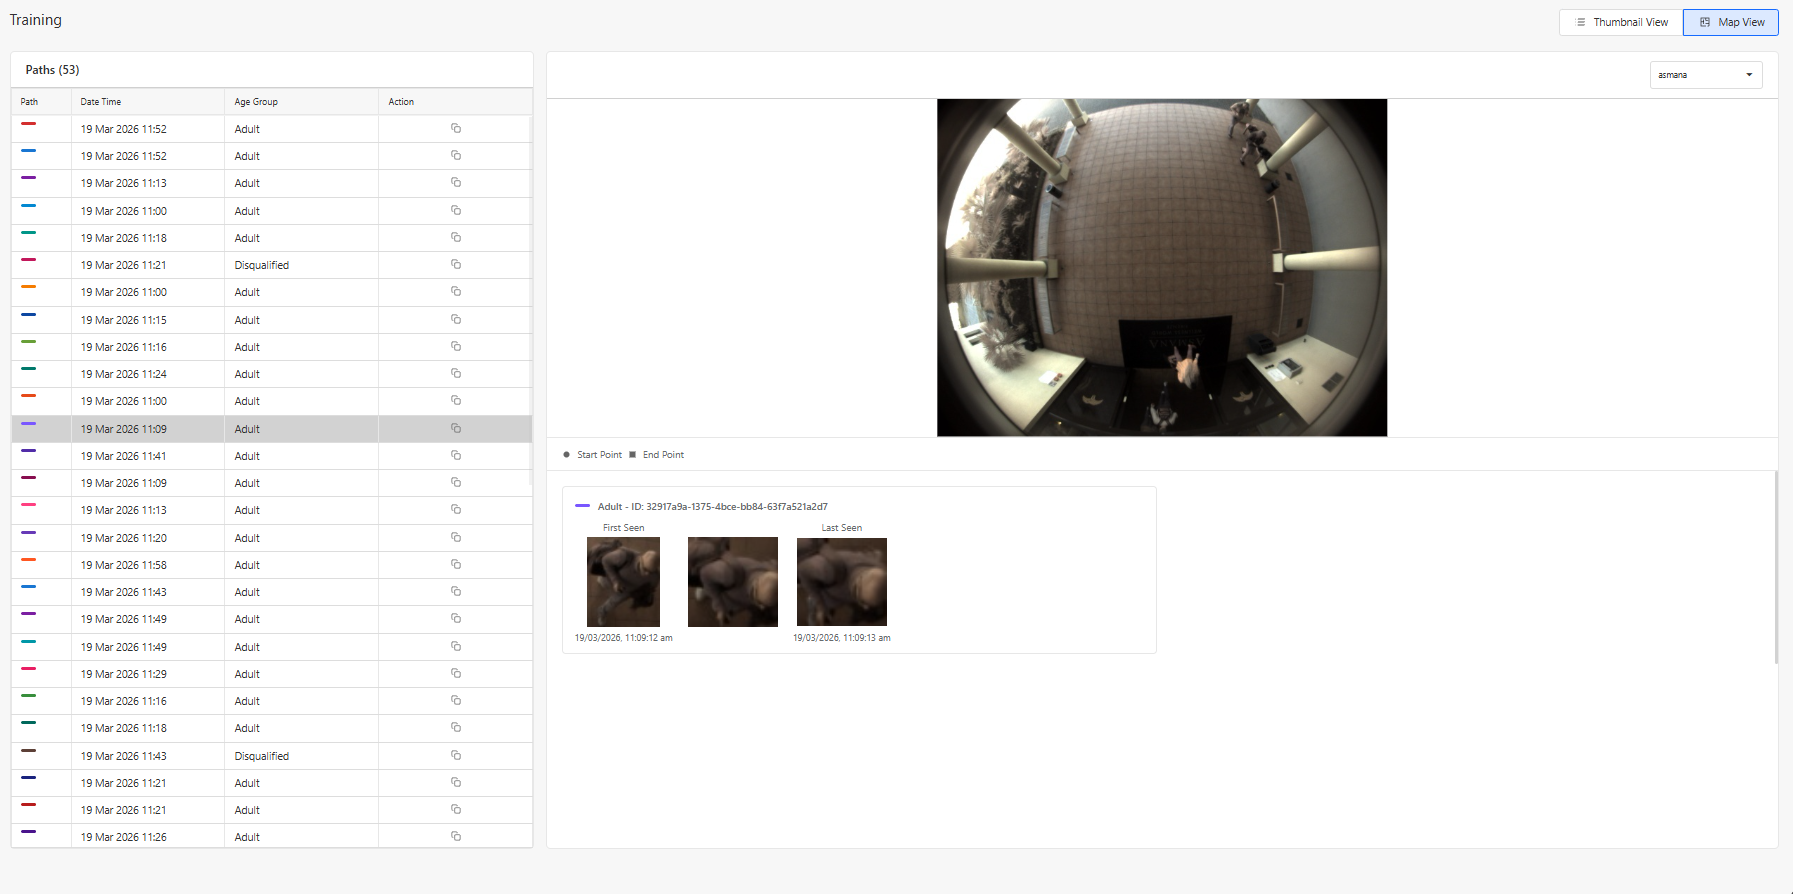
By observing these movement patterns, users can make more accurate annotations.
Annotation Status
Once annotation is completed, the user can click on "Save Annotation Progress", and an option to change the stage to 3 different categories can be made.
These statuses are:
- In Progress:The campaign annotation is partially completed or requires further review.
- Completed: All images in the campaign have been successfully annotated and are ready for training.
- Not Useful: The campaign data is unsuitable for model training (e.g., poor image quality or incorrect scheduling).
VLM
The VLM Playback workspace allows users to review and validate the actions predicted by the Vision-Language Model (VLM) for captured persons. It provides visual and contextual information to help users determine whether the predicted person action and engagement level accurately reflect the person's actual behaviour.
The workspace combines the floorplan location, video playback, and VLM prediction results in a single interface, allowing users to efficiently review individual events and identify potential prediction errors.
Workspace Overview

The VLM Validation workspace consists of three main sections:
- Floorplan View
- Live View
- VLM Output
These sections work together to provide the spatial, visual, and analytical context required to validate each VLM prediction.
Section 1: Floorplan View
The Floorplan View displays the store layout and the location of the selected event on the floorplan.
When a VLM event is selected from the VLM Output table, the floorplan automatically navigates to the corresponding location of the captured person. This allows the user to understand the person's position within the store and determine which product or area the person was interacting with.
Section 2: Live View
The Live View displays a short video clip associated with the selected VLM event.
After the user selects an event from the VLM Output table, the corresponding video clip is loaded automatically. The user can then observe the person's actual behaviour and compare it with the VLM's predicted action.
For example, if the VLM predicts:
- Category: Detailed Inspect
- Engagement Level: Level 3
The user can review the video to determine whether the person actually spent significant time examining the product, such as picking it up, inspecting its features, or closely examining its design.
Section 3: VLM Output
The VLM Output section displays a list of VLM events captured within the selected date and filter criteria.
Each row represents an individual person event and contains the information required to validate the VLM prediction.
VLM Output Columns
| Column | Description |
| Timestamp | The time at which the VLM event occurred. |
| People ID | The unique identifier assigned to the captured person. |
| Category Name | The action predicted by the Vision-Language Model. |
| Engagement Level | Indicates the depth of the person's engagement with the product. A higher level represents deeper or more significant engagement. |
| Description | A natural-language description generated by the VLM to explain the predicted person action. |
Flow Map
The Flow Map workspace visualizes how shoppers move through a store, helping users understand traffic patterns, popular paths, and area-to-area transitions to optimize store layout, product placement, and staffing.
Workspace Overview
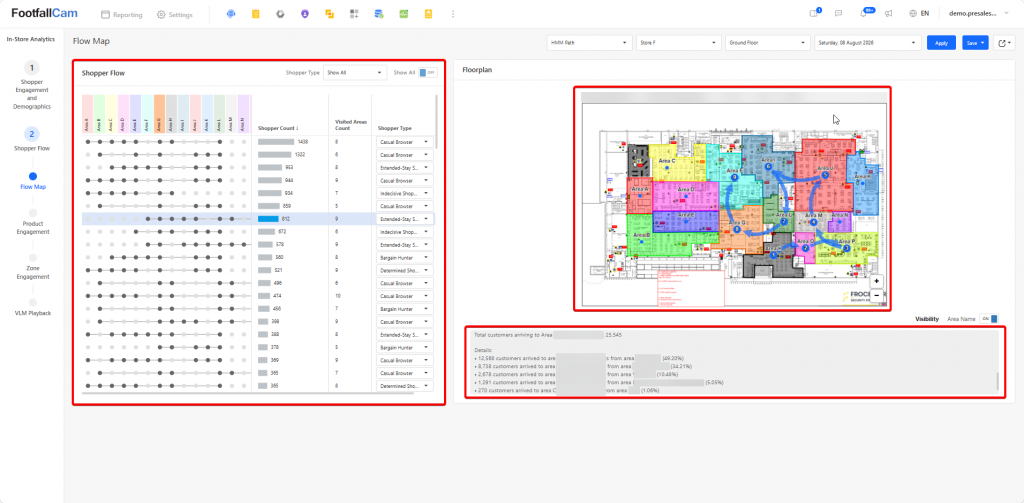
The Flow Map workspace consists of three main sections:
- Shopper Flow Table
- Floorplan View
- Flow Summary
These sections work together to provide the visual and analytical context required to analyze customer behavior in a store.
Section 1: Shopper Flow Table
Lists shopper paths through the store, with each row selectable to inspect a specific path in detail
- Path -- Areas covered by that path. Users can also click individual areas to filter for paths passing through them.
- Shopper Count -- number of shoppers who followed that exact path (sortable)
- Visited Areas Count -- number of distinct areas covered by that path (sortable)
- Shopper Type -- dropdown to filter paths by shopper category
Section 2: Floorplan View
A store floorplan with color-coded zones. After selecting a row in the Shopper Flow Table, numbered blue markers trace that specific shopper flow route overlaid on the map, showing the actual walking path between areas with directional arrows.
Section 3: Flow Summary
After selecting exactly one area, a breakdown panel will show the AI Summary of the shoppers passing through the area. The summary includes:
- Total Customers Analyzed
- Start/End Count -- how many shoppers began or ended their journey there
- Outbound Analysis -- where customers went next, broken down by neighboring area with count and %
- Inbound Analysis -- where customers came from before arriving, broken down by neighboring area with count and %
Product Engagement / Staff Shopper Interaction
Objective: Overview of the Product Engagement feature designed to help you analyse customer interactions with specific products on your store floor map.
Overview
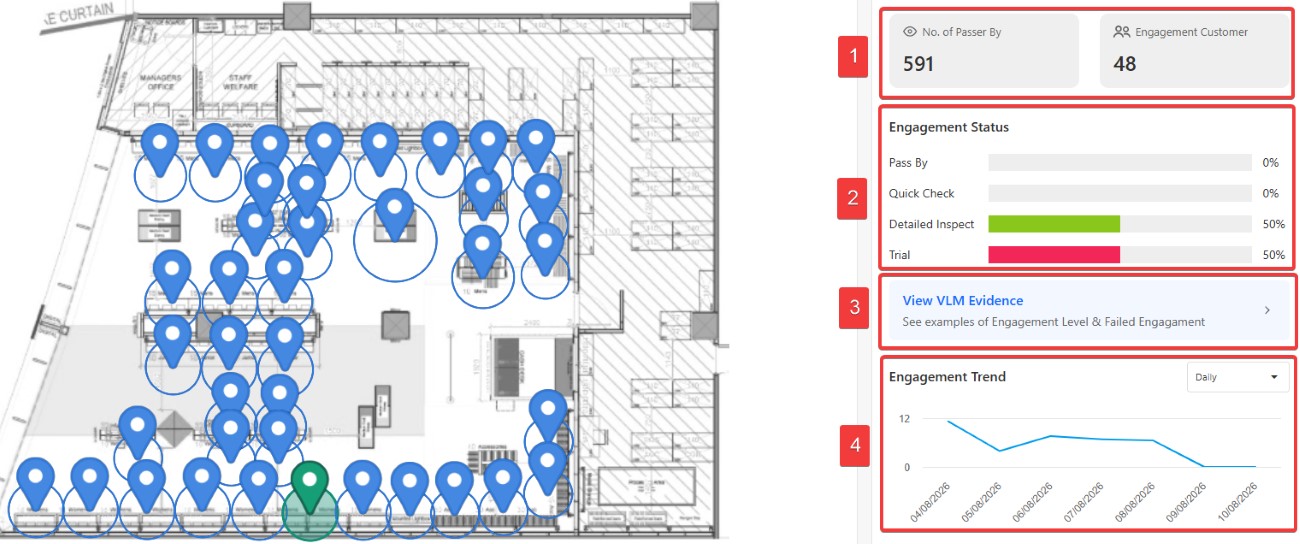
Once products are plotted on the store map, clicking on any plotted product opens a detailed side panel displaying real-time traffic, depth of engagement, and engagement trends over time.
Key Metrics & Features
- Traffic & Engagement Summary
- No. of Passer By: Total count of customers who walked near or past the plotted product location.
- Engagement Customer: Total count of unique customers who showed intent or interacted with the product.
- Engagement Status
Categorises customer interactions into distinct engagement levels to measure interest depth:
- Pass By: Customers who walked past without stopping or browsing.
- Quick Check: Brief glances or short stops near the product area.
- Detailed Inspect: Extended interaction where customers actively inspect or handle the product.
- Trial: High-intent engagement, such as trying on or testing the product.
- View VLM Evidence
- Click View VLM Evidence to see visual examples validating engagement detection.
- Review sample video snapshots of actual customer interactions across different Engagement Levels as well as instances of Failed Engagement.
- Engagement Trend
- Visual line graph tracking product interaction levels across a customisable date range (e.g., Day, Week, Month, or Custom range).
- Helps identify peak performance days, response to promotional changes, or product interest over time.
Staff Shopper Interaction
Overview
To determine whether the staff is serving the customer proactively throughout the operational day.
Requirement:
Provide distinct staff uniform images for us to train staff detection model.
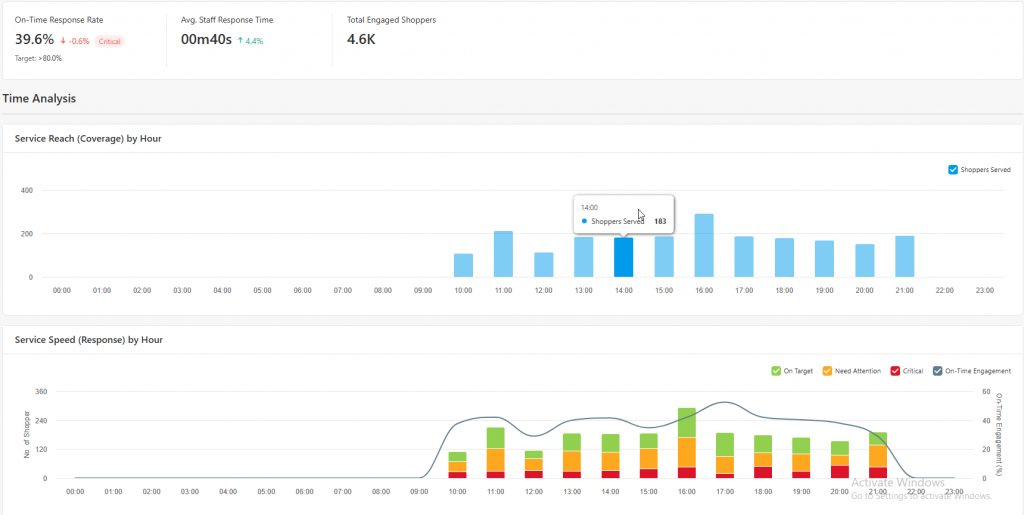
Key metric:
- Shopper served: Number of shopper being served by staff.
- On-time response rate: Percentage of shopper who being reached by staff within 20 second.
- Total Engaged Shopper: Number of shopper engaged within the area for at least 30 second.
- Service Speed (Response) by Hour
- On target: Staff reached to shopper within 20 second.
- Need attention: Staff reached to shopper between 20 to 60 second.
- Critical: Staff reached to shopper after 60 second.
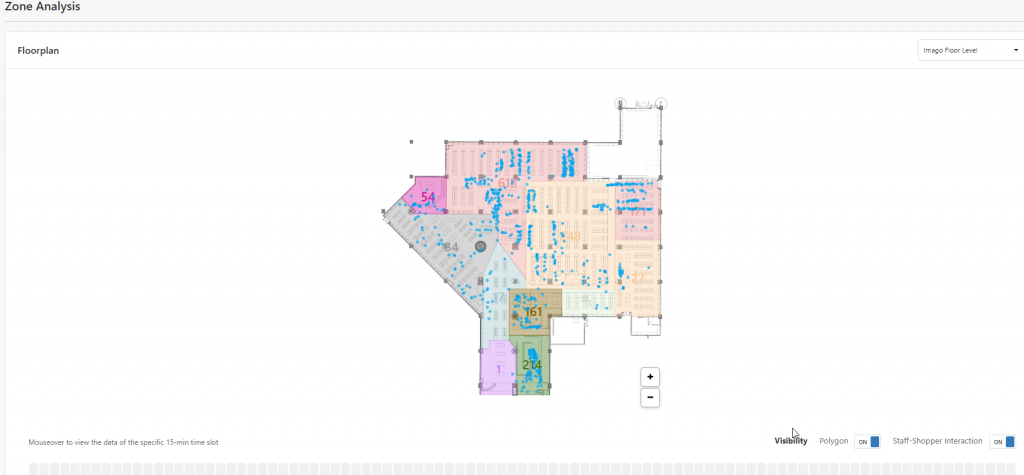
Zone analysis shows that total shopper being served within each area in the store, and location of staff interaction happen.
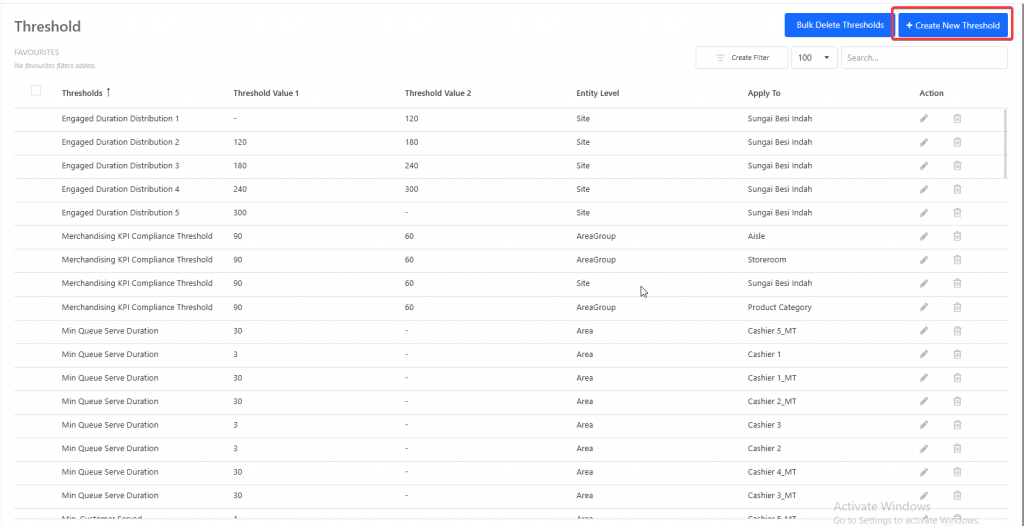
Staff interaction threshold configuration:
Currently the minimum staff interaction duration to be qualified as 1 staff interaction is 5 second by default. If you wish to set your desired minimum staff interaction duration, you may proceed to threshold configuration with the link below.
Link to threshold configuration page
1. Click Create new threshold button
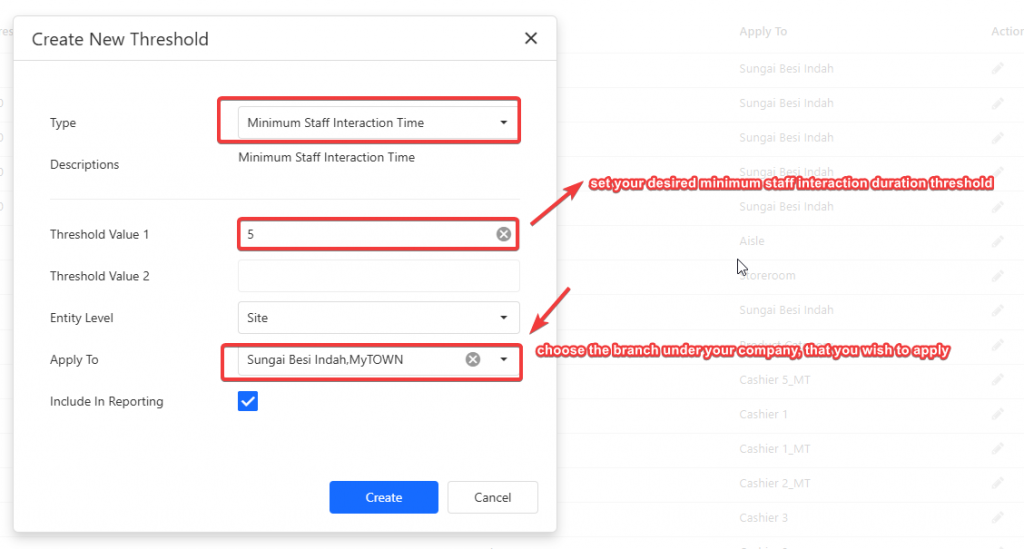
2. Choose minimum staff interaction time for type.
3. Set the threshold value 1 to be your desired staff interaction duration threshold.
4. Then in Apply To field, choose the branch/sites that you wish to apply.
5. Hit create button, then the configuration is completed.
Buying Opportunity
Overview
The Footfall Validation Workspace ensures the people-counting system accurately measures true Buying Opportunities by correctly separating genuine shoppers from staff members.
Purpose of this workspace:
- Verify Accuracy: Users can check if the system's AI is correctly identifying and excluding staff movements from the shopper counts.
- Analyse Real Traffic: Users can utilise the built-in charts (such as the Funnel Chart and Buying Opportunity Distribution) to understand genuine customer footfall, group sizes, and conversion trends without skewed data.
In short, this page allows users to validate the data to ensure highly reliable store conversion rates and traffic metrics.
Steps to Filter Data
Step 1: Click on "Site" Filter to filter specific site.
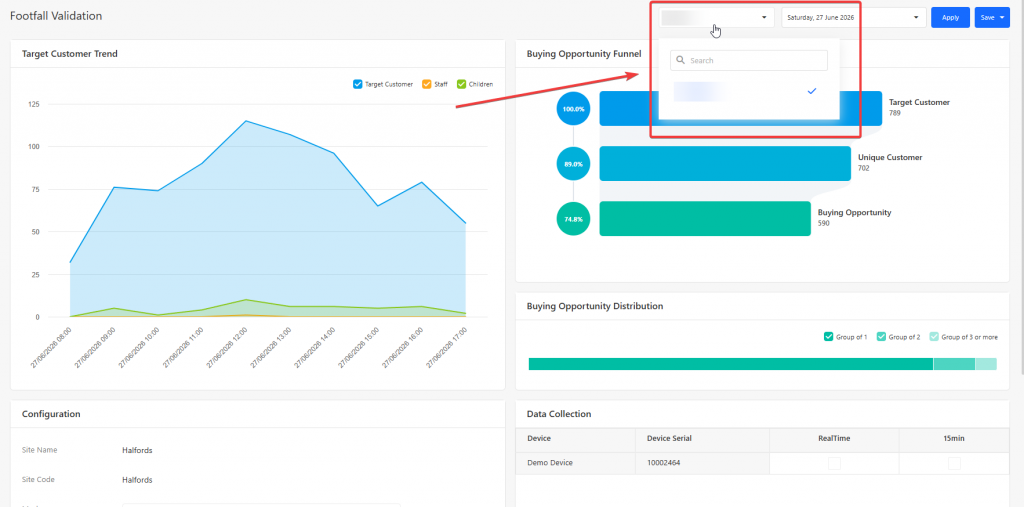
Step 2: Click on "Date" Filter to filter specific date range.
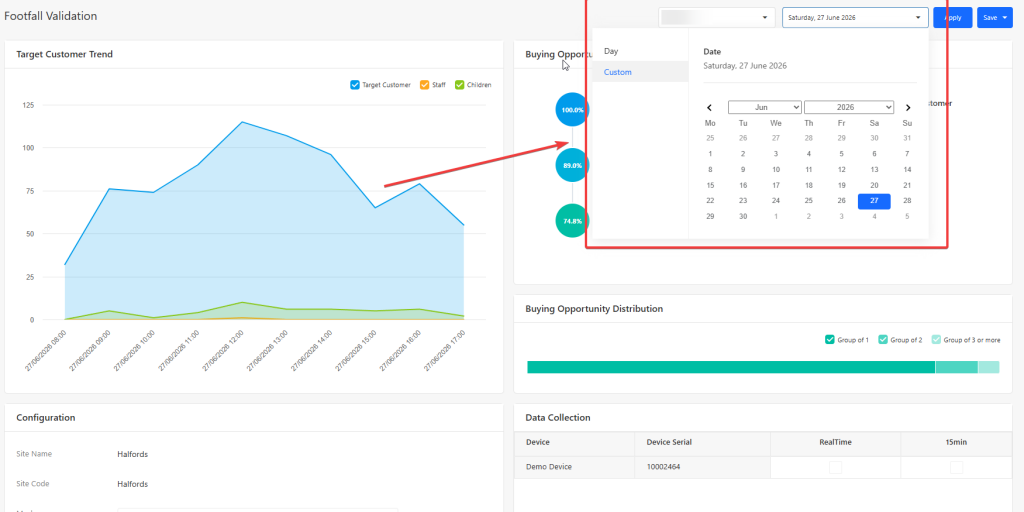
Step 3: Click the "Apply" button to view the results.
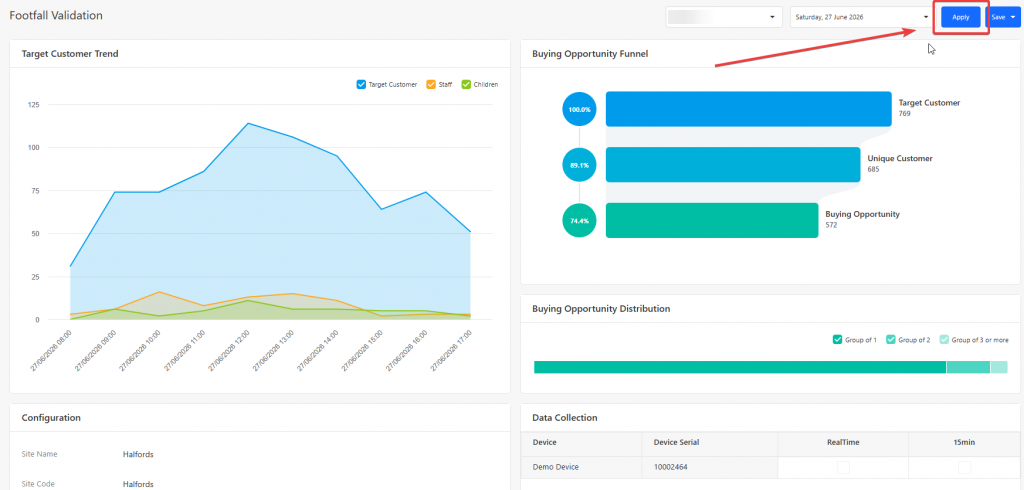
Step 4: Review the newly filtered data displayed on the dashboard.
Key Metrics & Features
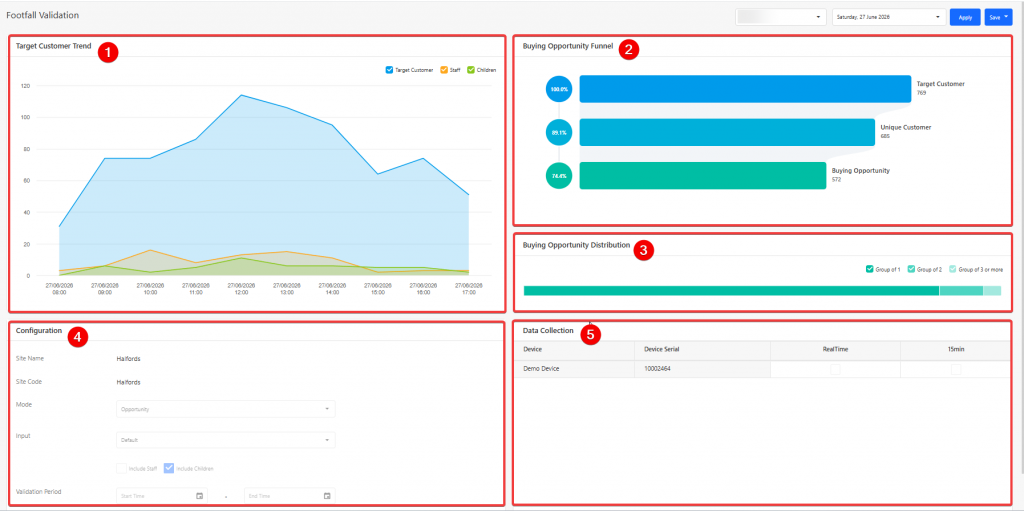
Section 1
Target Customer Trend A visual line graph tracking footfall volume across the selected timeframe (e.g., a 24-hour period). It categorises the detected traffic into distinct profiles, allowing users to analyse movement patterns and verify exclusions over time by toggling the top-right checkboxes:
- Individual: Standard customers detected entering the zone.
- Staff: Employees identified by the system (used to verify that staff exclusion is working correctly).
- Children: Children detected by the system.
Section 2
Buying Opportunity Funnel A tiered visualisation illustrating how raw detected traffic is filtered down into actionable sales metrics. It measures the conversion across three stages:
- Target Customer: The initial, top-level baseline count of relevant individuals detected by the system.
- Unique Customer: The refined count of visitors after applying filtering rules (such as removing staff or filtering out immediate re-entries).
- Buying Opportunity: The final, highly accurate count representing distinct shopping groups that present a genuine opportunity for a sale.
Section 3
Buying Opportunity Distribution A proportional bar chart that breaks down the final "Buying Opportunity" metric based on the size of the shopping party.
- Categorises the incoming traffic into Group of 1, Group of 2, and Group of 3 or more.
- Helps users understand shopper demographics, group dynamics, and whether customers typically shop alone or with companions.
Section 4
Configuration (Bottom Left Panel) Displays the core settings for the selected location, including Site Name and Site Code. It also provides configuration fields to define the Mode, Input type, and a specific Validation Period (Start Time and End Time).
Section 5
Data Collection (Bottom Right Panel) A summary table detailing the hardware linked to the validation workspace. It lists the Device name and Device Serial number, along with status checkboxes for data reporting intervals (RealTime and 15min).
Path Linking
The Path Linking workspace allows users to review and manage the paths linked by the model for captured persons. It provides tools to validate whether the model has correctly linked a person's movement path and to repair paths when incorrect linking is identified.
The workspace consists of two main parts:
- Validate Workspace
- Path Repair Workspace
These two workspaces support the complete path-linking validation workflow. Users can first validate the paths generated by the model and then use the Path Repair Workspace to correct paths that have been incorrectly linked.
Path Linking Workflow
The Path Linking workflow consists of two main stages: Path Validation and Path Repair.
Stage 1: Validate the Model-Linked Path
When the model completes the path linking process, the initially linked paths are displayed in the Validate Workspace.
Users need to review each linked path and determine whether it accurately represents the person's actual movement.
- Correct: If the linked path accurately represents the person's movement, the path can be marked as Validated.
- Wrong: If the linked path does not accurately represent the person's movement, the path should be sent to the Path Repair Workspace for correction.
Stage 2: Repair the Incorrect Path
For paths identified as incorrect, users can open the Path Repair Workspace to correct the model-linked path.
Users should review the incorrect path and make the necessary adjustments so that the final path accurately follows the person's actual movement.
After the path has been repaired, the corrected path should be reviewed again to ensure that the changes are accurate and that the final linked path correctly represents the person's movement.
Workflow Summary
Model-Linked Path
↓
Validate Workspace
↓
Is the linked path correct?
Yes → Mark the path as Validated
No → Send the path to Path Repair Workspace
↓
Repair the Path
↓
Review the Corrected Path
↓
Confirm the final path is accurate
Note: The available validation and repair functions may vary depending on the Path Linking configuration and deployment.
Workspace Overview
1. Validate Workspace
Map View
Timeline View
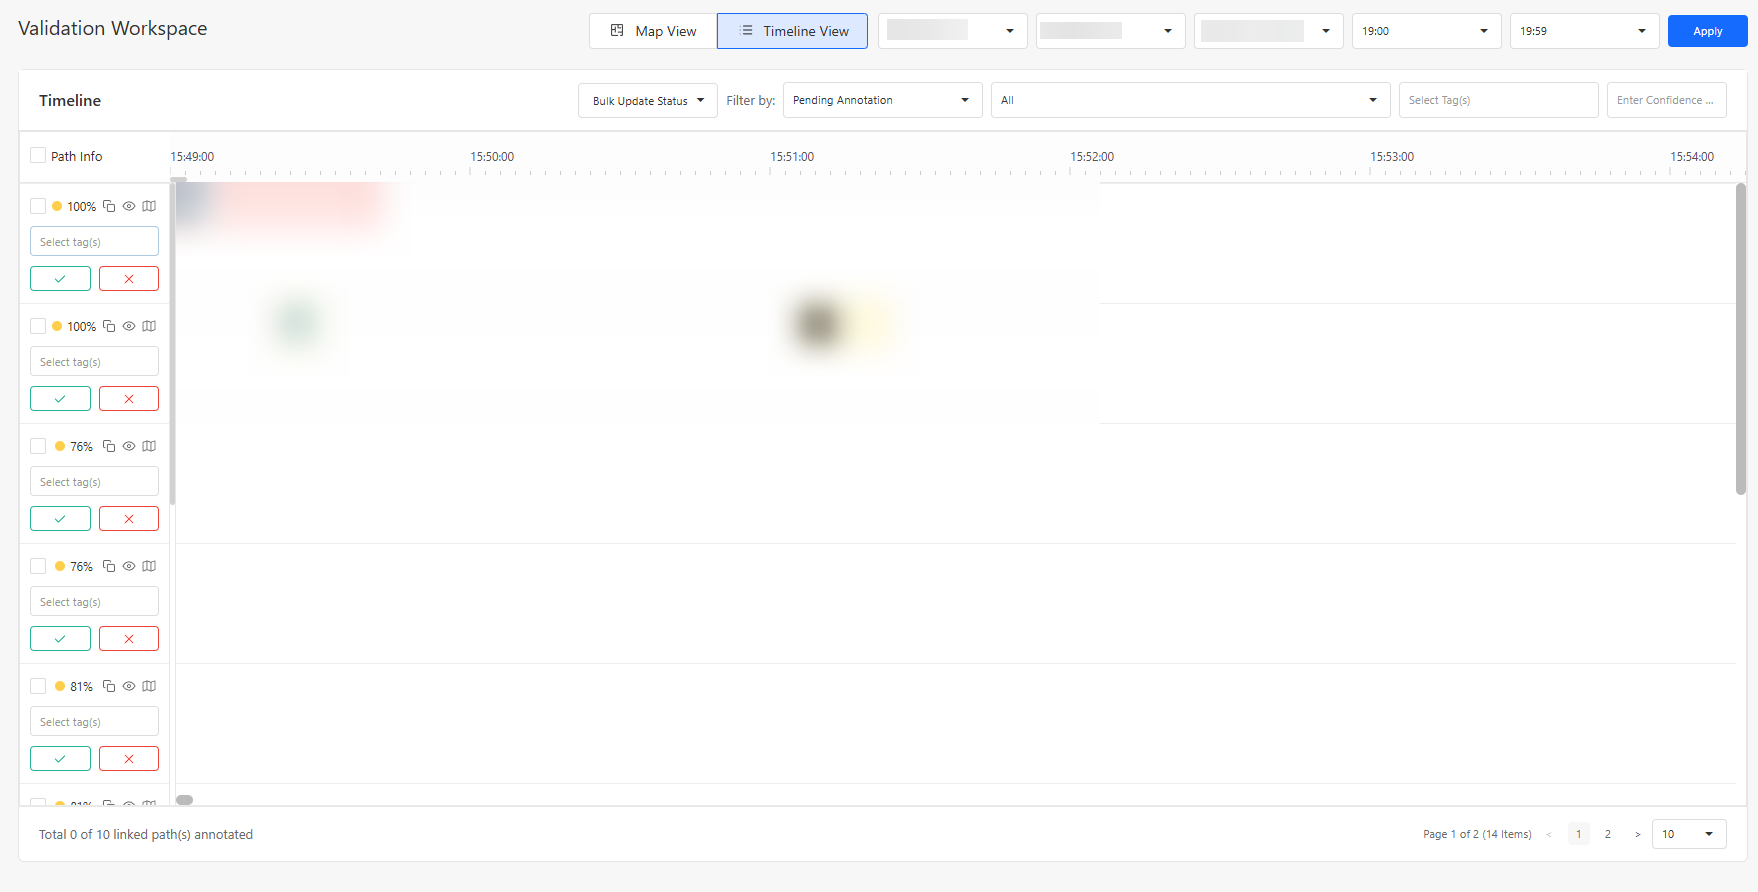
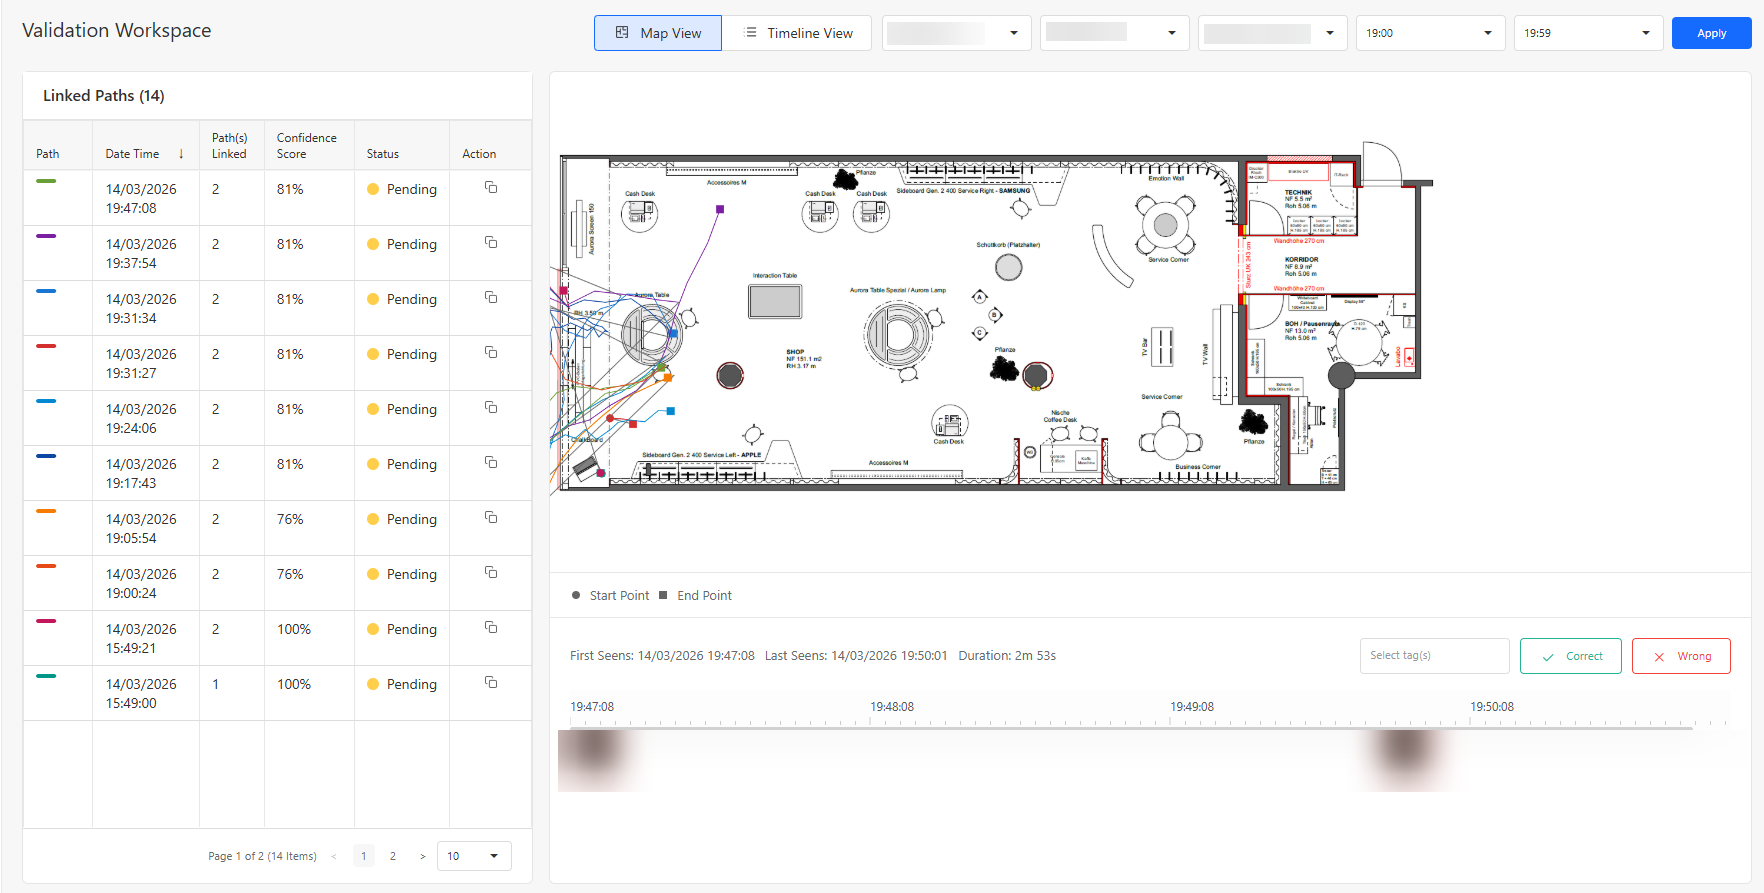
The Validate Workspace is used to verify whether the model has correctly linked the movement path of a captured person.
Users can review the linked path and compare it against the person's actual movement to determine whether the path is correct.
The Validate Workspace allows users to:
- Review the person's linked path on the floorplan.
- Verify the sequence of the person's movement.
- Check whether the correct person has been linked across different locations.
- Identify incorrect path connections or unexpected movement jumps.
- Determine whether the model-linked path accurately represents the person's actual movement.
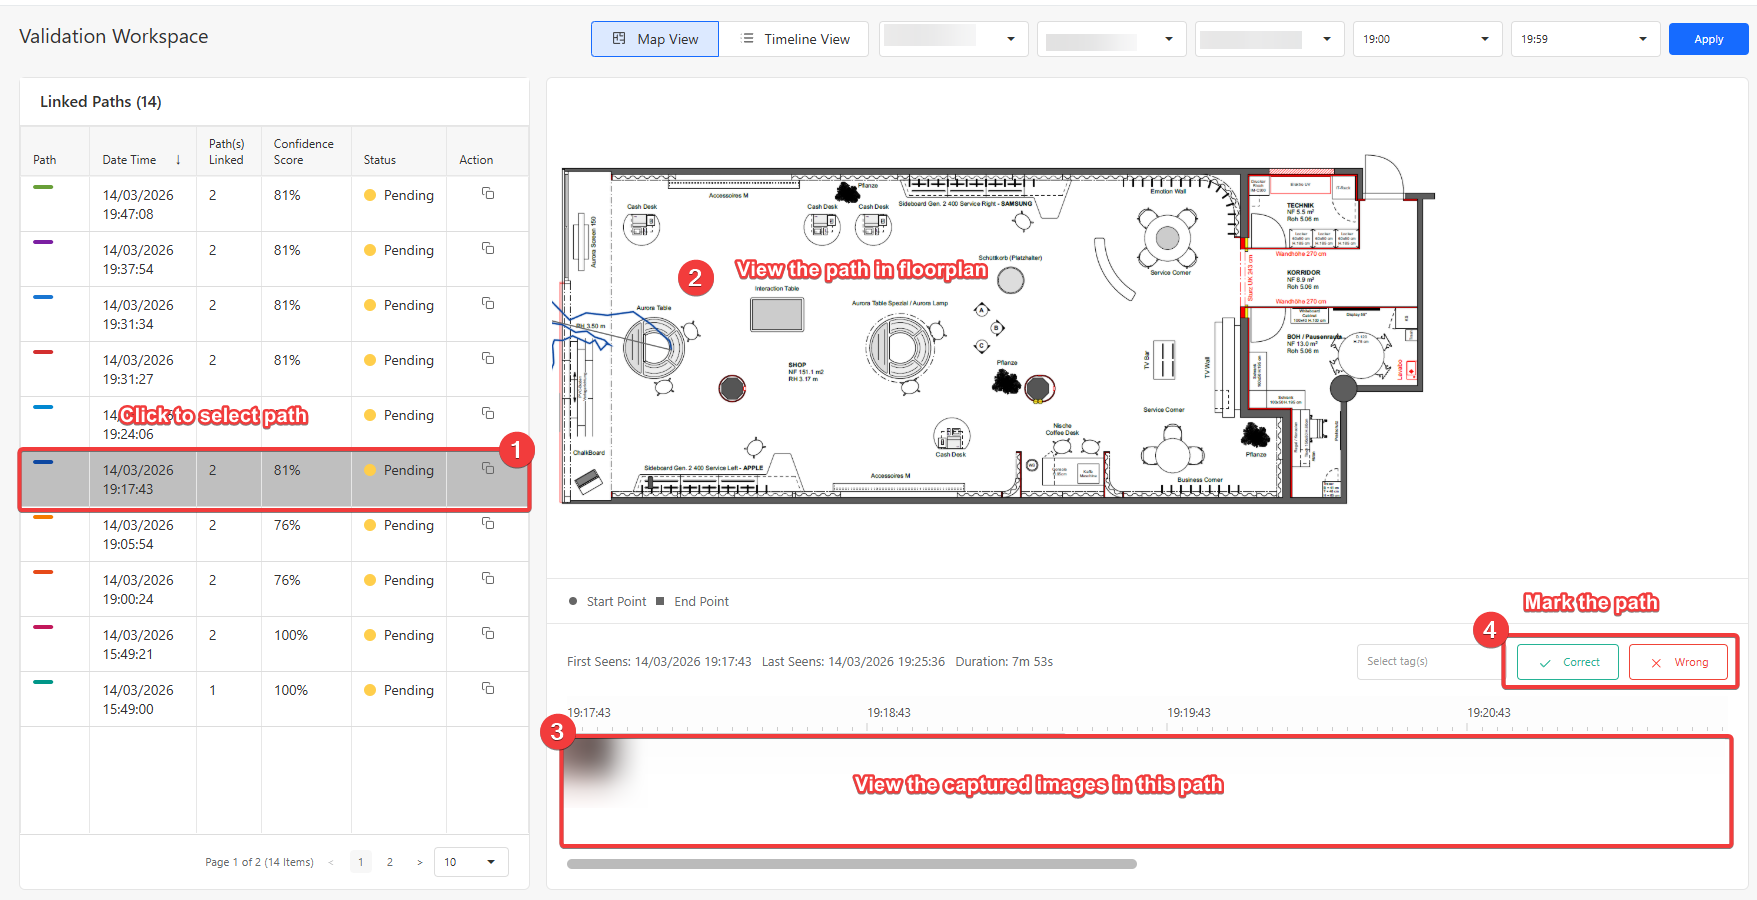
Step 1 - Select a Path: Choose the expected path from the list to begin validation.
Step 2 - Isolate on Floorplan: The floorplan updates automatically to display only the selected path for clear visual inspection.
Step 3 - Review Captured Images: Examine the linked camera captures to confirm whether the visual trajectory matches the path data.
Step 4 - Mark the path as:
- If the linked path is correct, the user can mark the path as successfully validated.
- If the linked path is incorrect, the user can identify the path as requiring repair and proceed to the Path Repair Workspace.
2. Path Repair Workspace
Map View
Timeline View
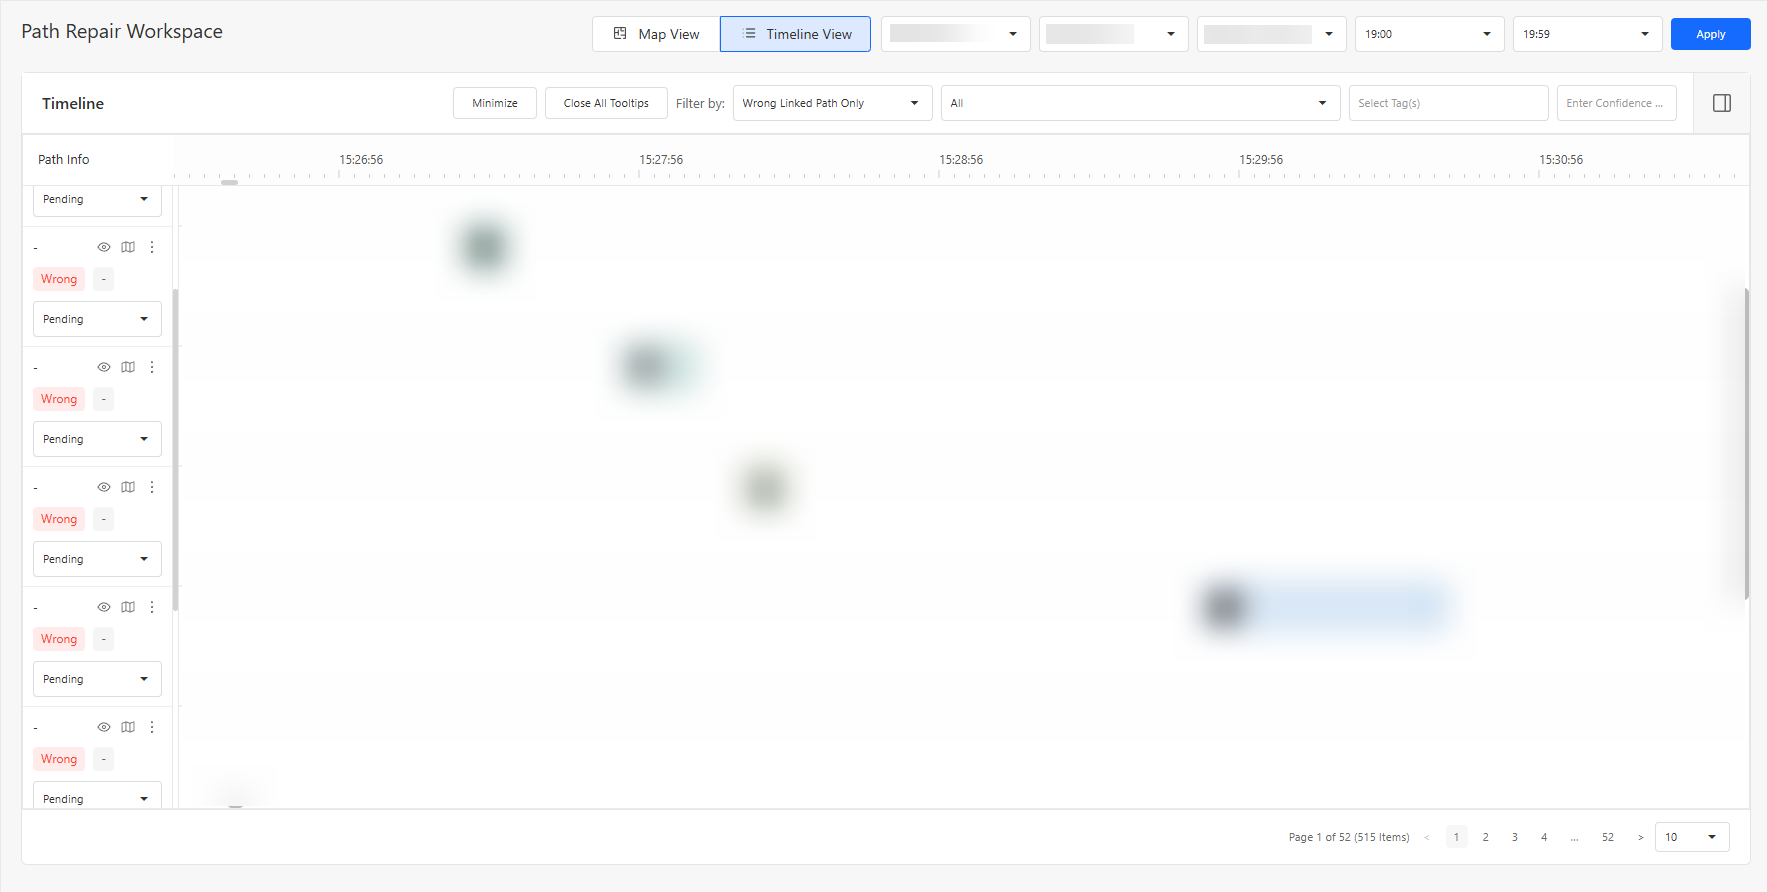
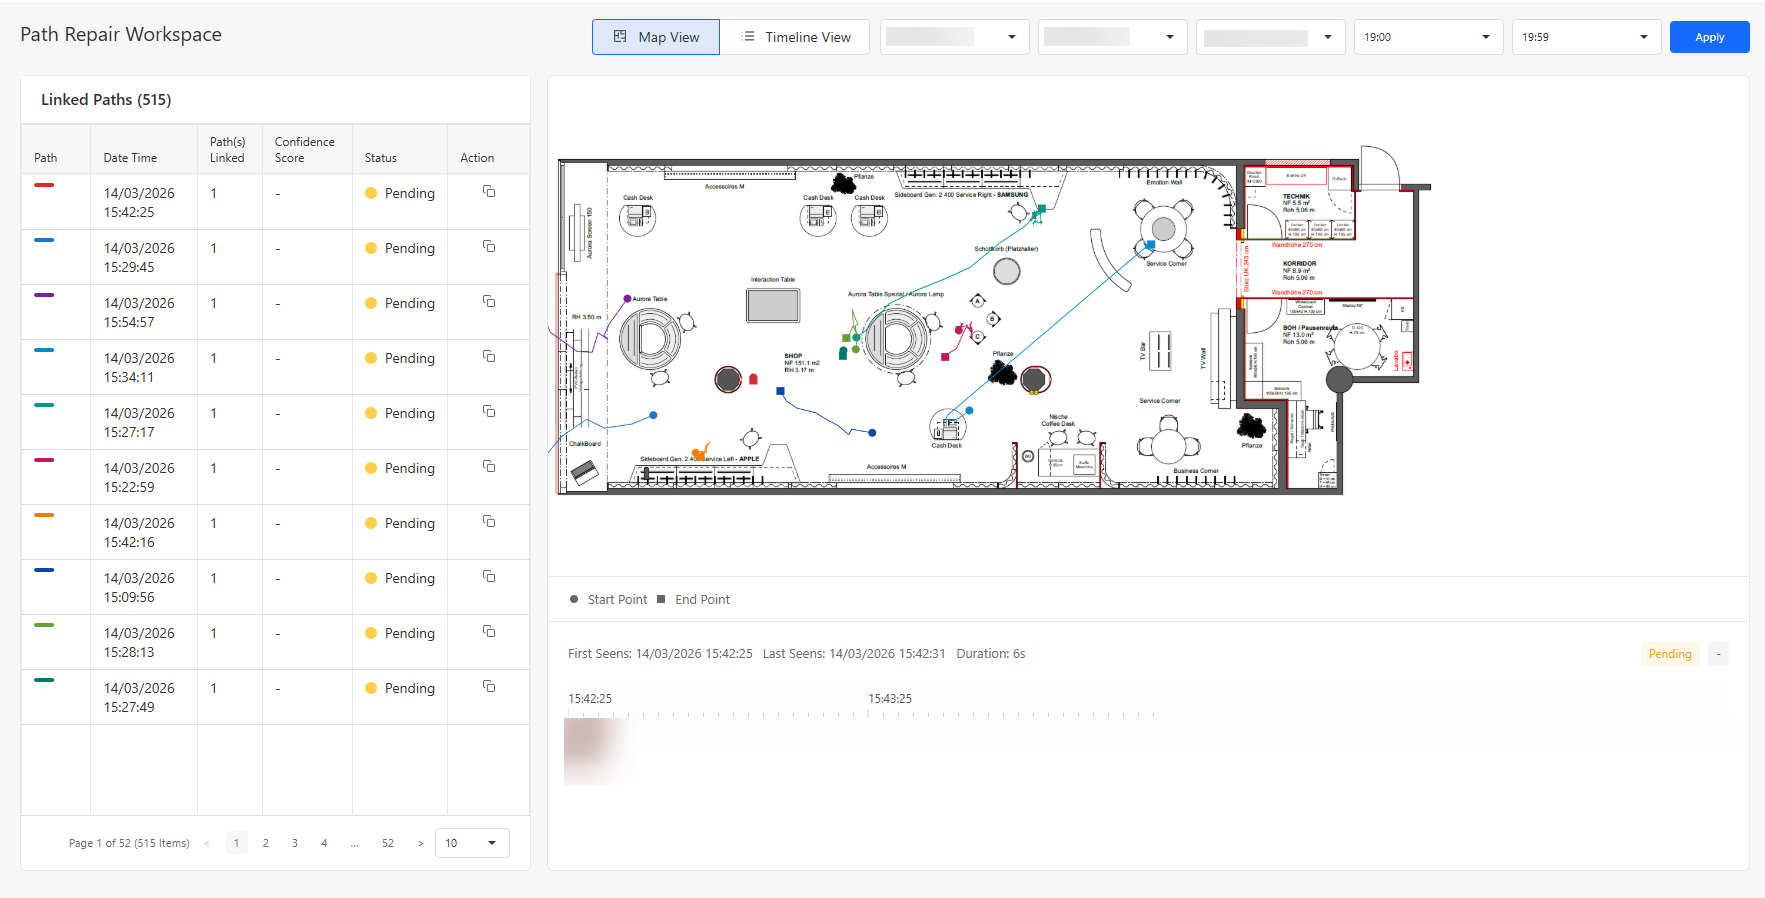
The Path Repair Workspace is used to repair paths that have been incorrectly linked by the model.
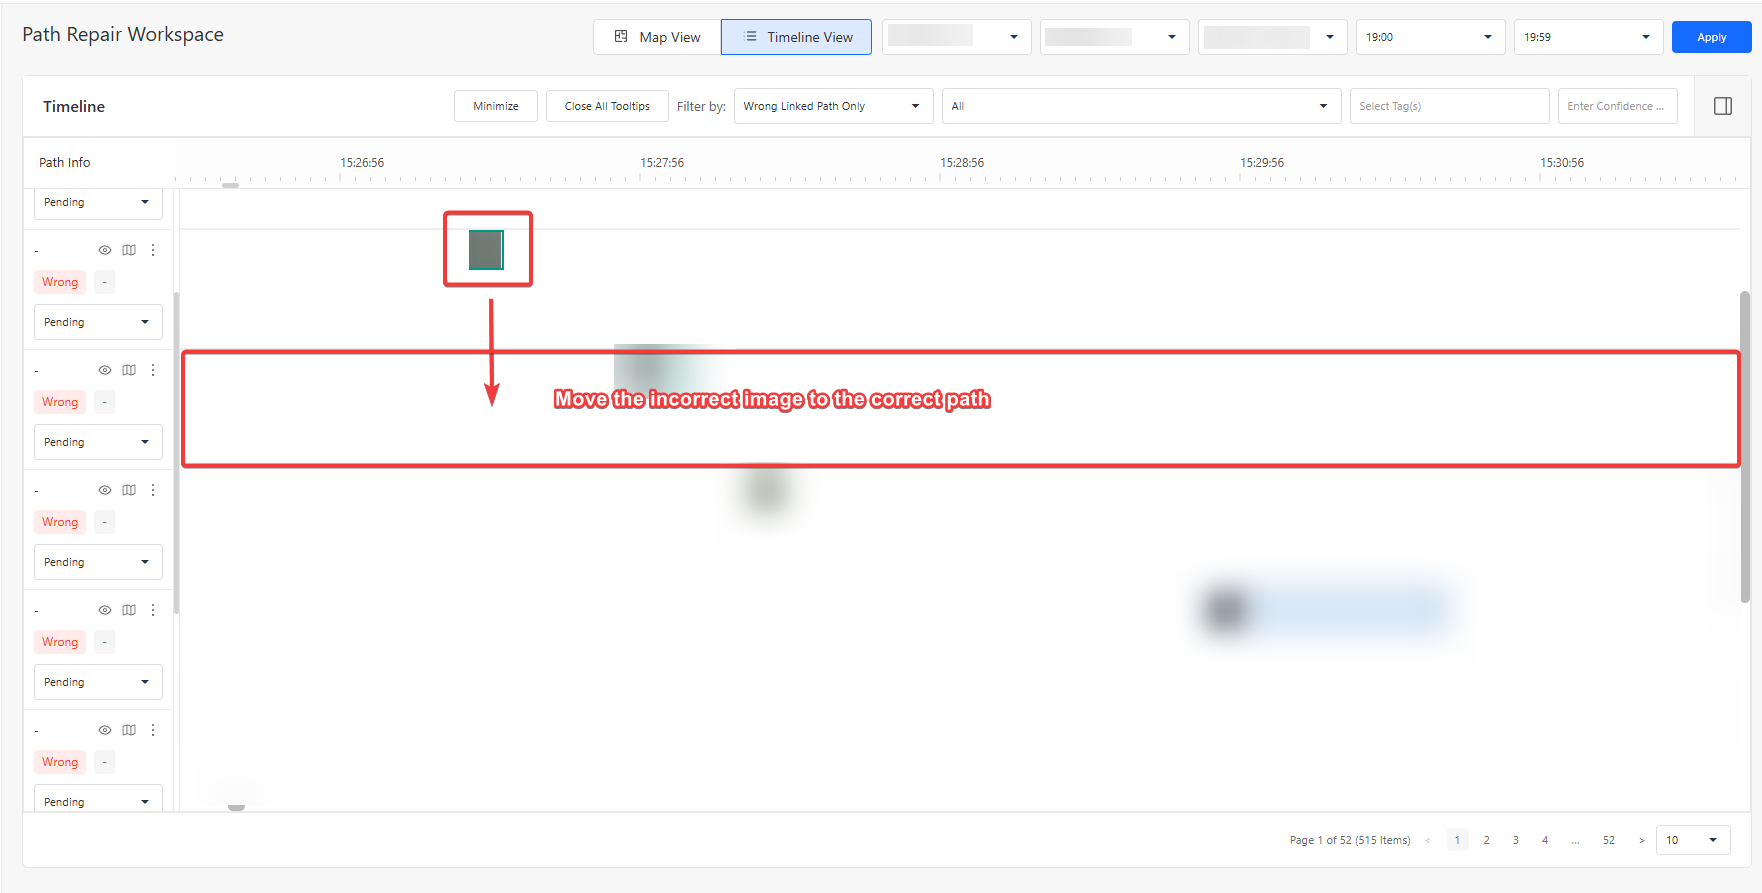
After an incorrect path is identified during validation, users can use this workspace (under timeline view) to review the affected path and make the necessary corrections.
The Path Repair Workspace allows users to:
- Review the incorrectly linked path.
- Identify where the path linking error occurred.
- Review the available person tracks or path segments.
- Correct the incorrect path linking.
- Verify that the repaired path follows the person's actual movement.
- Save the corrected path for further processing or validation.
The Path Repair Workspace ensures that incorrect model-generated paths can be manually corrected rather than being treated as valid movement data.