











Why?
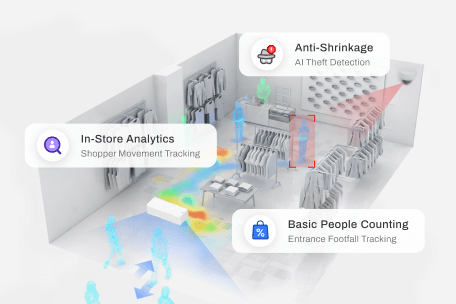
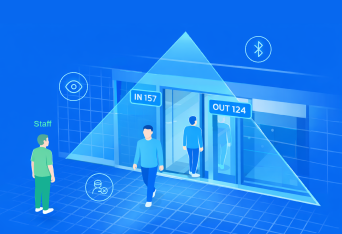
- Footfall & Heatmapping - The app tracks traffic patterns, dwell times, and high-traffic zones within retail properties.
- Valuation & Negotiation - Property teams can use hard metrics on shopper traffic and corridor popularity to optimize retail layouts, prove the value of specific leasing spaces, and negotiate data-backed lease renewals or rates with incoming brands.
- Customer Journey Insights - They can understand peak shopping hours and demographics, allowing them to time promotional pushes and experiential marketing events for maximum impact.
Target Audiences:
Property Teams, Marketing Teams & Store Managers
1.1 Live Operational Dashboard
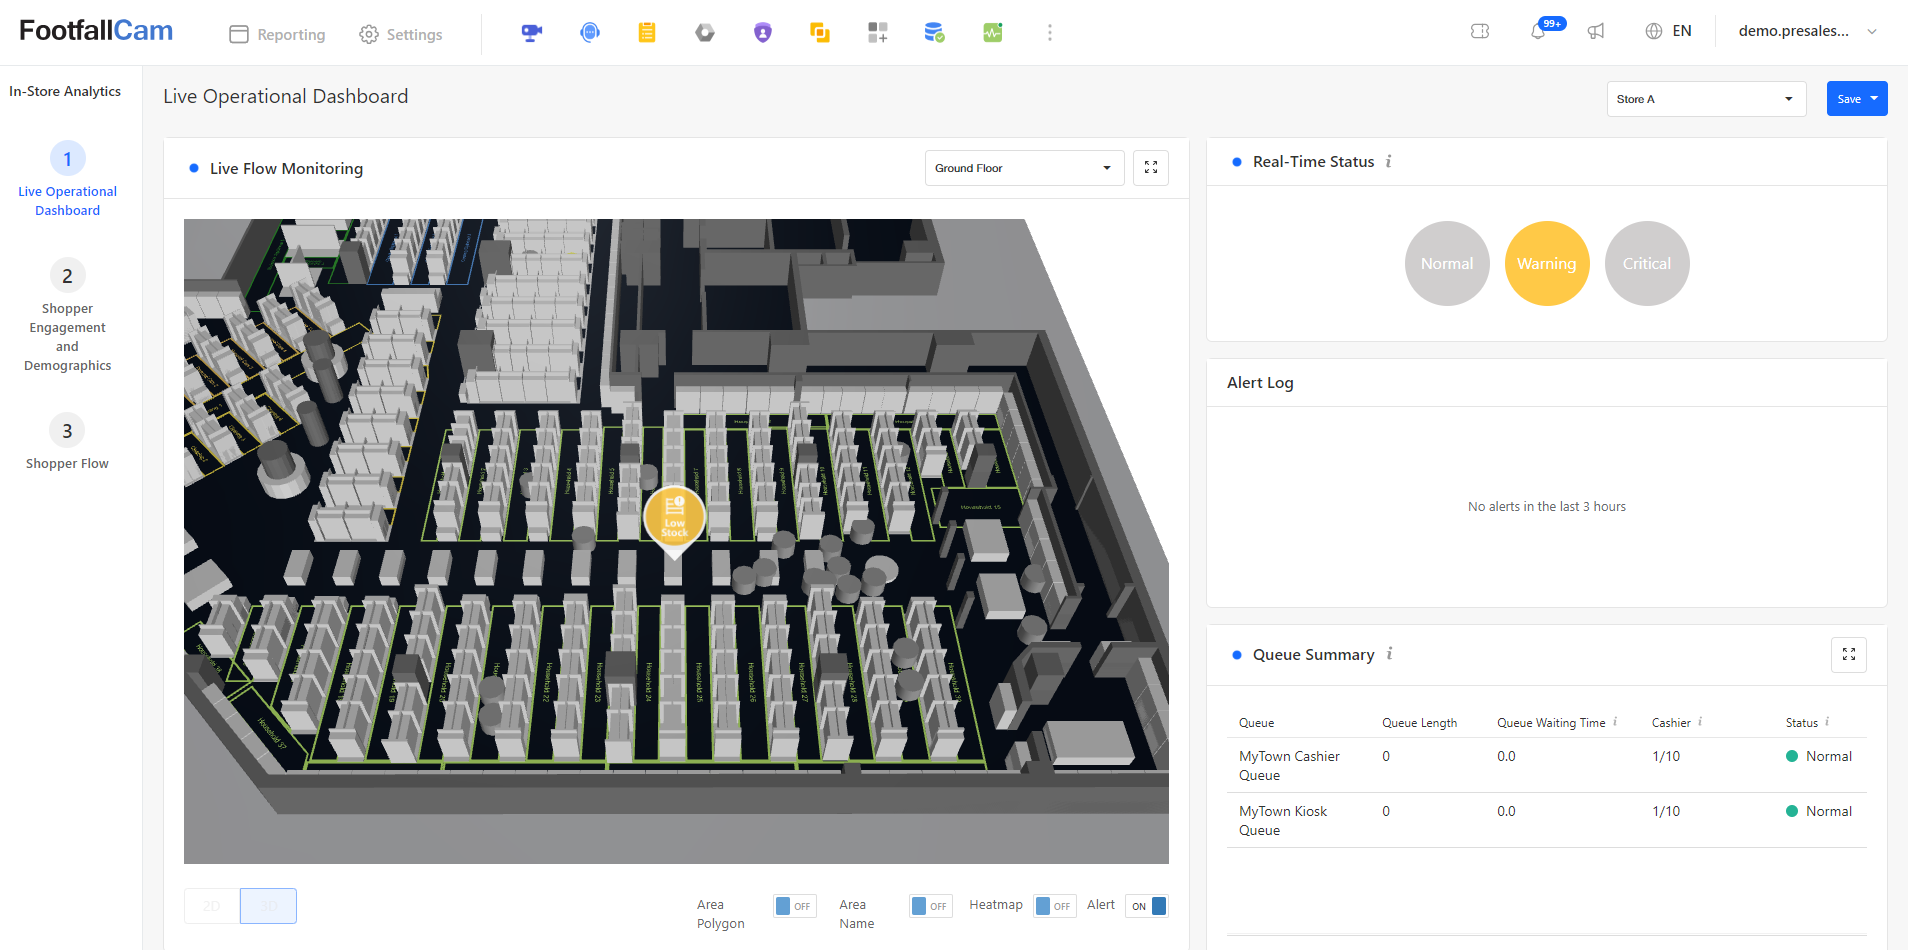
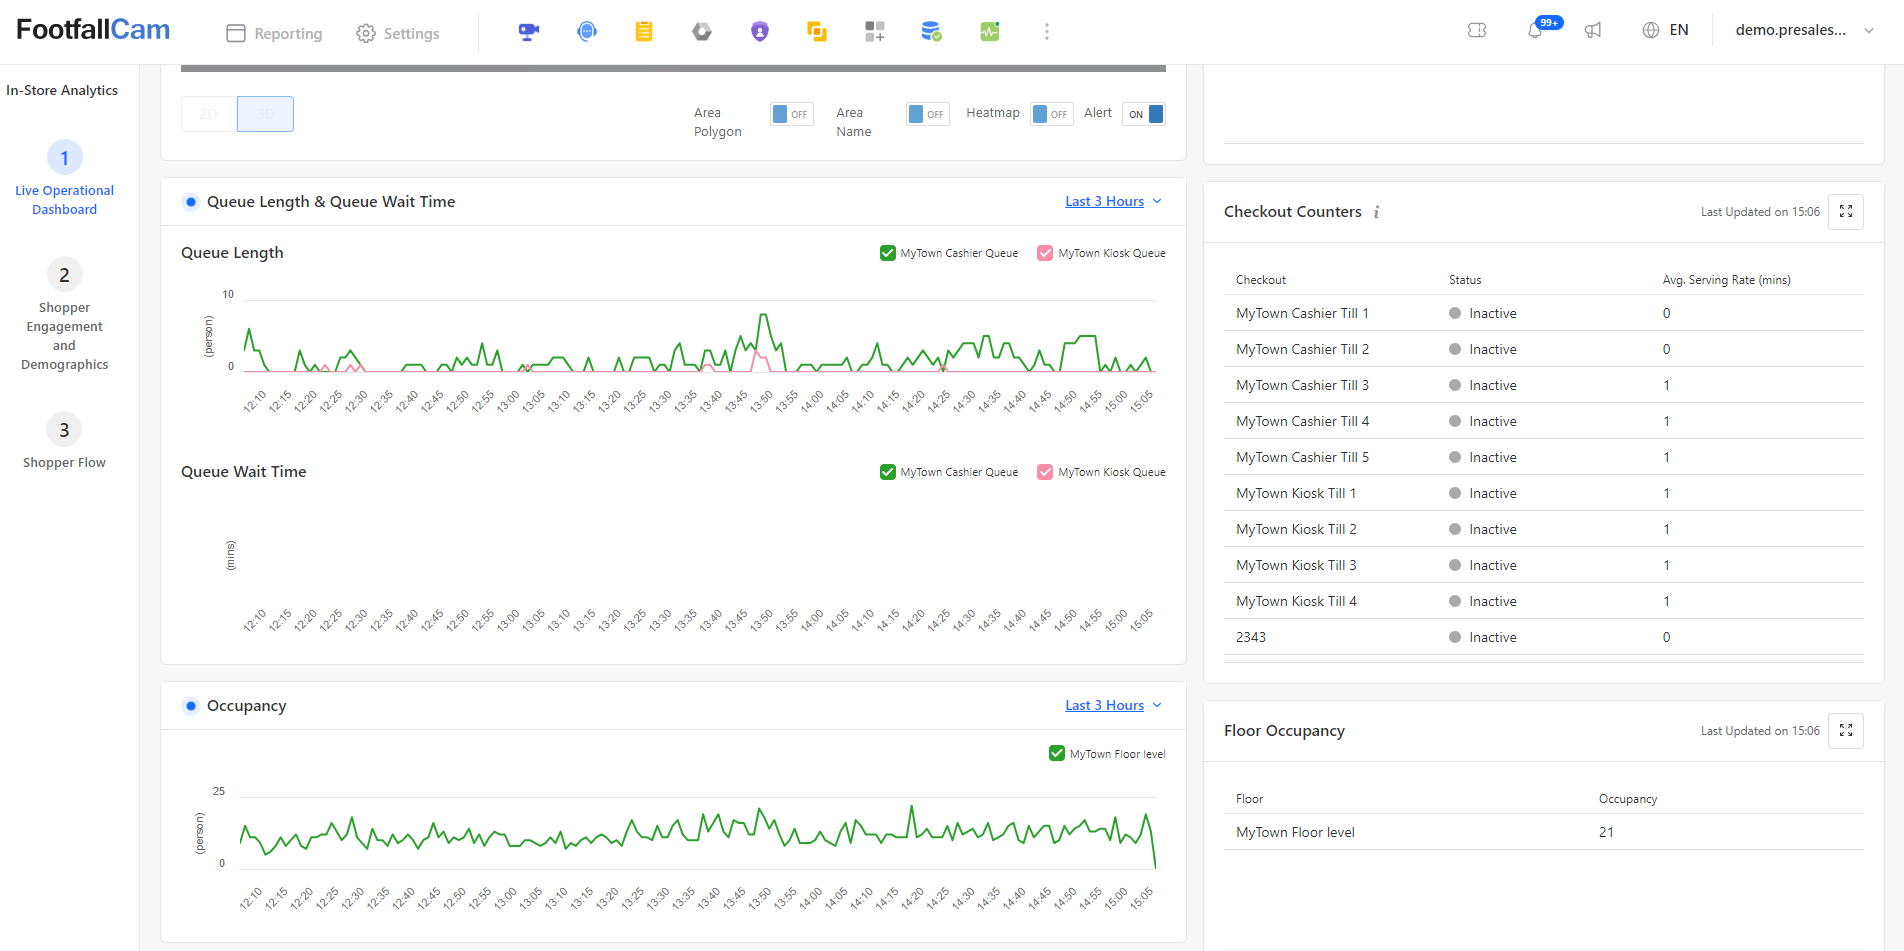
The Live Operational Dashboard provides store operators with real-time visibility into overall store performance, customer movement, and checkout efficiency.
- Live Flow Monitoring & Real-Time Status: Renders an interactive 3D floorplan displaying live movement tracking blobs as customers navigate the store. Active spatial alerts (e.g., Low Stock) appear directly over affected zones, while the Real-Time Status indicator (Normal, Warning, Critical) and Alert Log keep managers updated on immediate operational conditions.
- Queue Performance & Checkout Analytics: Summarizes live queue metrics across cashier counters and kiosk queues--tracking queue length, average wait times, active cashier ratios, and overall status. Detailed trends for Queue Length & Queue Wait Time are plotted over time alongside a breakdown of individual Checkout Counters showing till activity and average serving rates.
- Floor Occupancy Trends: Displays overall store density metrics through live occupancy trend charts and real-time count tables to help manage store capacity and staffing levels.
2.1 Shopper Demographics & Engagement Analytics (Weekly Report)
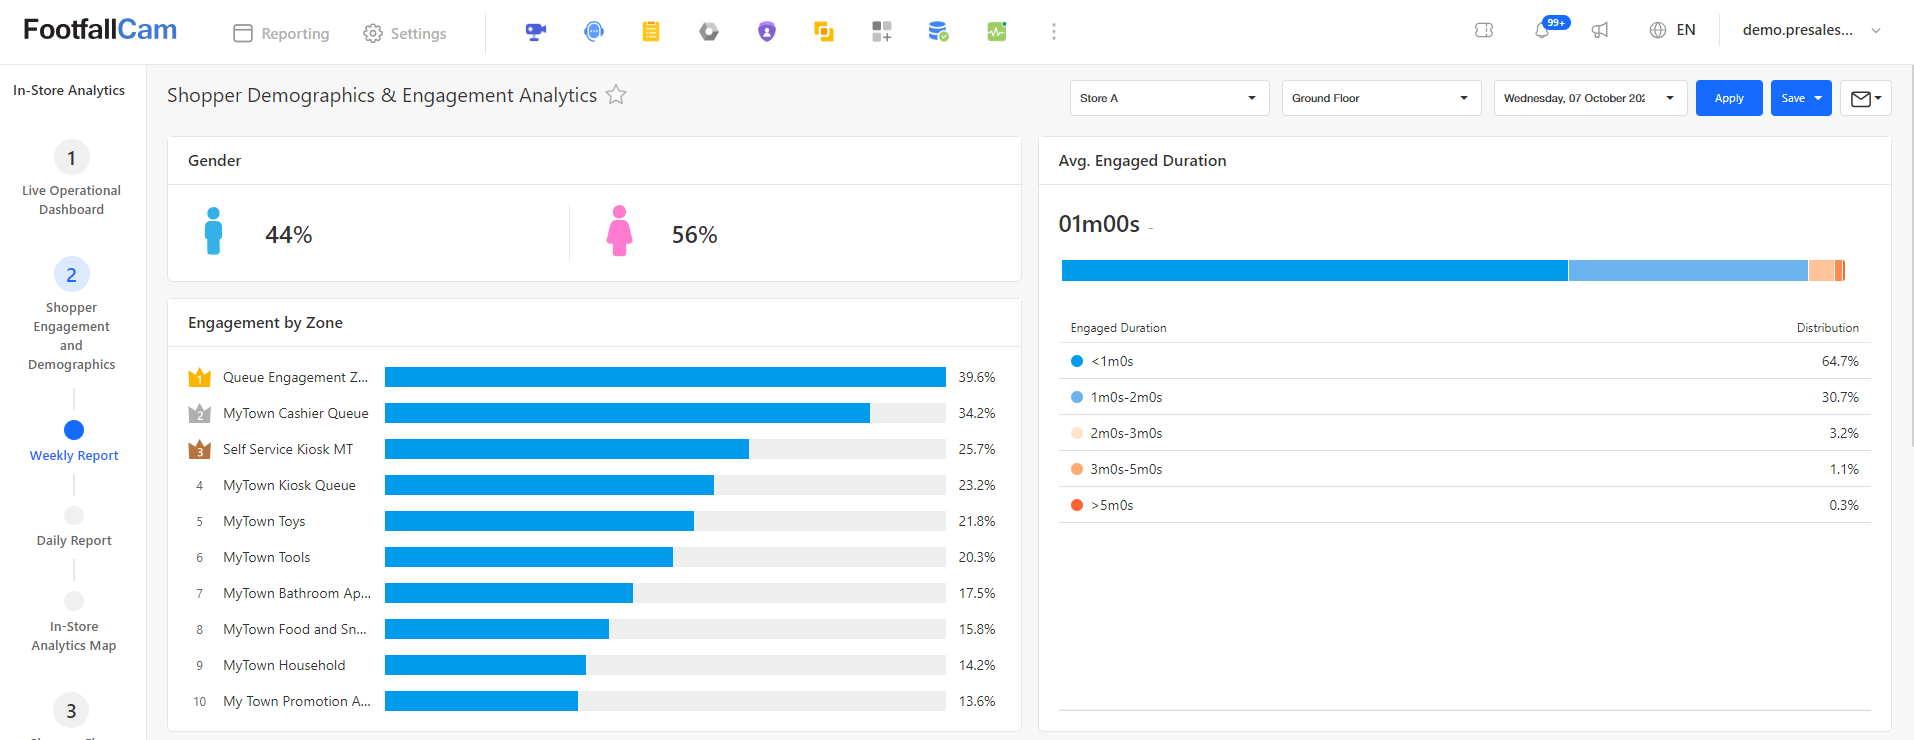
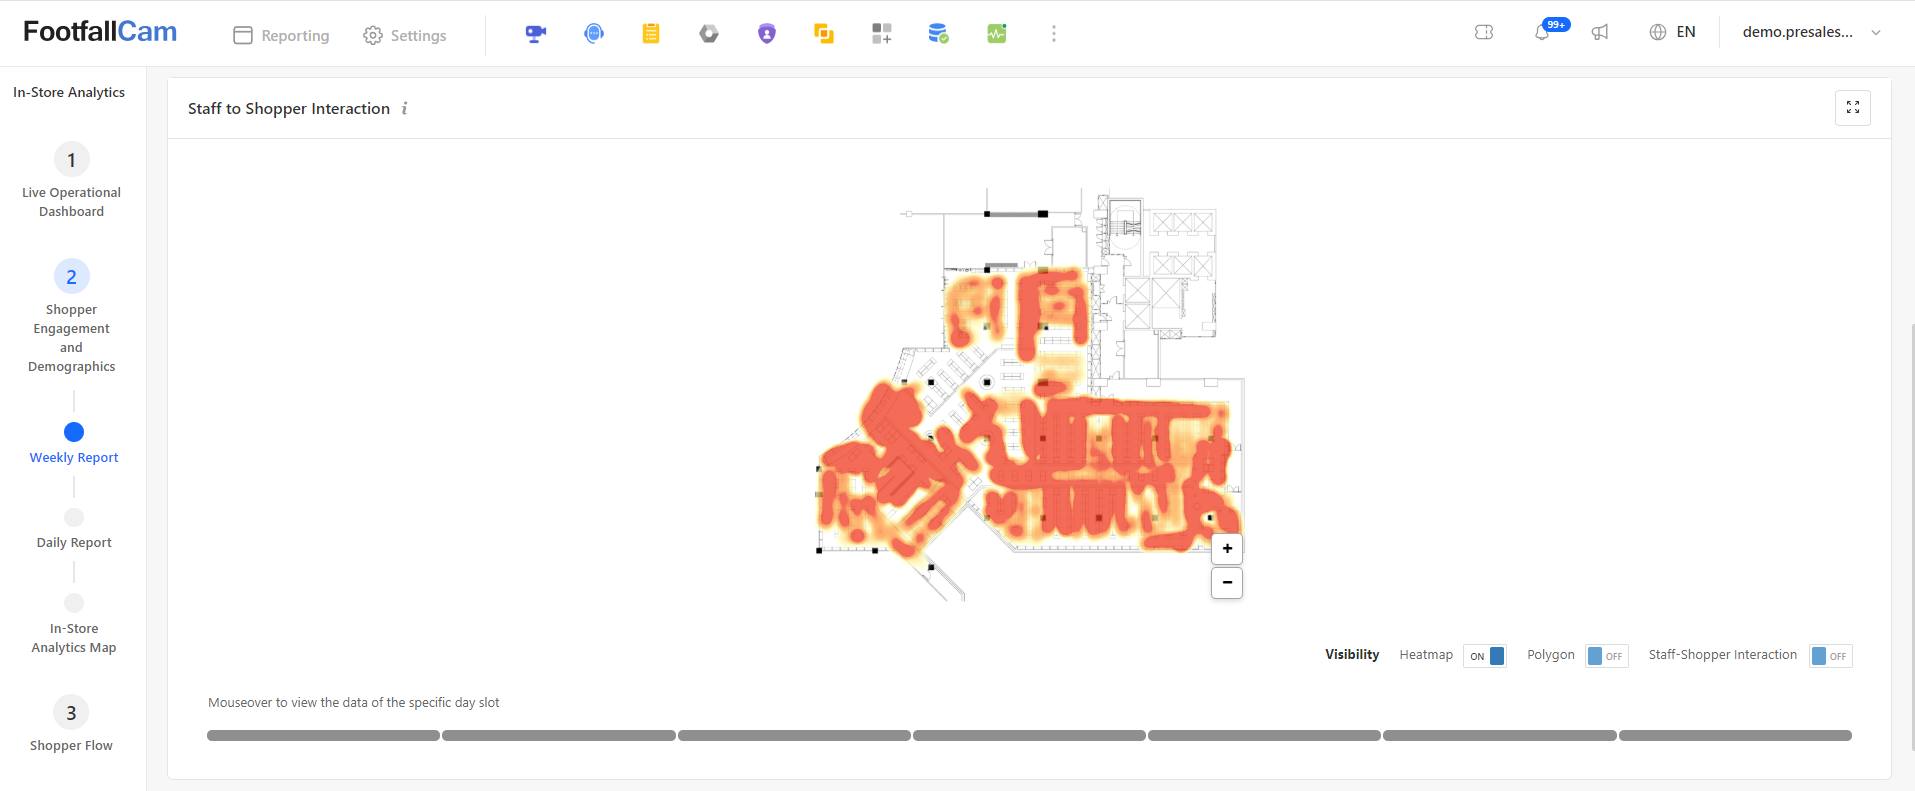
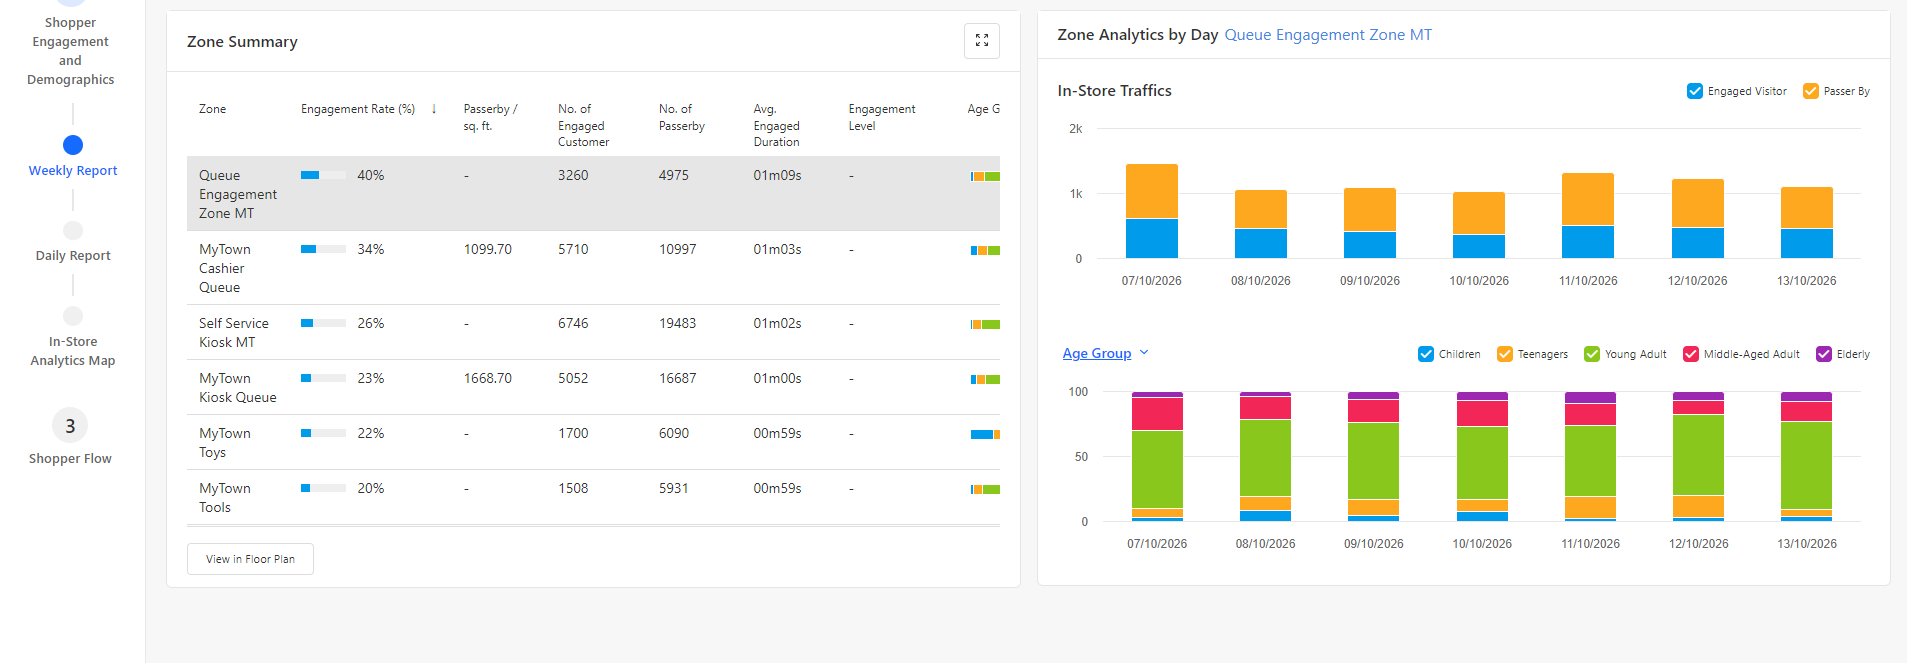
The Shopper Demographics & Engagement Analytics page (Weekly Report) aggregates week-long behavioral metrics, visitor profiles, and spatial engagement patterns across store zones.
- Demographics & Engagement Overview (Top Panel): Displays store-wide weekly demographic splits (Gender breakdown: Male vs. Female percentage) alongside a ranked bar chart for Engagement by Zone. The Avg. Engaged Duration bar chart illustrates overall visitor dwell time distribution across time intervals.
- Staff to Shopper Interaction & Spatial Heatmap (Middle Panel): Renders a weekly aggregate floorplan heatmap showing overall foot traffic intensity and interaction hotspots. Users can toggle visibility layers (Heatmap, Polygon, Staff-Shopper Interaction) and hover or click through the daily timeline scrubber to inspect traffic flow day by day.
- Zone Summary & Daily Breakdown (Bottom Panel): Features a comprehensive Zone Summary grid listing engagement rates, passerby traffic density per sq. ft., engaged customer totals, total passerby count, average dwell time, and age group distributions per zone. Selecting any zone row updates the Zone Analytics by Day charts to show daily foot traffic trends (Engaged Visitors vs. Passerby) and stacked daily demographic breakdowns (Children, Teenagers, Young Adults, Middle-Aged Adults, and Elderly).
2.2 Shopper Engagement Dashboard (Daily Report)
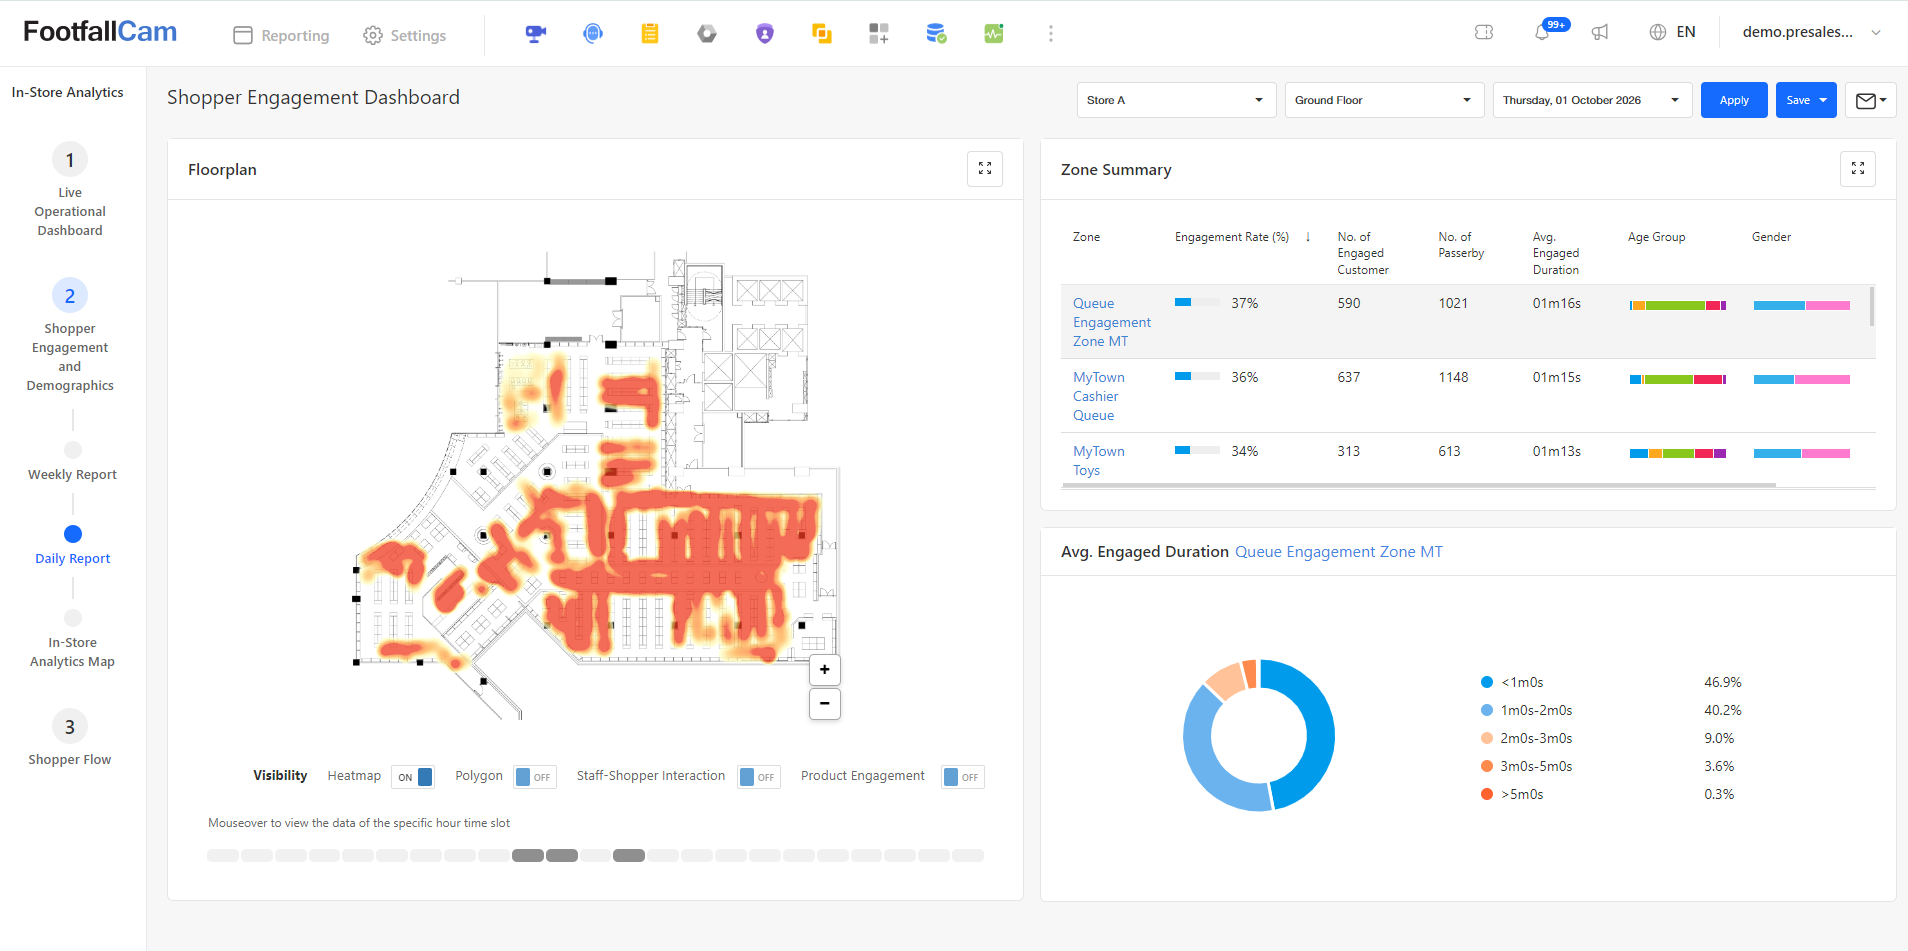
The Shopper Engagement Dashboard (Daily Report) allows store managers and analysts to evaluate single-day customer interactions, dwell times, and spatial activity across store zones.
- Spatial Heatmap & Floorplan (Left Panel): Displays an interactive store floorplan rendered with visual density overlays. Users can toggle visibility options--such as Heatmap, Polygon, Staff-Shopper Interaction, and Product Engagement--and hover or click through the hourly timeline scrubber at the bottom to analyze foot traffic intensity for specific time slots throughout the selected day.
- Zone Performance & Dwell Breakdown (Right Panel): Features a Zone Summary table detailing zone-specific engagement rates, engaged customer counts, total passerby volume, average dwell durations, and demographic distributions (age group and gender). Selecting any zone row updates the Avg. Engaged Duration donut chart to break down customer dwell time for that specific area across duration
3.1 Flow Map
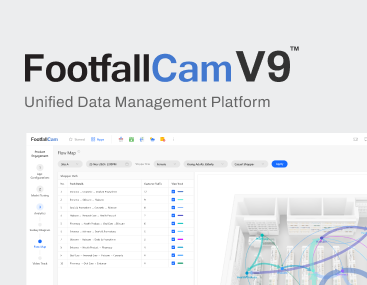
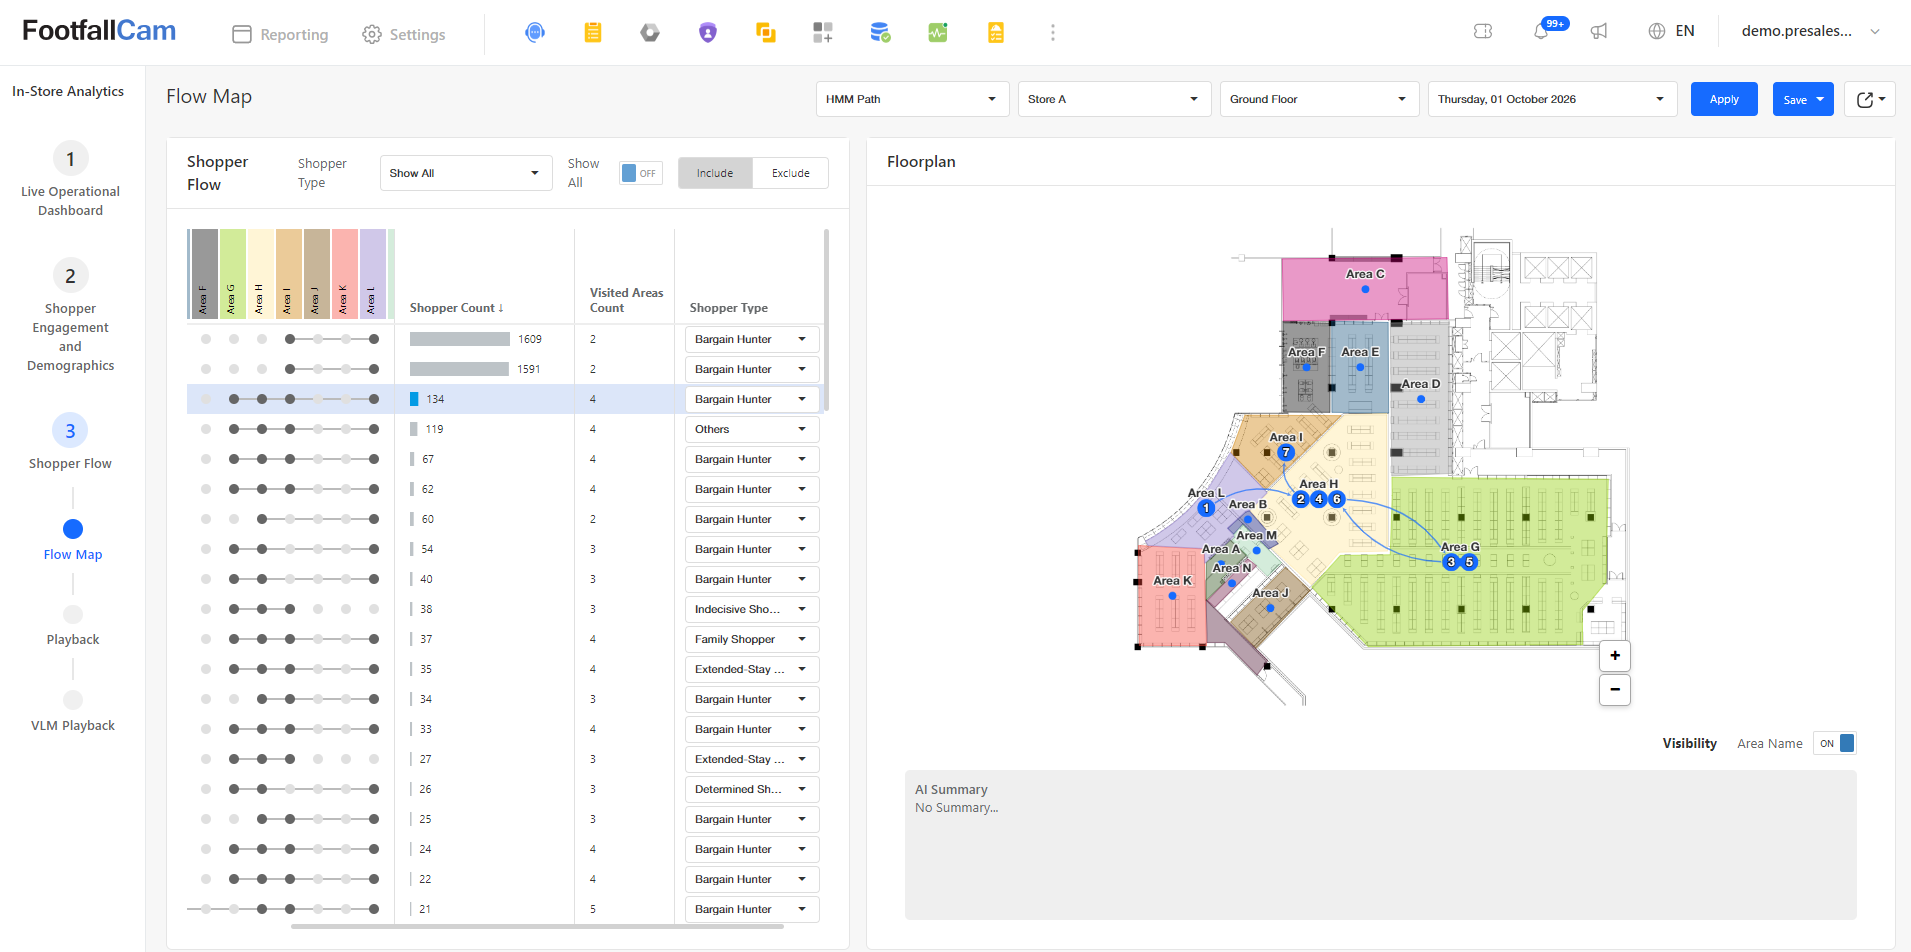
The Flow Map page provides a comprehensive breakdown of visitor movement paths to help analyze customer navigation behavior across the store layout. On the left panel, the Shopper Flow list categorizes all identified navigation paths, sorted in descending order by shopper volume, displaying key metrics such as total shopper counts, visited zone sequences, and classified shopper types (e.g., Bargain Hunter, Family Shopper). Selecting any specific path on the left panel instantly plots and highlights the corresponding flow directly onto the right panel's interactive Floorplan. This visual representation draws directional vector paths complete with sequence indicators between store zones, allowing users to easily trace visitor navigation habits, flow directions, and foot traffic progression throughout the store.
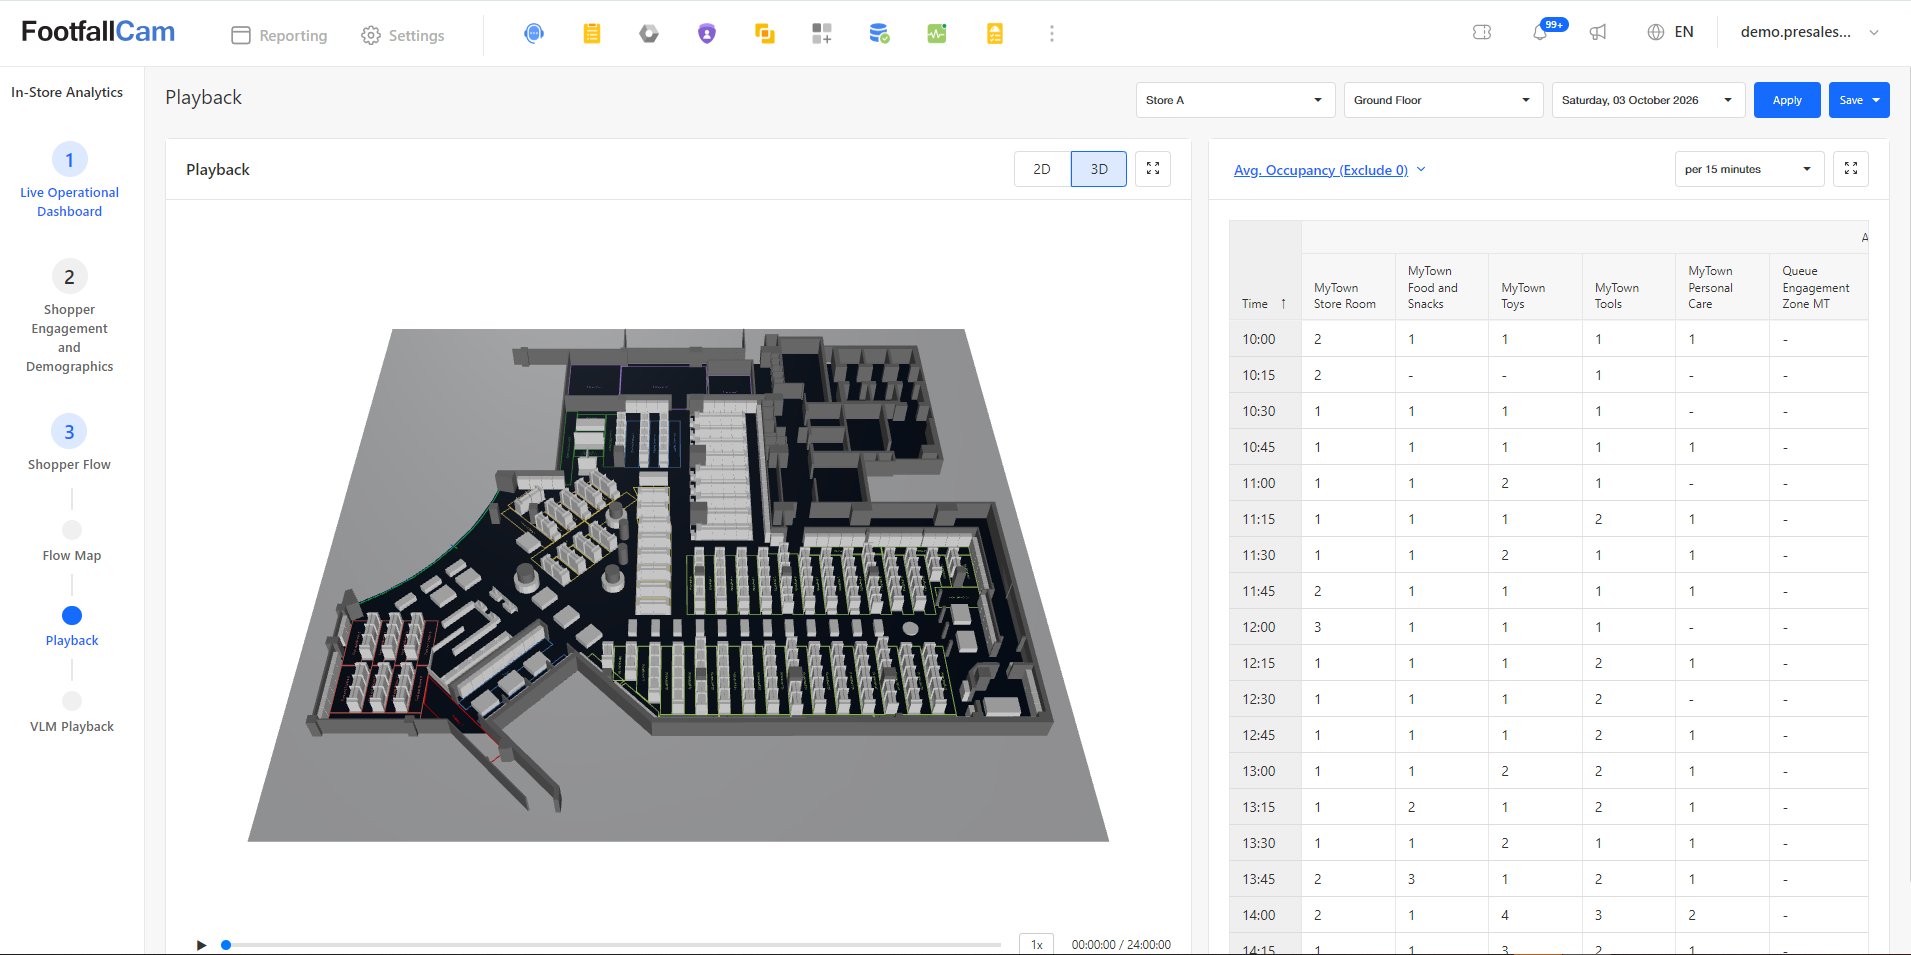
3.2 Playback
The Playback page allows operators to analyze historical foot traffic movement and area density side-by-side. On the left panel, an interactive 3D Floorplan renders live tracking blobs synchronized with the timeline player, enabling users to visually replay foot traffic flow and customer spatial movement across the store layout at any given moment. On the right panel, an occupancy breakdown grid displays average count metrics across specific store zones at a 15-minute granularity (e.g., store rooms, sales aisles, and engagement zones), making it easy to correlate visual movement patterns with precise area occupancy trends over time
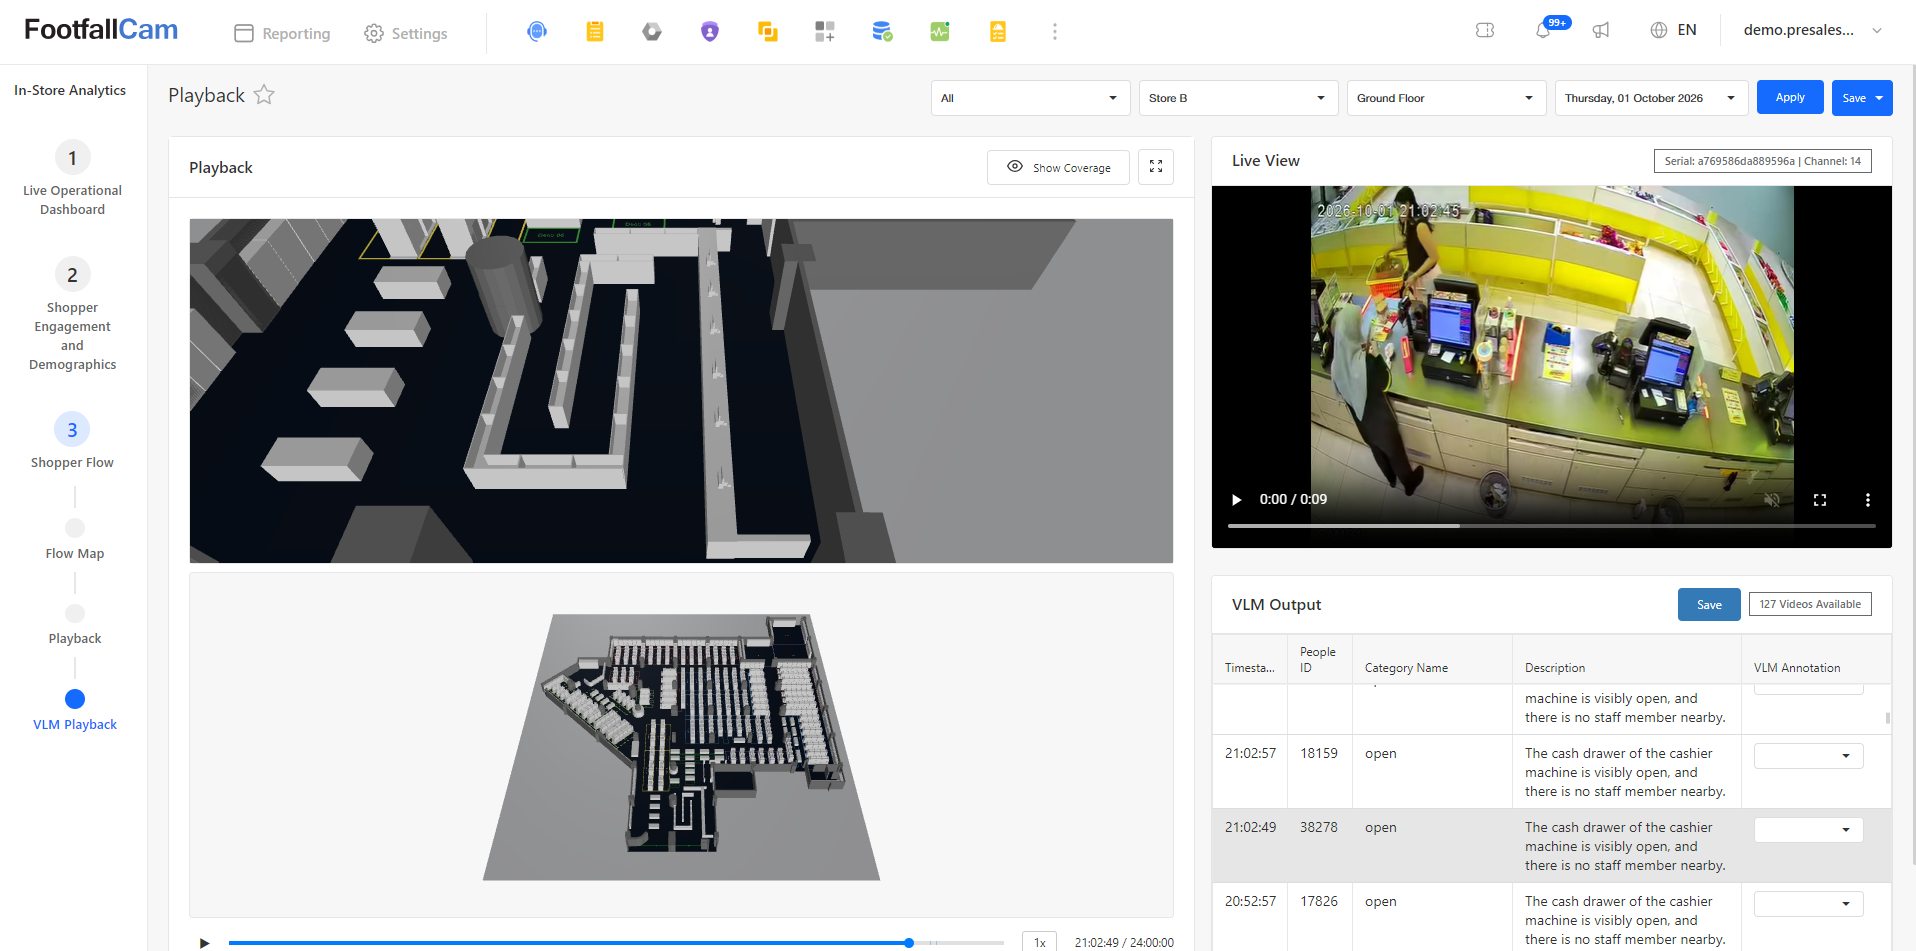
3.3 VLM Playback
To review and verify flagged incidents, click on the system notification in the top right header to open the alert panel and select the incident alert. This directs you to the VLM Playback page, where selecting a specific incident entry from the VLM Output table on the bottom right automatically syncs the interface to that timestamp. The Live View video player on the right plays back the recorded video footage, while the 3D Floorplan on the left dynamically highlights the event location using a 3D coverage view and live position blob. This dual-perspective setup allows you to visually verify the exact store location and surroundings of the event to quickly determine whether it is a true incident or a false alarm.
4.1 Shelf Engagement
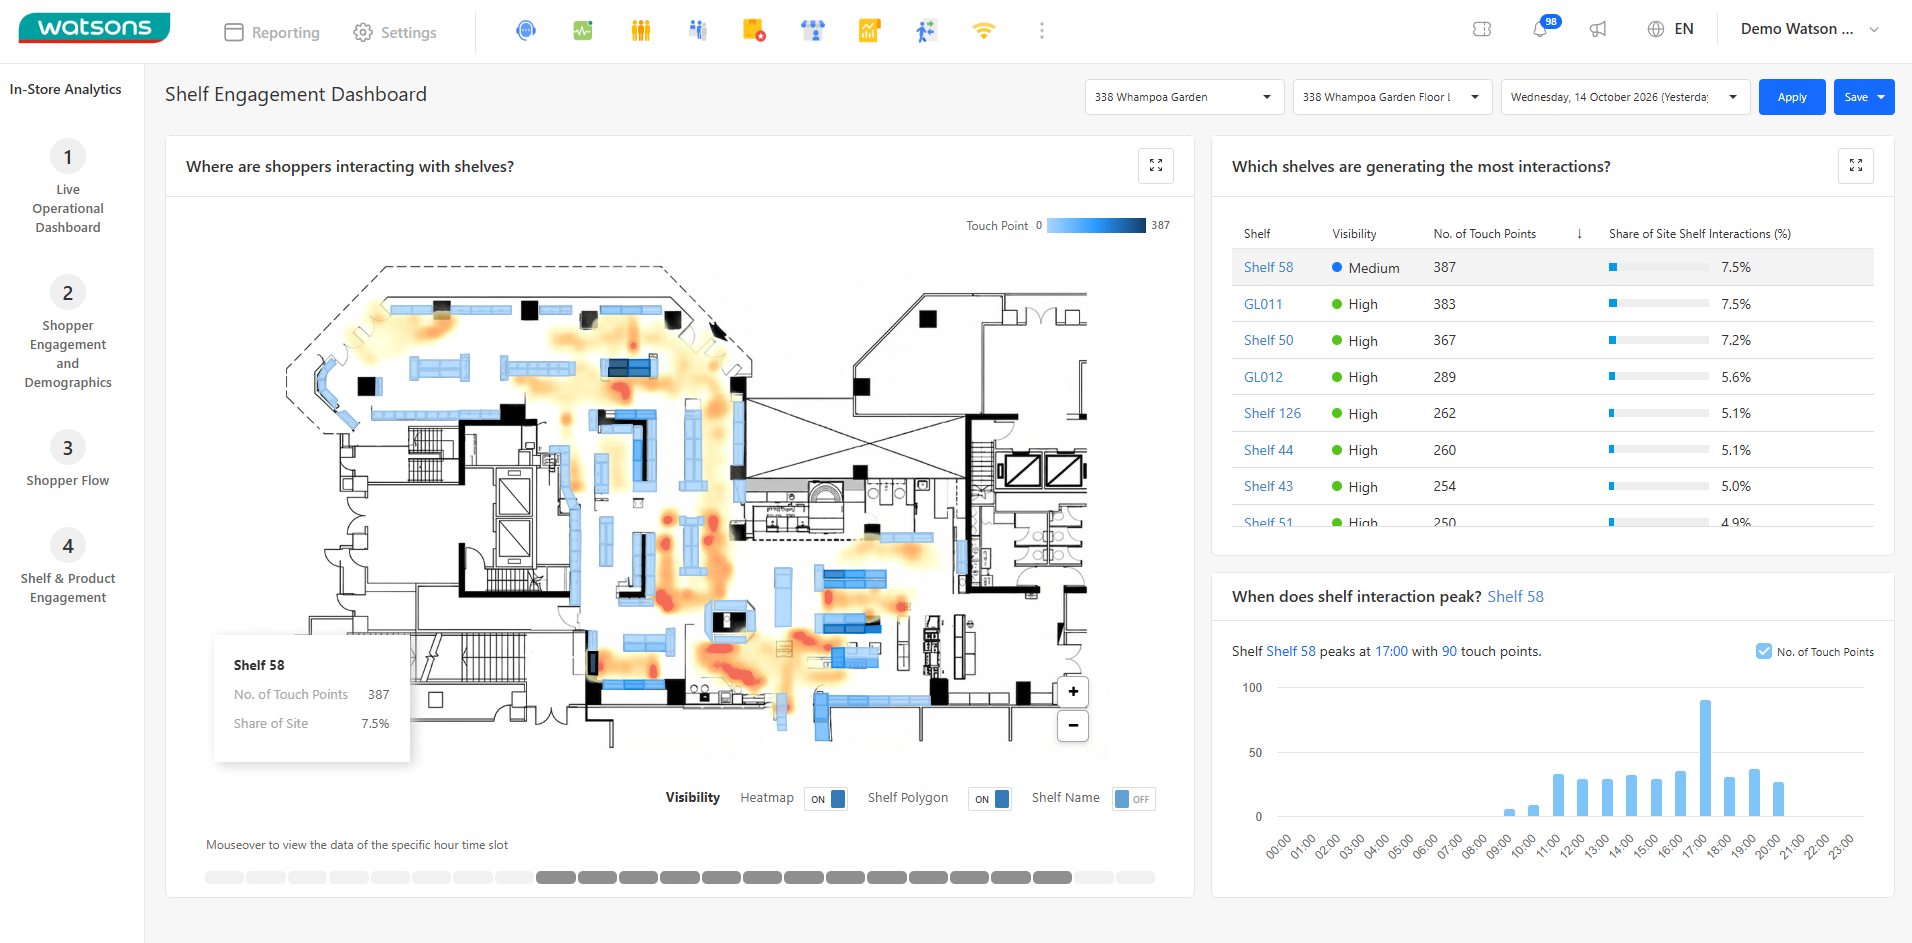
The Shelf Engagement Dashboard allows store planners and category managers to analyze micro-level customer interactions, physical shelf touches, and hourly engagement peaks across all fixture units.
- Spatial Shelf Heatmap (Left Panel): Features an interactive store floorplan with shelf polygon color grading--where darker blue shading represents a higher number of touch points and lighter shades indicate lower interaction. Hovering over any shelf or scrubbable hourly time slot reveals a quick summary popover (e.g., Shelf 58: 387 Touch Points, 7.5% Share of Site). Toggles allow users to switch Heatmap, Shelf Polygon, and Shelf Name layers on or off.
- Top Performing Shelves Summary (Top Right Panel): Ranks shelf units under "Which shelves are generating the most interactions?" displaying key performance metrics--including Shelf Name, Visibility Grade (High/Medium), total No. of Touch Points, and Share of Site Shelf Interactions (%).
- Hourly Interaction Peaks (Bottom Right Panel): Displays an hourly bar chart under "When does shelf interaction peak?" for the selected shelf unit. Automatically highlights the peak activity window (e.g., Shelf 58 peaks at 17:00 with 90 touch points) to help correlate customer engagement with staffing and product restocking schedules.
4.2 Product Engagement
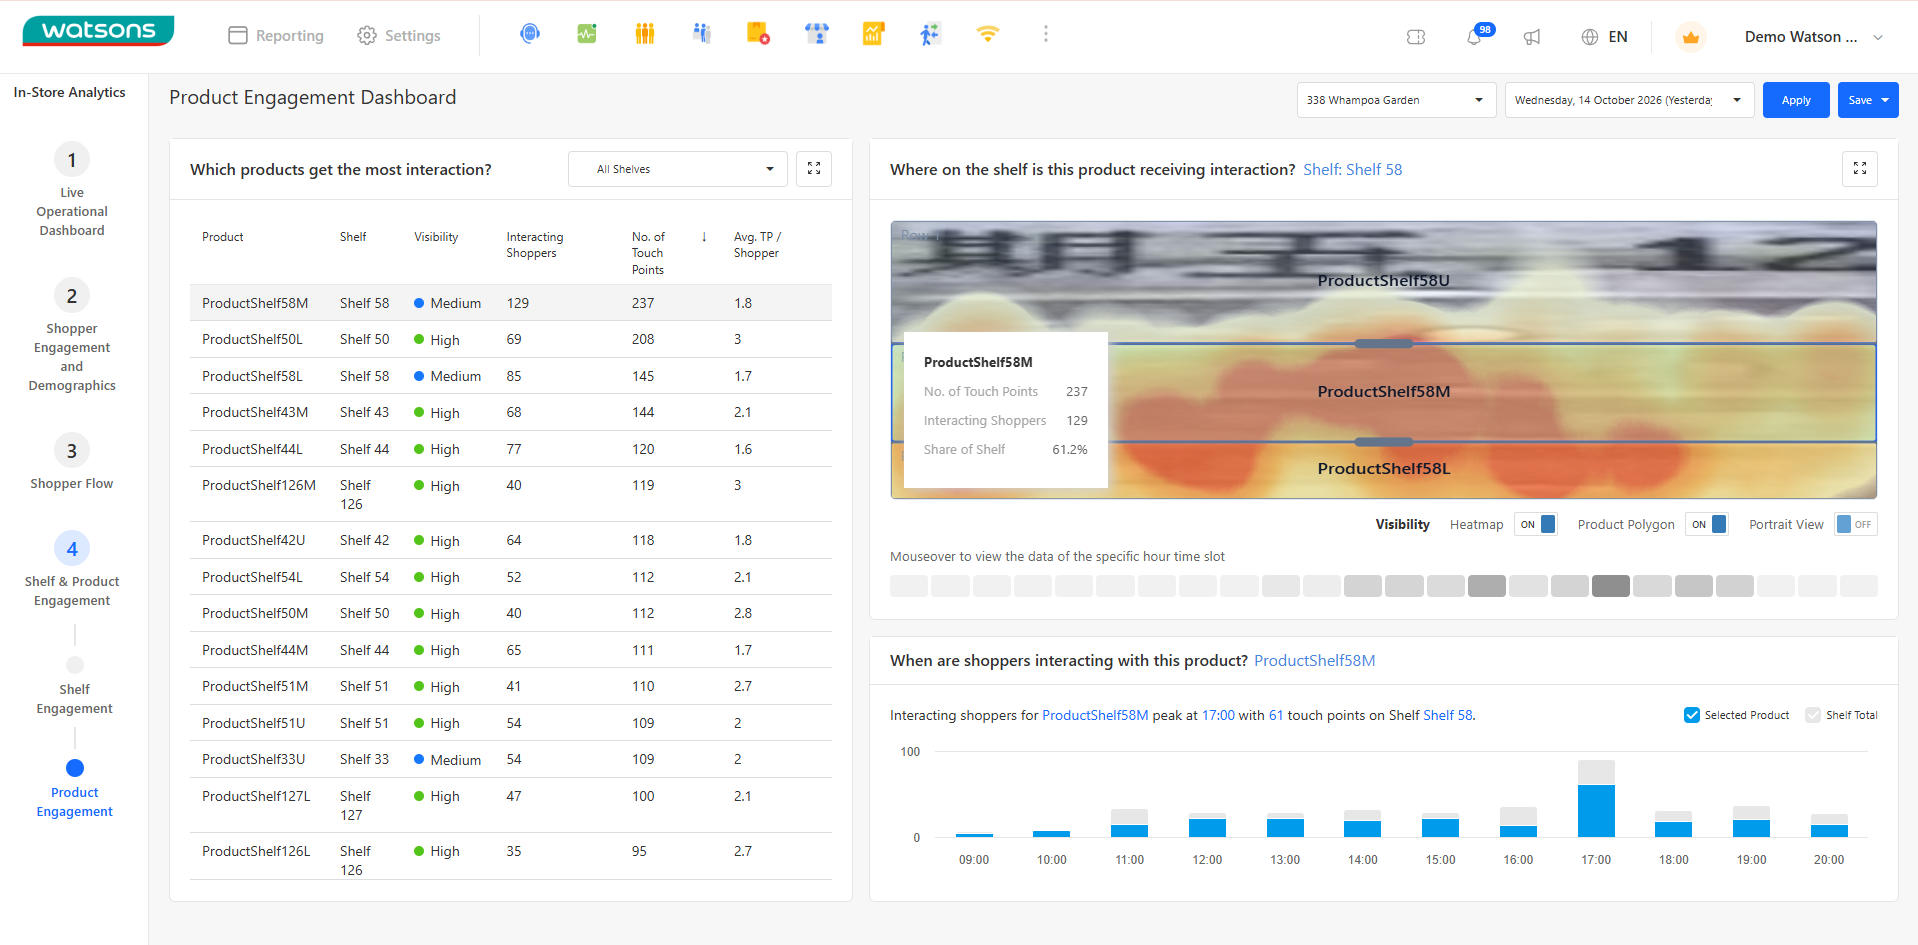
The Product Engagement Dashboard provides category managers and merchandisers with item-level engagement insights, planogram interaction heatmaps, and hourly touch distribution for individual SKUs.
- Product Interaction Performance (Left Panel): Ranks items under "Which products get the most interaction?"--displaying essential SKU-level metrics including Product Name, assigned Shelf Location, Visibility Grade, Interacting Shoppers, total No. of Touch Points, and Avg. TP / Shopper (average touch points per customer).
- Rectified Shelf Planogram Heatmap (Top Right Panel): Visualizes precise physical contact zones on the shelf face under "Where on the shelf is this product receiving interaction?". Renders a rectified planogram image overlaid with an interactive interaction heatmap. Hovering over product polygons displays detailed popovers showing specific item touch counts, unique shopper numbers, and share-of-shelf percentage. Visibility toggles allow toggling Heatmap, Product Polygon, and Portrait View.
- Hourly Product Interaction Trends (Bottom Right Panel): Displays an hourly bar chart under "When are shoppers interacting with this product?" for the selected item. Highlights peak engagement times (e.g., Interacting shoppers peak at 17:00 with 61 touch points) and allows comparing selected product touches against total shelf activity.