











1. What is Uptime 360?
Uptime 360 is a centralised monitoring application that provides an overview of the health and availability of FootfallCam devices, sites, servers, and related services.
It allows users to quickly identify potential issues such as offline devices, missing data, server incidents, device readiness issues, and other operational problems from a single platform.
The application is divided into several sections, including Overview, Site Health, Device Health, Server Health, and Uptime Notification List, allowing users to monitor different aspects of the system efficiently.
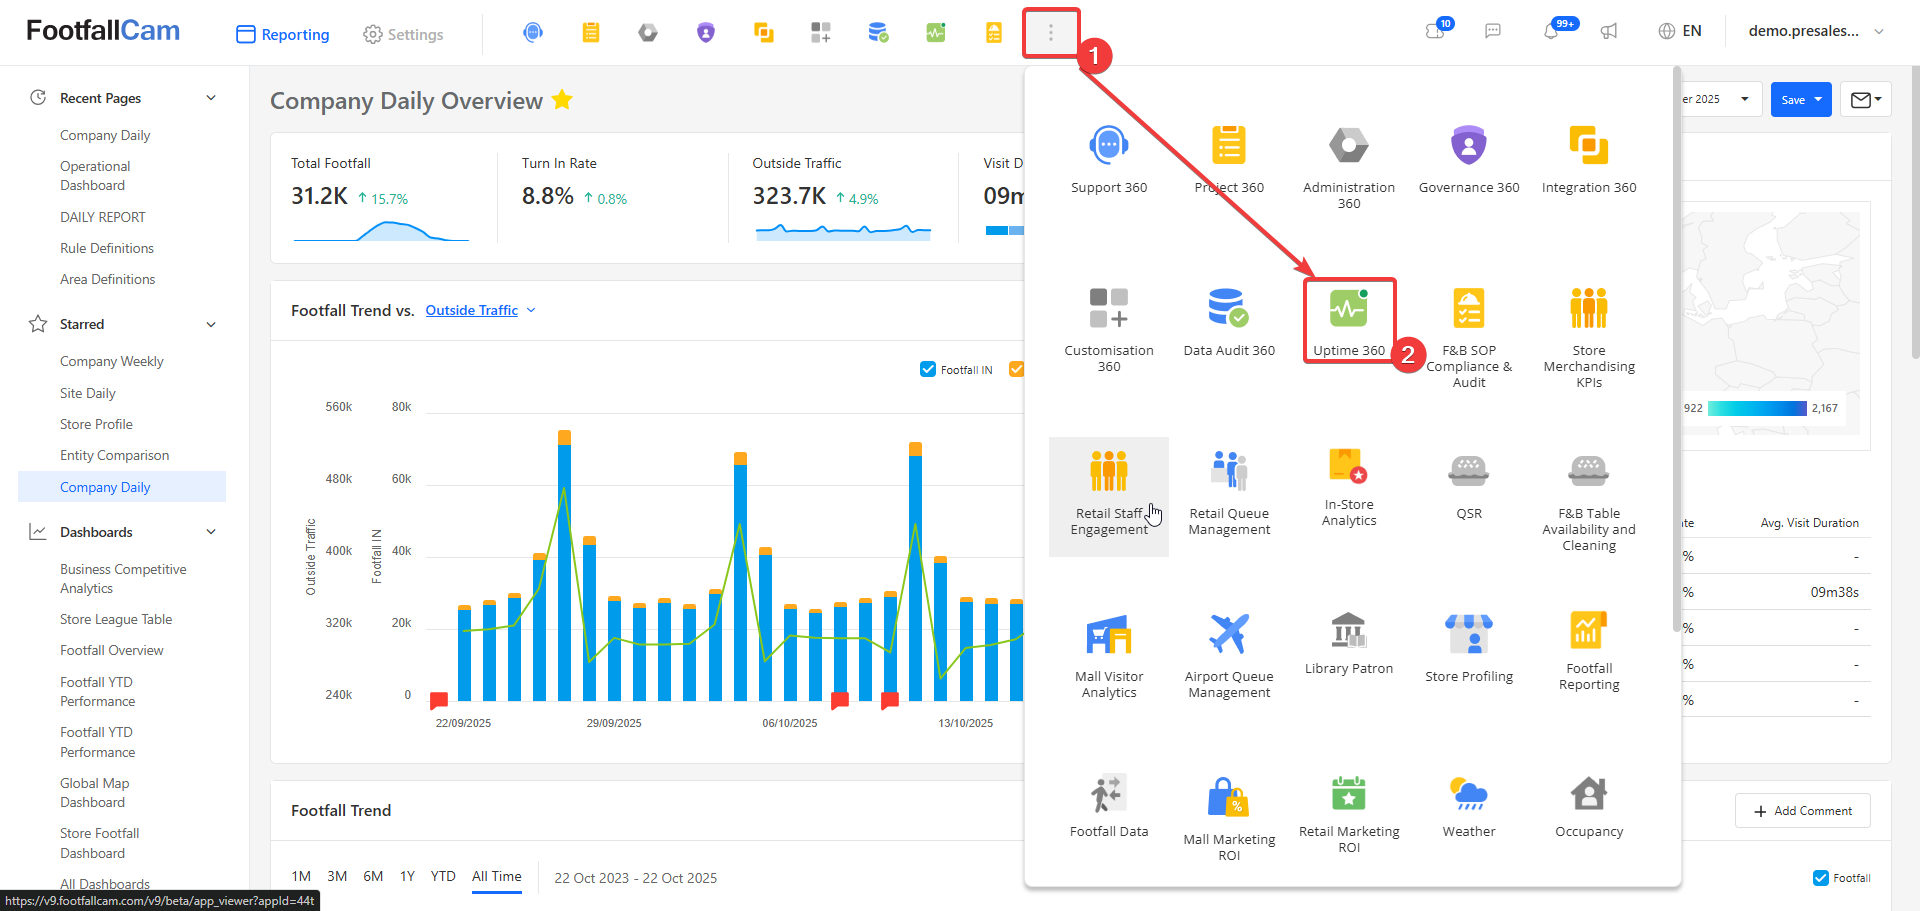
2. Features
Uptime 360 includes the following features:
- Overview - Provides a high-level view of the current system status and monitored services.
- Site Health - Allows users to review the data integrity and health of individual sites.
- Device Health - Provides detailed information about devices, including device status, profiles, and readiness.
- Server Health - Allows users to monitor server-related incidents and service health.
- Uptime Notification List - Displays notifications generated when devices or services experience availability issues.
2.1 Overview
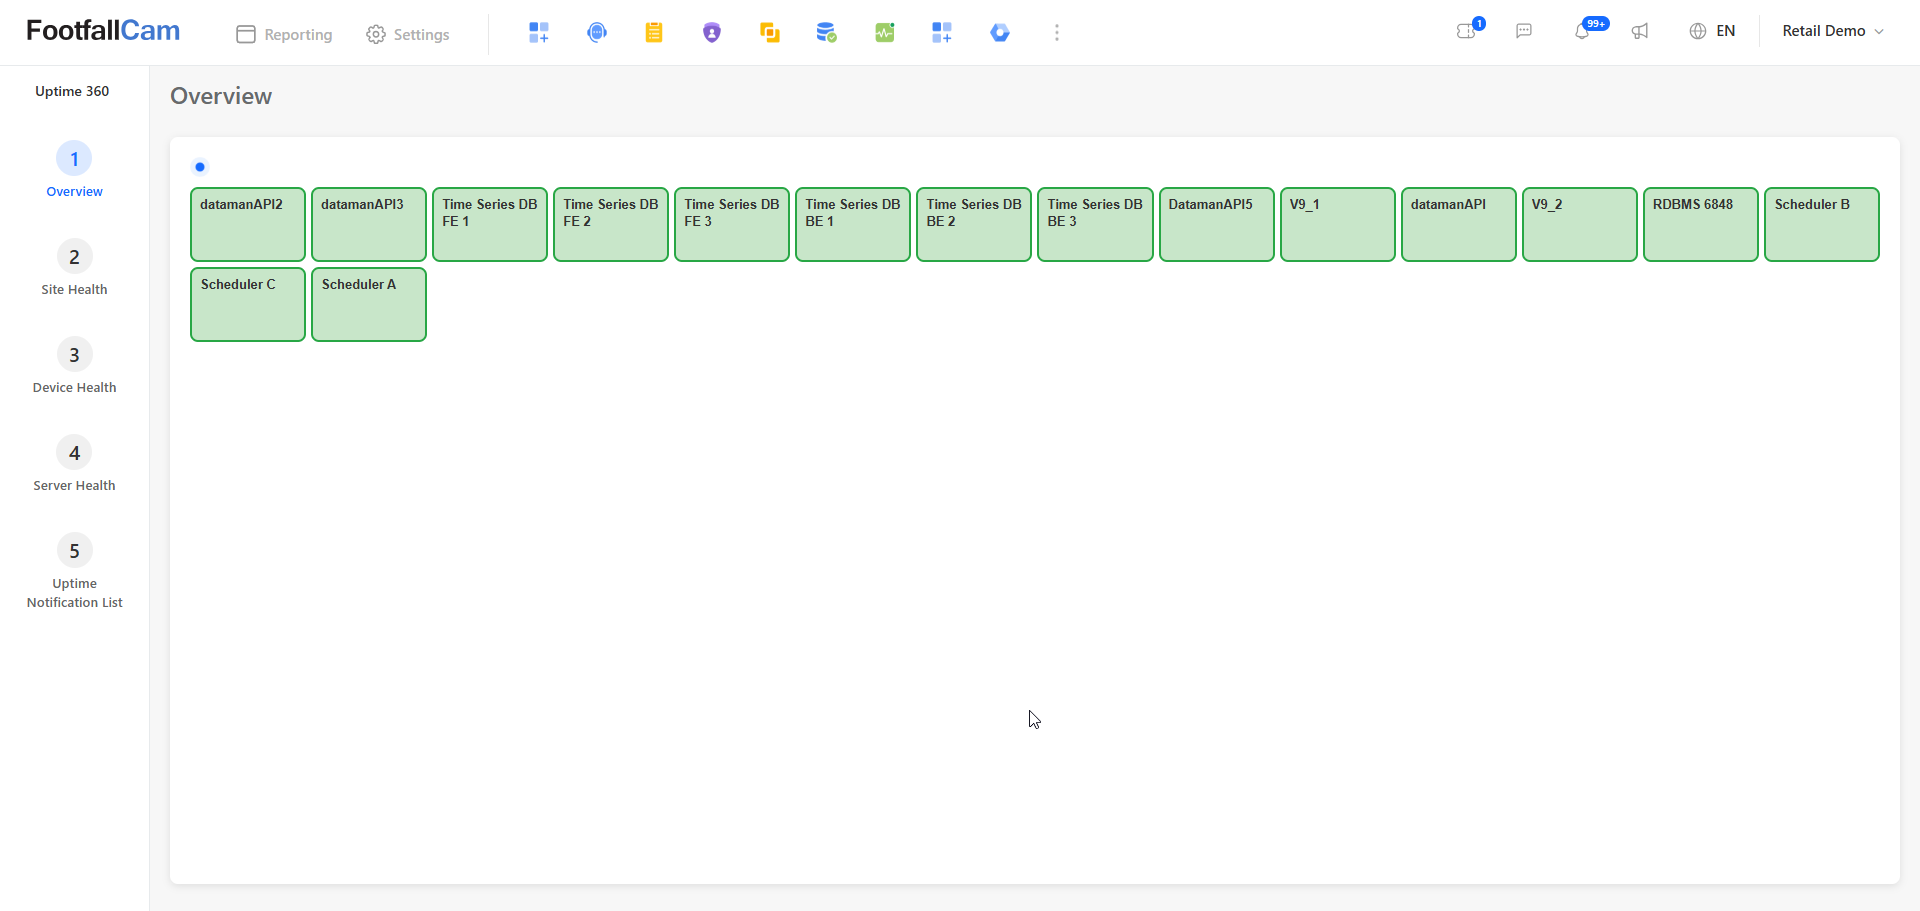
The Overview page provides a visual summary of the services being monitored by Uptime 360.
Users can access this page by selecting Overview from the left navigation menu.
The page displays monitored services such as Data Manager APIs, Time Series databases, V9 services, databases, schedulers, and other system components.
Each service is represented as a status indicator, allowing users to quickly identify whether the monitored components are operating normally.
Understanding the Overview
The Overview page can be used as the first point of reference when checking the overall health of the system.
Users can:
- View the status of monitored services.
- Identify services that may require attention.
- Quickly determine whether a particular system component is operating normally.
- Use the detailed sections under Site Health, Device Health, and Server Health for further investigation.
2.2 Site Health
The Site Health section provides information about the health and data integrity of monitored sites.
Select Site Health from the left navigation menu to access the available site health information.
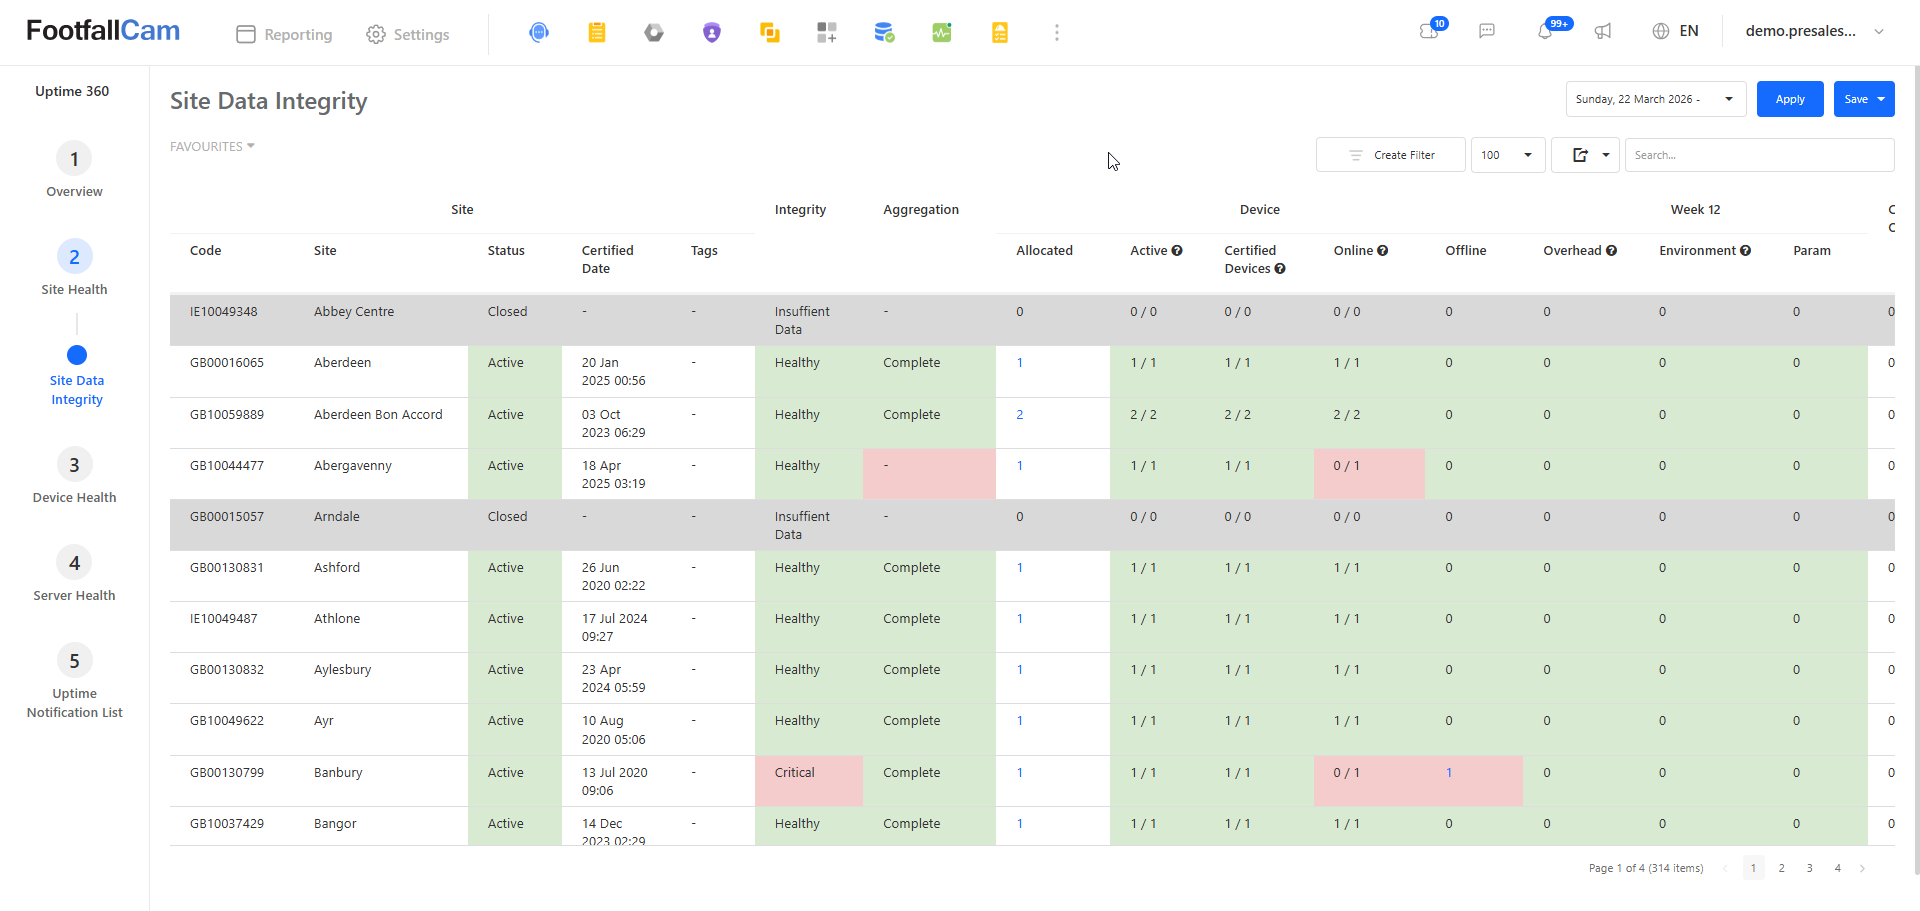
One of the available views is Site Data Integrity, which allows users to review the status of sites and identify potential data or device-related issues.
Site Data Integrity
The Site Data Integrity page displays information for each site, including:
- Site Code
- Site Name
- Site Status
- Certified Date
- Tags
- Integrity
- Aggregation
- Allocated Devices
- Active Devices
- Certified Devices
- Online Devices
- Offline Devices
- Overhead
- Environment
- Parameter status
The information is presented in a table, allowing users to review multiple sites at the same time.
Understanding the Status
The page uses different indicators to help users identify potential issues.
For example:
- Healthy - The site or corresponding component is operating normally.
- Complete - The expected aggregation or data processing is complete.
- Insufficient Data - There may not be sufficient data available for the site.
- Critical - The site or component requires attention.
- Online / Offline - Indicates the current connectivity status of the device.
Users can review the affected row to identify which site or component requires further investigation.
2.3 Device Health
The Device Health section provides detailed information about FootfallCam devices.
It can be used to monitor device connectivity, device configuration, device readiness, and other device-related information.
The Device Health section includes:
- Device Overview
- Device Profiles
- Device Readiness
2.3.1 Device Overview
The Device Overview page provides a summary of the current device and camera status.
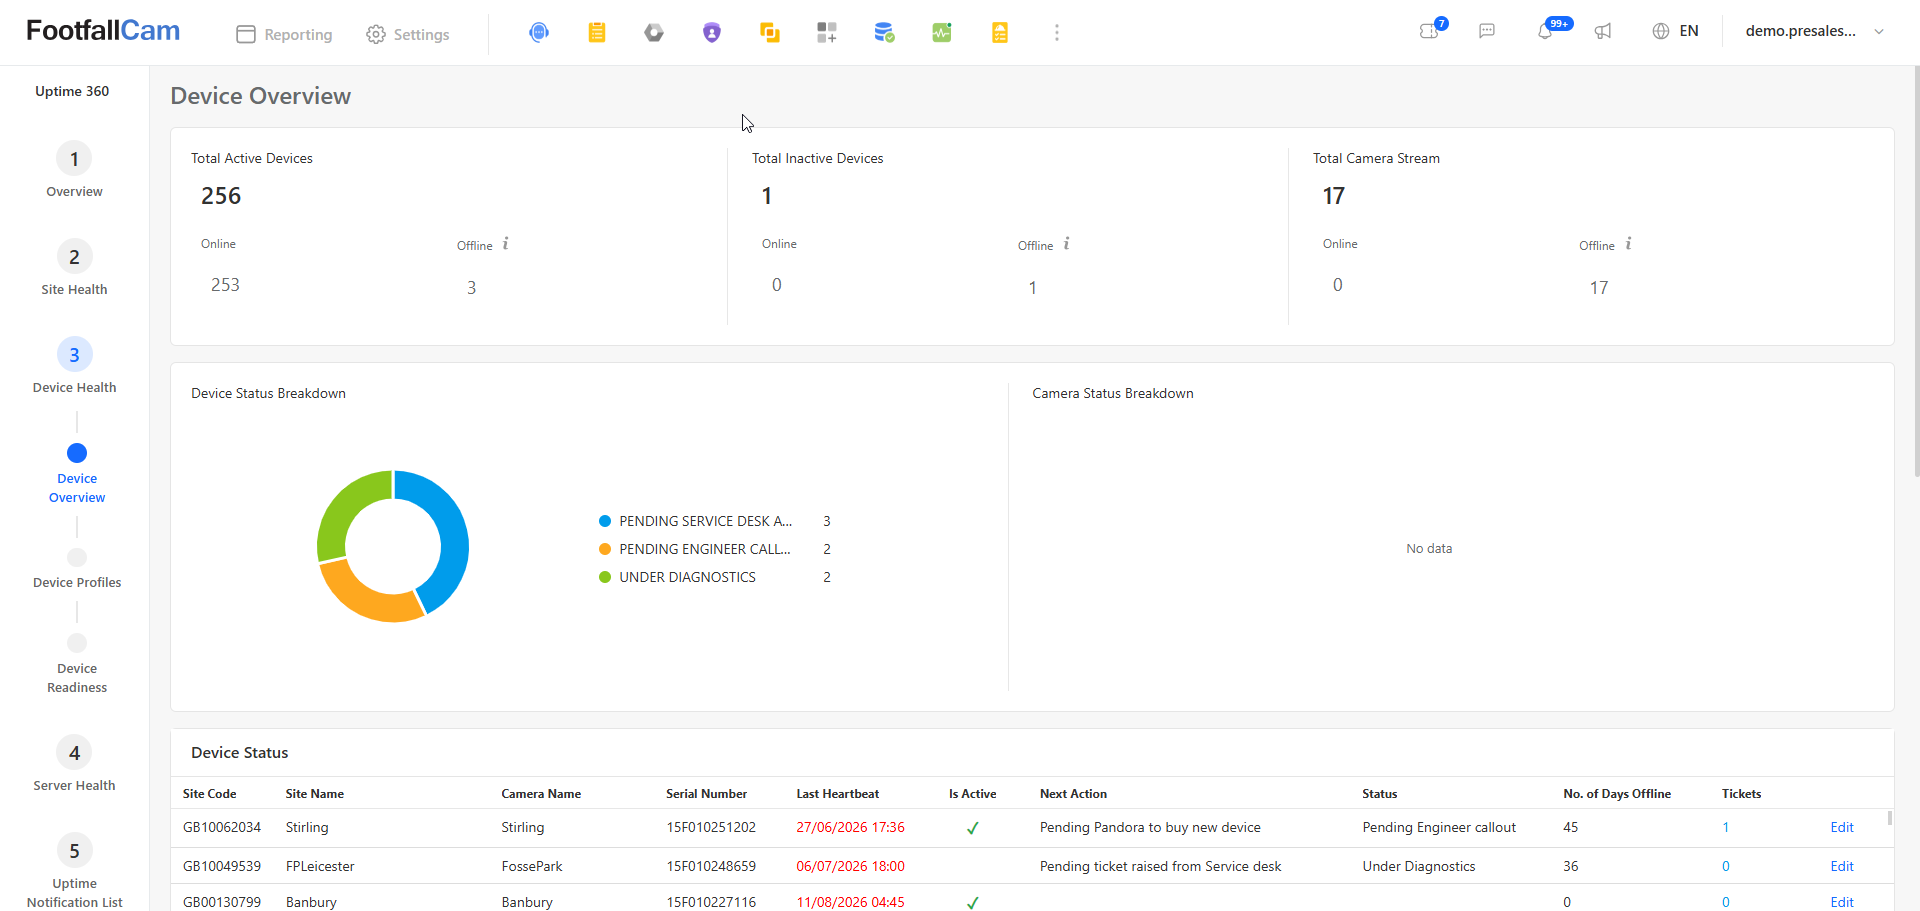
At the top of the page, users can view summary information such as:
- Total Active Devices
- Total Inactive Devices
- Total Camera Stream
The online and offline counts are displayed under the relevant categories.
For example, the dashboard can show the number of active devices that are currently online or offline, as well as the number of camera streams that are unavailable.
Device Status Breakdown
The Device Status Breakdown section provides a visual representation of devices that require attention.
The chart categorises devices according to their current status, such as:
- Pending Service Desk Action
- Pending Engineer Callout
- Under Diagnostics
This allows users to quickly understand how many devices are currently associated with each operational status.
Camera Status Breakdown
The Camera Status Breakdown section provides an overview of camera stream status.
If there is no available camera status information, the page will display No data.
Device Status
The Device Status table provides more detailed information about individual devices.
The table may include:
- Site Code
- Site Name
- Camera Name
- Serial Number
- Last Heartbeat
- Active Status
- Next Action
- Status
- Number of Days Offline
- Tickets
Users can use this table to identify devices that have stopped communicating or require follow-up action.
Identifying Offline Devices
Pay particular attention to the Last Heartbeat and No. of Days Offline columns.
A device with an old Last Heartbeat timestamp or a non-zero number of offline days may require investigation.
The Next Action and Status columns can also be used to determine whether an existing support or engineering action is already in progress.
2.3.2 Device Profiles
The Device Profiles page provides information about devices and their assigned configurations.
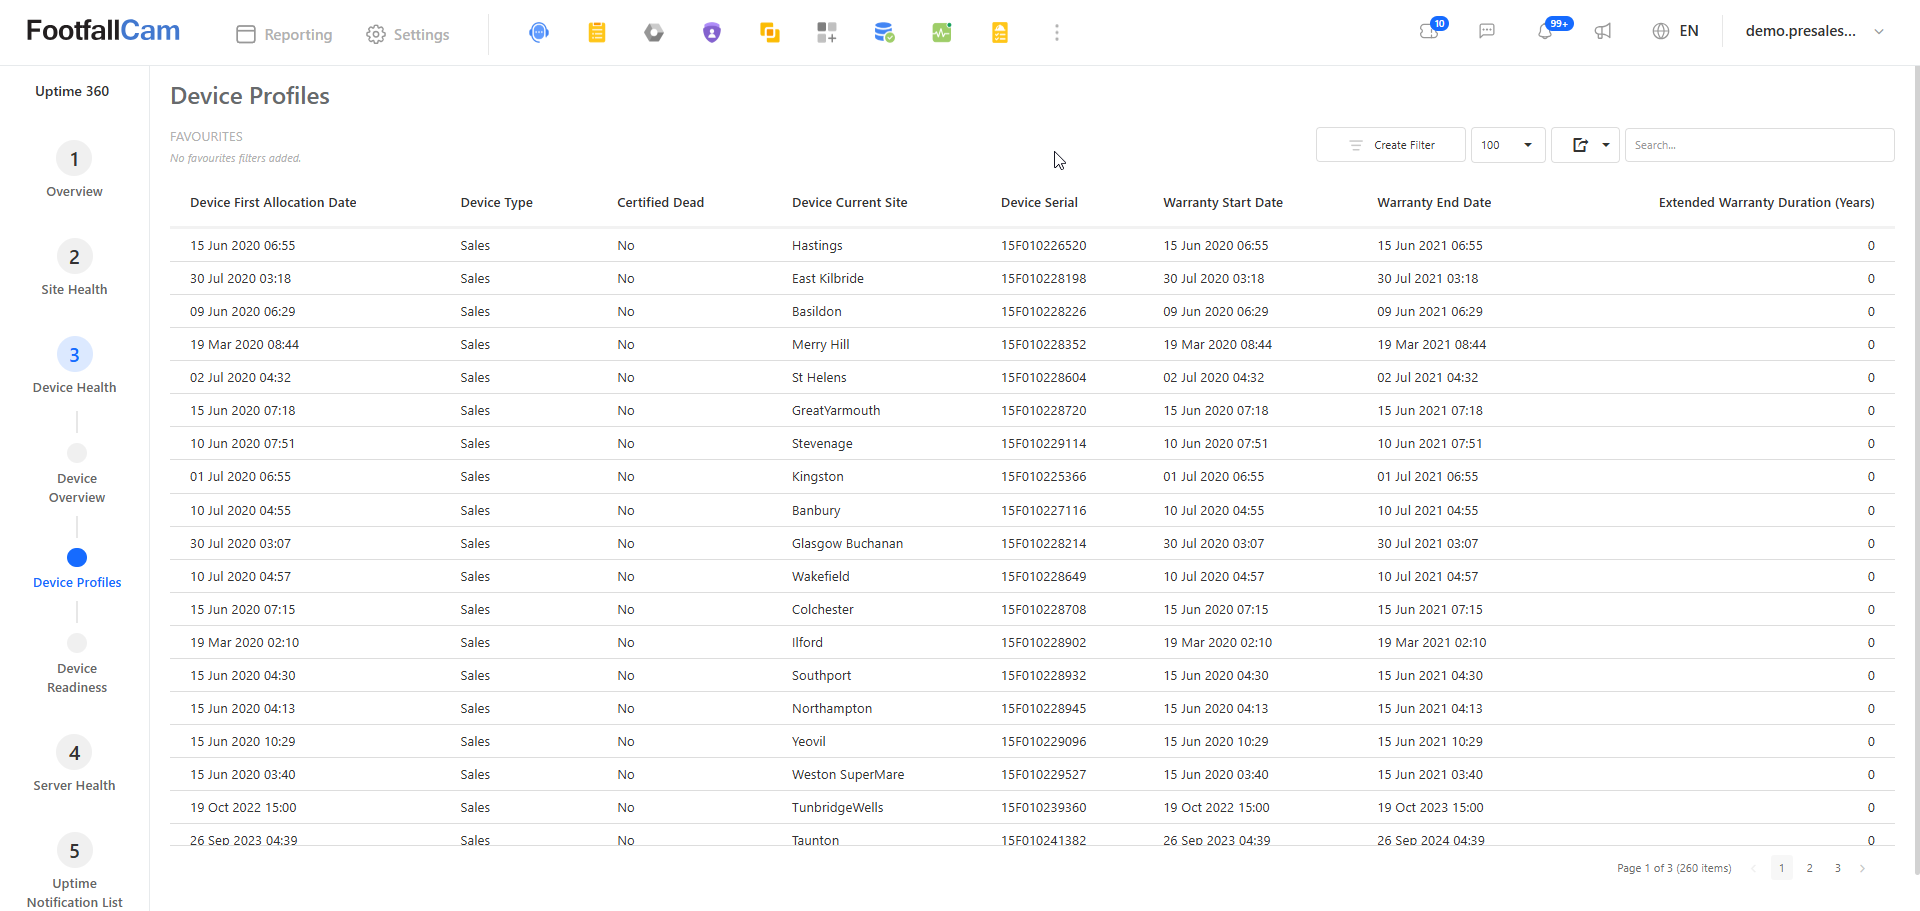
The page displays device information such as:
- Device First Allocation Date
- Device Type
- Certified Dead
- Device Current Site
- Device Serial
- Warranty Start Date
- Warranty End Date
- Extended Warranty Duration
This information can be used to review device allocation and warranty-related information.
Searching for a Device
To locate a specific device:
Step 1 - Open Device Health from the left navigation menu.
Step 2 - Select Device Profiles.
Step 3 - Use the Search field at the top-right of the page.
Step 4 - Enter the relevant device information, such as the device serial number or site.
Step 5 - Review the matching device record.
Filtering Device Profiles
Users can also use Create Filter to filter the device profile list according to the required criteria.
The number of records displayed per page can also be adjusted using the page-size selector.
2.3.3 Device Readiness
The Device Readiness page provides a detailed view of device operational readiness.
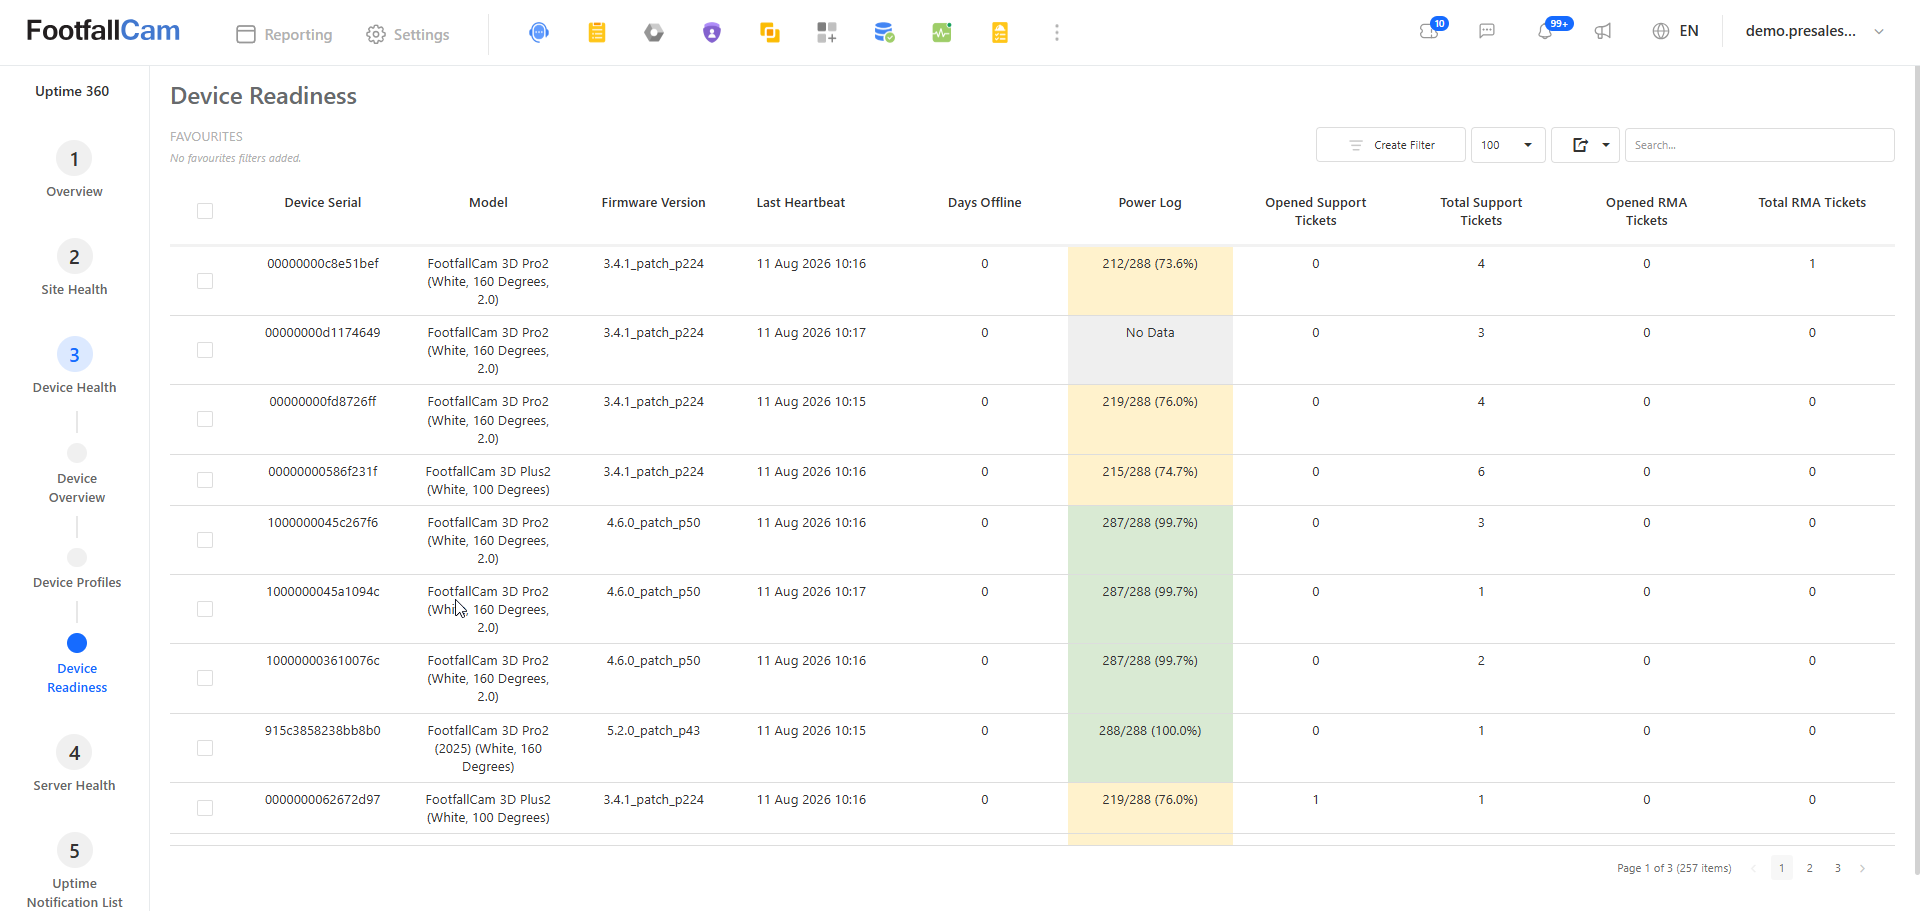
The page provides information including:
- Device Serial
- Model
- Firmware Version
- Last Heartbeat
- Days Offline
- Power Log
- Opened Support Tickets
- Total Support Tickets
- Opened RMA Tickets
- Total RMA Tickets
Power Log
The Power Log column provides an indication of the device's power-related activity.
The status is visually highlighted to help users identify devices that may require attention.
For example, devices with lower power-log percentages can be reviewed for potential power or operational issues.
Support and RMA Information
The Device Readiness page also provides support and RMA information.
Users can review:
- Open support tickets
- Total support tickets
- Open RMA tickets
- Total RMA tickets
This provides a quick way to determine whether a device already has an existing support or RMA case.
2.4 Server Health
The Server Health section provides information about server-related incidents and service issues.
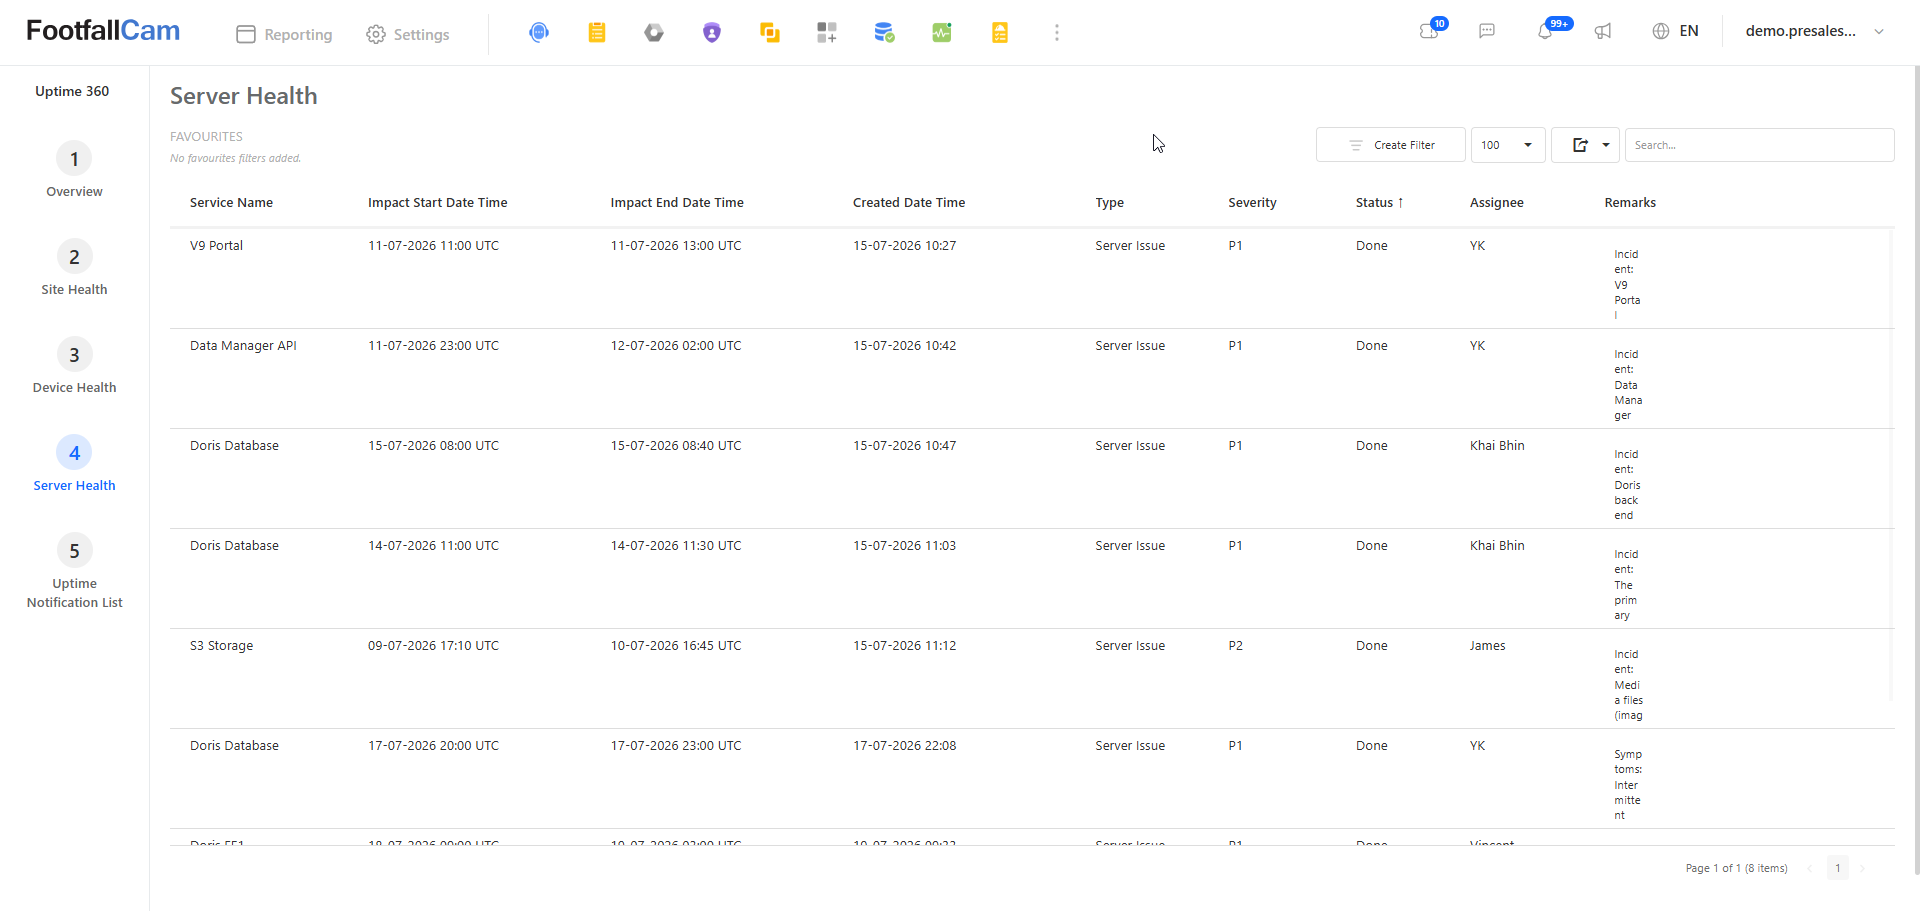
The Server Health table provides information such as:
- Service Name
- Impact Start Date Time
- Impact End Date Time
- Created Date Time
- Type
- Severity
- Status
- Assignee
- Remarks
Reviewing a Server Incident
To review a server issue:
Step 1 - Select Server Health from the left navigation menu.
Step 2 - Review the Service Name column to identify the affected service.
Step 3 - Check the Impact Start Date Time and Impact End Date Time to determine the duration of the incident.
Step 4 - Check the Severity column to understand the priority of the incident.
Step 5 - Review the Status column to determine whether the incident is still active or has been resolved.
Step 6 - Check the Assignee and Remarks columns for additional information regarding the incident.
Server Incident Status
The Status column can be used to determine whether an incident has been resolved.
For example, an incident marked as Done indicates that the recorded incident has been completed.
2.5 Uptime Notification List
The Uptime Notification List displays notifications generated by the Uptime 360 monitoring system.
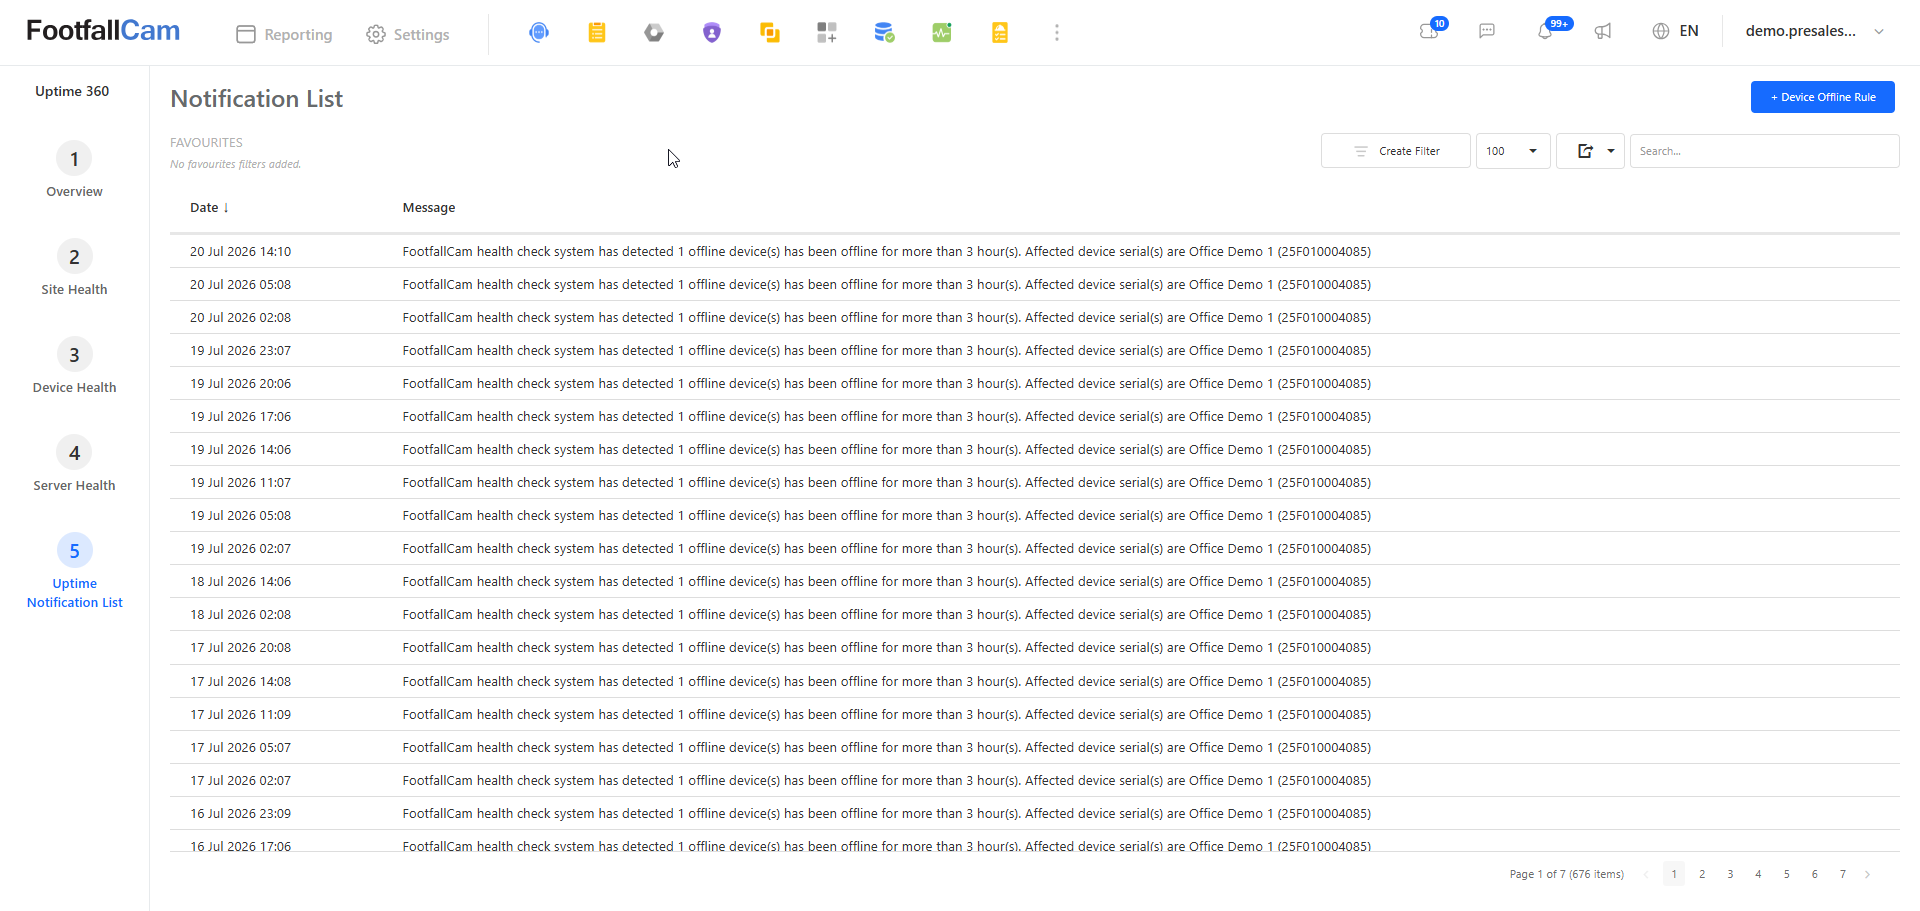
The notification list contains information such as:
- Date
- Notification Message
Notifications can indicate that a device or service has experienced an availability issue.
For example, the notification may indicate that a device has been offline for a specified period of time.
Reviewing Notifications
To review uptime notifications:
Step 1 - Select Uptime Notification List from the left navigation menu.
Step 2 - Review the notifications listed in chronological order.
Step 3 - Check the notification message to identify the affected device or service.
Step 4 - Note the affected device serial number or site mentioned in the notification.
Step 5 - Navigate to the relevant section under Device Health or Server Health for further investigation.
Device Offline Rule
The Device Offline Rule button is available at the top-right of the Notification List.
This can be used to configure or review the rule associated with device-offline notifications
3. Recommended Monitoring Workflow
For routine system monitoring, users can follow the workflow below:
Step 1 - Check Overview
Start from Overview to obtain a quick understanding of the current system status.
Step 2 - Check Site Health
Go to Site Health to identify sites with insufficient data, critical status, or other data integrity issues.
Step 3 - Check Device Health
If a device-related issue is identified, navigate to Device Health and review:
- Device Overview for overall device and camera status.
- Device Profiles for device and warranty information.
- Device Readiness for device health, power logs, firmware, and support/RMA information.
Step 4 - Check Server Health
If the issue appears to be related to a backend service or server, review Server Health for active or historical incidents.
Step 5 - Check Uptime Notifications
Finally, review the Uptime Notification List to identify notifications associated with offline devices or other uptime events.
4. Troubleshooting and Follow-up
When an issue is identified in Uptime 360, users should first determine whether it is related to the site, device, or server.
| Issue | Recommended Section |
|---|---|
| Site shows Critical / Insufficient Data | Site Health |
| Device is offline | Device Overview / Device Readiness |
| Device has old Last Heartbeat | Device Overview |
| Device requires support | Device Readiness |
| Device warranty information required | Device Profiles |
| Server/service incident | Server Health |
| Device offline notification | Uptime Notification List |
| General system status | Overview |
Uptime 360 should be used as the initial monitoring point to identify potential issues. Further investigation or corrective action should then be performed according to the applicable support and troubleshooting procedures.