

















1.1 Data Readiness at Reporting Cut-off
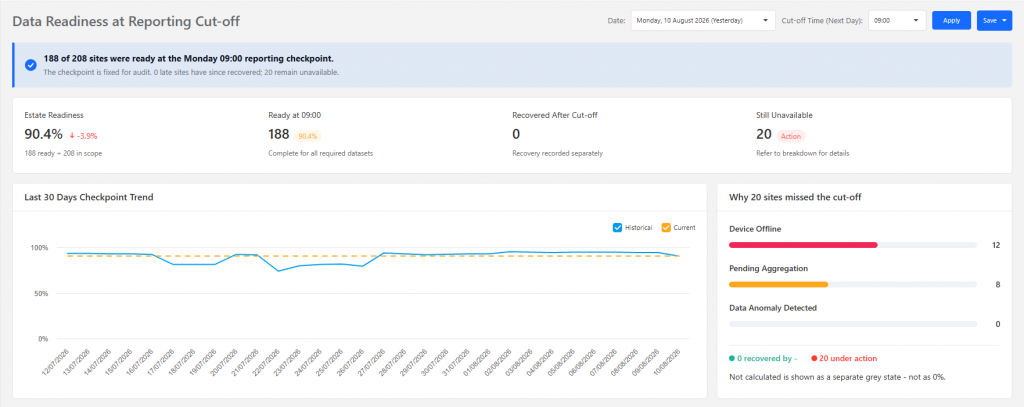
The Data Readiness at Reporting Cut-off dashboard provides an overview of how many sites have completed all required data processing by the reporting cut-off time. The dashboard shows the overall readiness percentage, based on the number of sites that are ready compared with the total number of sites in scope. It also shows how many sites were ready by the cut-off time, recovered after the cut-off or are still unavailable.
The dashboard shows the overall readiness percentage, based on the number of sites that are ready compared with the total number of sites in scope. It also shows how many sites were ready by the cut-off time, recovered after the cut-off or are still unavailable.
The Last 30 Days Checkpoint Trend shows how the readiness percentage has changed over the previous 30 days, helping users identify improvements or declines in data readiness.
For sites that missed the cut-off, the dashboard provides a breakdown of the reasons, such as Device Offline, Pending Aggregation and Data Anomaly Detected. Sites that recovered after the cut-off are tracked separately, while sites that remain unavailable are highlighted for further action.
1.2 Site Data Audit
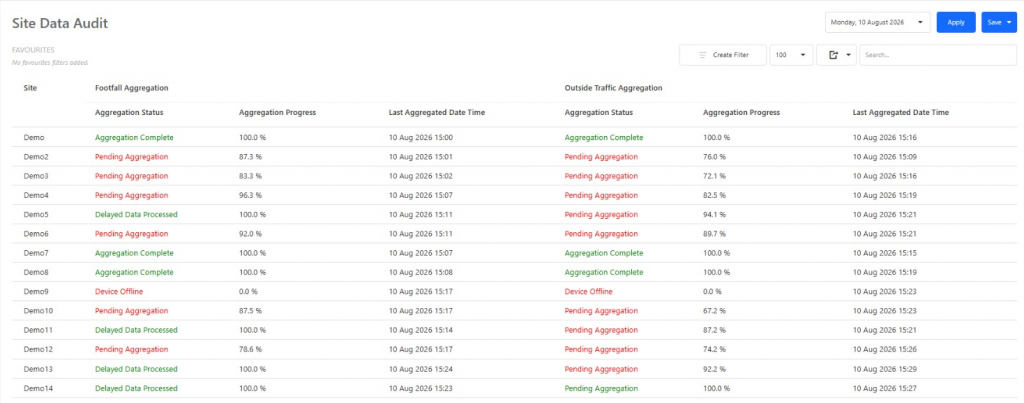
Site Data Audit provides a daily overview of data aggregation for each site. It displays the site name, Footfall and Outside Traffic aggregation status, aggregation progress and the last aggregated date and time. This allows users to quickly monitor the completeness and timeliness of site data and identify any sites with missing, delayed or incomplete aggregation.
1.3 Device Certification
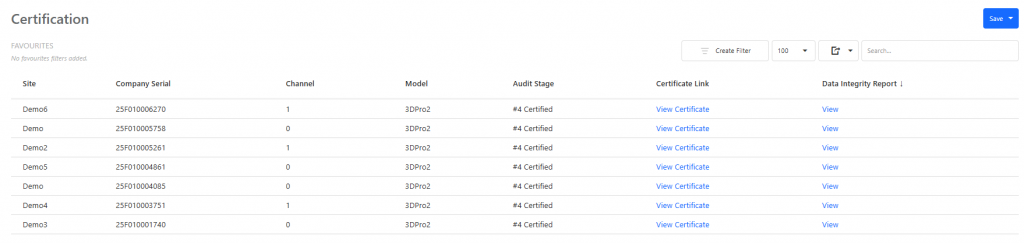
The Certification page provides an overview of the certification status and supporting information for each device.
1.4 Device Accuracy
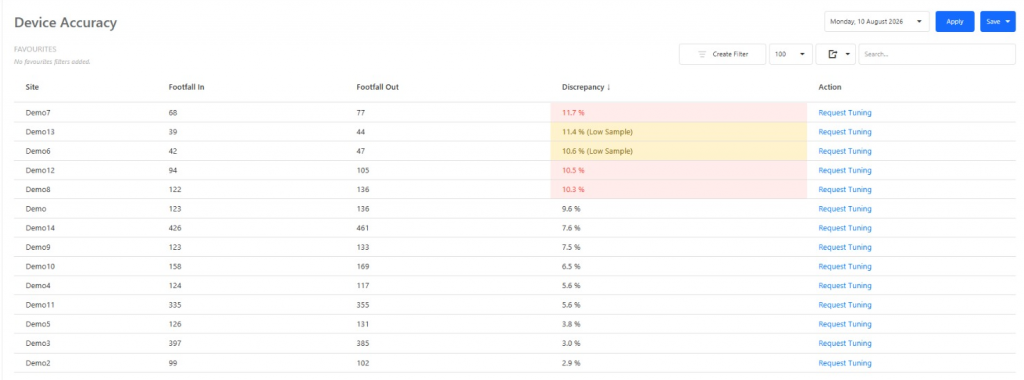
The Device Accuracy page provides an overview of each site's daily footfall counting accuracy.
The page helps users identify sites with potential device accuracy issues and provides a direct way to request tuning when required.
1.5 Data Audit Rules
The Data Audit Rule page allows users to create and manage data audit rules used to monitor the quality, completeness, and reliability of site data.
There are four types of rules that can be created:
- Live vs Historical Discrepancy Check - Compares live data against historical data to identify significant discrepancies.
- Live Data Freshness Monitoring - Monitors data freshness and device delays to identify sites where data is not being received within the expected timeframe.
- Historical Data Completion and Quality Check - Checks whether historical data is complete and meets the required quality standards before it is used for analysis or reporting.
- Data Drift Detector - Compares current data patterns against historical patterns and identifies significant changes that may indicate data drift.

Users can configure and create the appropriate rule based on the type of data quality or monitoring requirement they need to address.
1.5.1 How to Create Rule
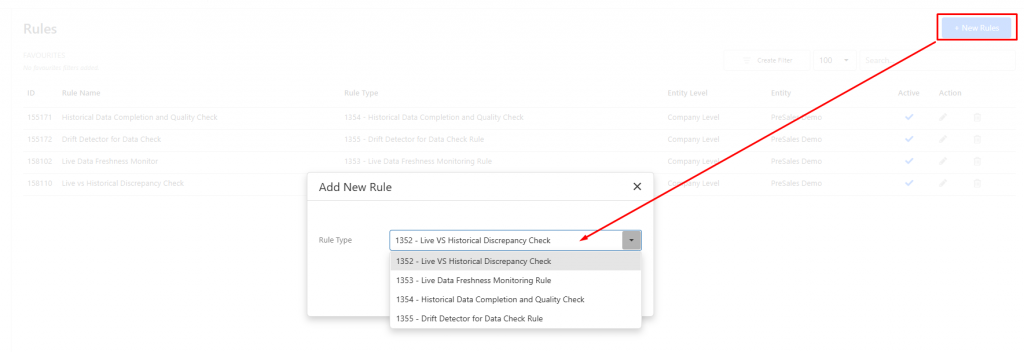
- Click on "New Rule", and select the rule type to be configured and click on "Create".
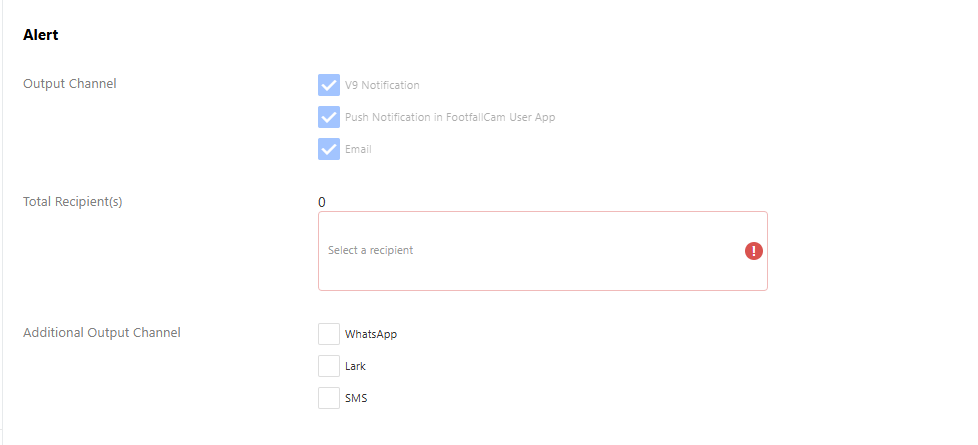
- It will bring user to the next page where certain configurations can be done:
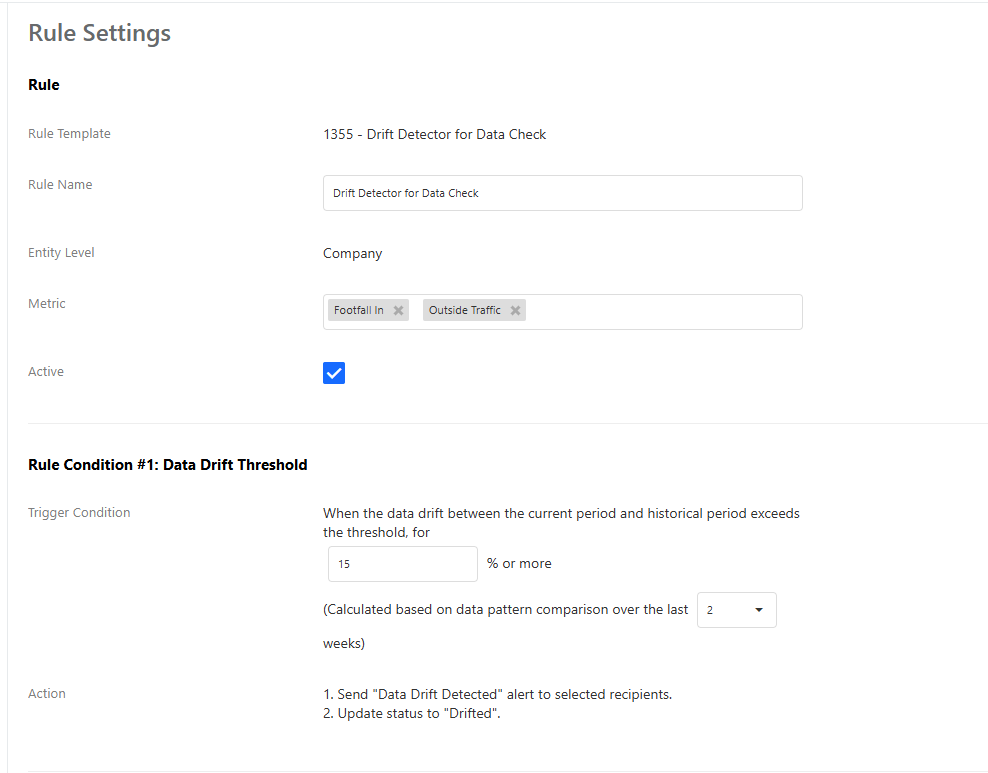
- Metric: The metrics that will be evaluated by the rule.
- Trigger Condition: The data condition for the rule to trigger alerts.
- Alert Methods: How the alert will be sent and the recipients that are expected to receive the alert notifications.
1.6 Notification List
The Notification List page displays notifications generated by the rules configured in 1.5 Data Audit Rule, together with the date and time each notification was created. Clicking on the notification message will bring the user to the rule settings page to reconfigure rule settings if needed.
