

Entity comparison widget allows data analysts to compare the different entities across the same metric at the same period.
When a dataset is selected, some default value will be set and render the basic widget. Data analysts may update the selectors accordingly to achieve the desired analysis.
Introduction
Entity comparison widget is used to analyse the targeted dataset based on the selected granularity and metric by the selected time resolution for the selected period, comparing among desired entities.
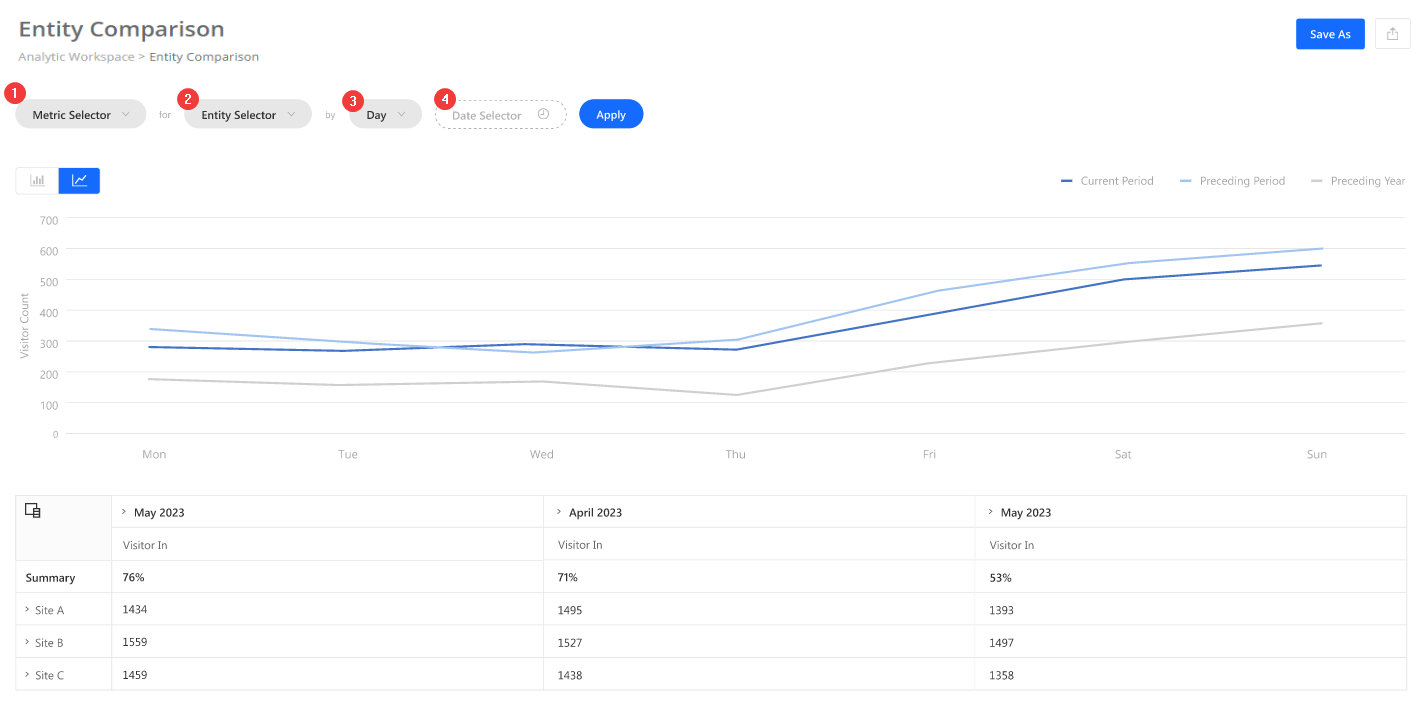
[1] Metric
The metric available will be dependent on the dataset selected. Kindly refer here for the full list of dataset available.
[2] Entity
The entity list will display all available sites / site groups / areas / area groups based on the dataset and granularity selected. You may select the desired entity or select all in a group for comparison.
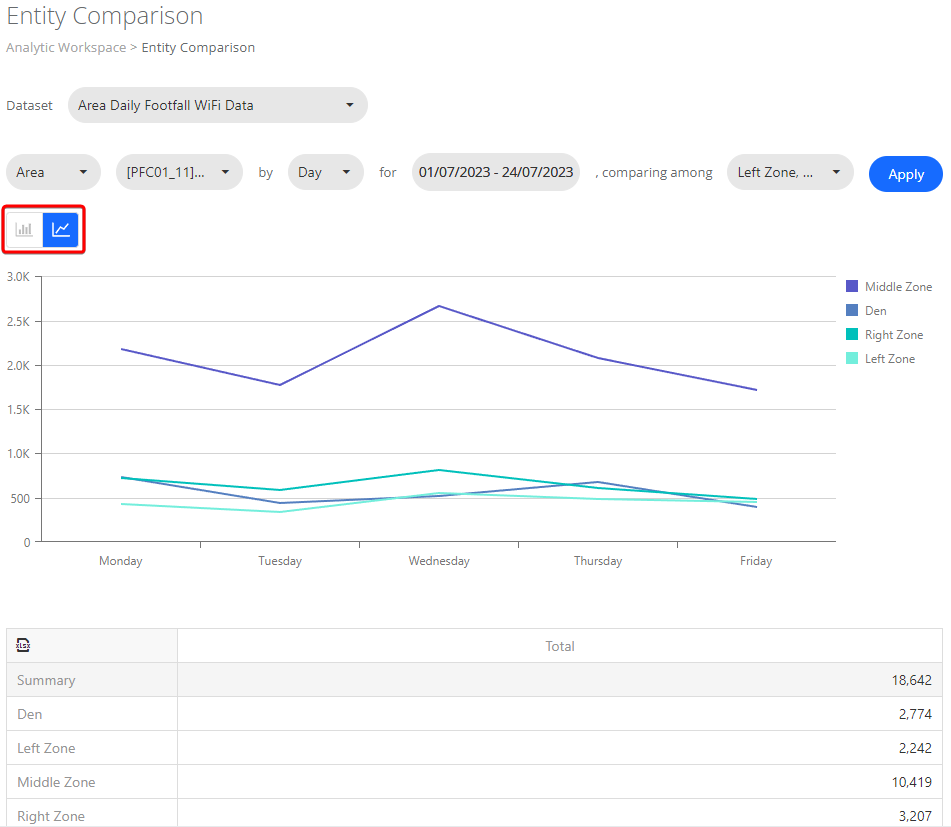
Entity comparison widget also comes with line graph display mode, you may change the chart type using the toggle at the top left bar under the selectors.
[3] Time Resolution
Time resolution decides the interval for x-axis. In our system it comes with hour, day, week and month.
[4] Period
You may select the dynamic date range or custom date range you desire for the period.
| Type | Period |
| Day | Today Yesterday |
| Week | Last 7 days including today This week Last week |
| Month | Last 30 days including today This month Last month |
| Year | Year selector |
| Custom | Custom date range |
Entity comparison widget comes with line graph display mode, data analyst may change the chart type using the toggle at the top left corner.