1.1 Widget Setting
1.1.1 Data Tab
1.1.1.1 Preview
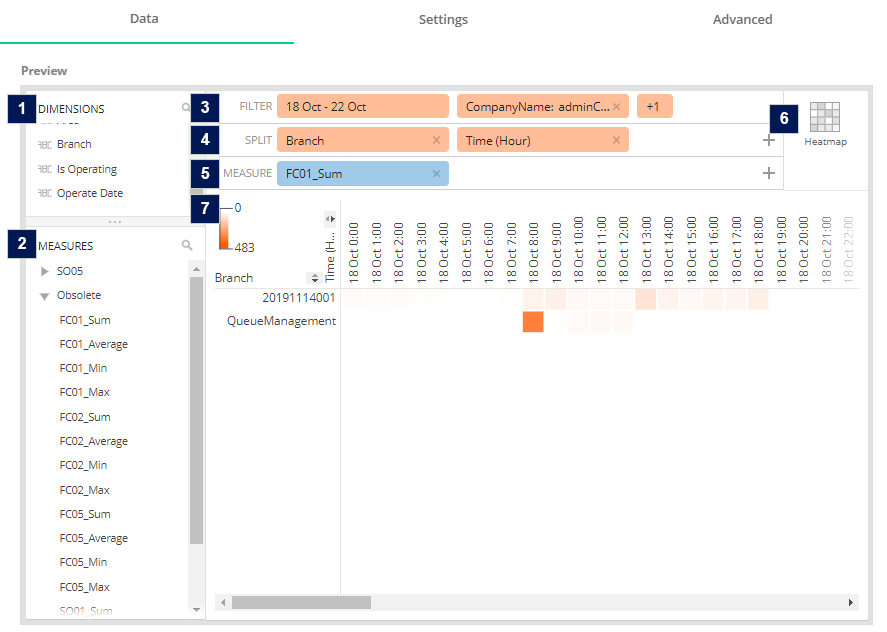
- Dimensions
- A list of dimensions. Users are able to drag the dimension to the Filter or Split area to render out the result for the heatmap table.
- Measures
- A list of metrics. Measures are the values that will be aggregated over the selected data. Users are able to drag the metric to the Measure area to select the metric for the widget.
- The naming structure of measure: [Metric Code]_[Count Mode]_[Aggregation Formula] (e.g. FC01_1_Sum)
- For metric code definition, please refer to Appendix B - Metrics Definition
- The following count mode stand for:
- 1 - People,
- 11 - Visitor People,
- 21 - Staff People,
- 12 - Car Vehicle
- Filter
- Users are able to select the dimension to filter (WHERE clauses) the data for the heatmap table. By default, the filter will follow the report granularity to preselect a few dimensions. (e.g. Company level report will auto filter with latest date, company id and company name). If users drag a non-preselected dimension (e.g. Area), this widget will become data binded and the graph output will follow the selected option of the dimensions.
- Filter Configuration:
- Split
- Users must select two (2) dimension to split (GROUP BY clauses) the data for the heatmap table. The splits for T03 heatmap table widget must have two dimensions, which are Data + Time, Data + Data or Time + Time. (Note: Heatmap Table not supported Quarterly time interval)
- The allowed time comparison (Time + Time) are:
- Minutes, 15Minutes - Minutes vs Hours
- Hours - Minutes vs Hours / Hours vs Days
- Days - Hours vs Days / Days vs Weeks / Days vs Months
- Weeks - Days vs Weeks / Weeks vs Months
- Months - Days vs Months / Weeks vs Months / Months vs Years
- Year - Months vs Years
- Split Configuration:
- Measure
- Element Type
- Preview the result in different element types (only for preview display purpose).
- Preview Screen
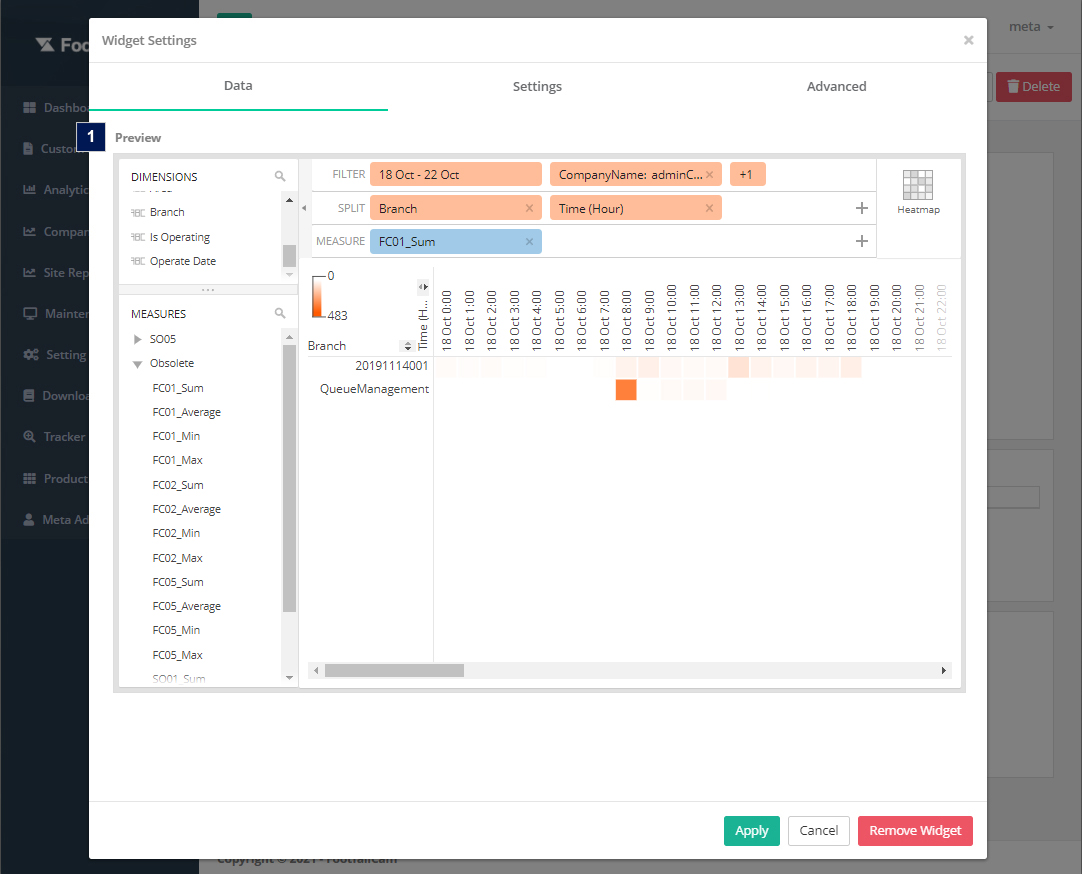
- Users are able to preview the heatmap table output in different element types based on the selected dimensions and measure in filter section, split section and measure section.
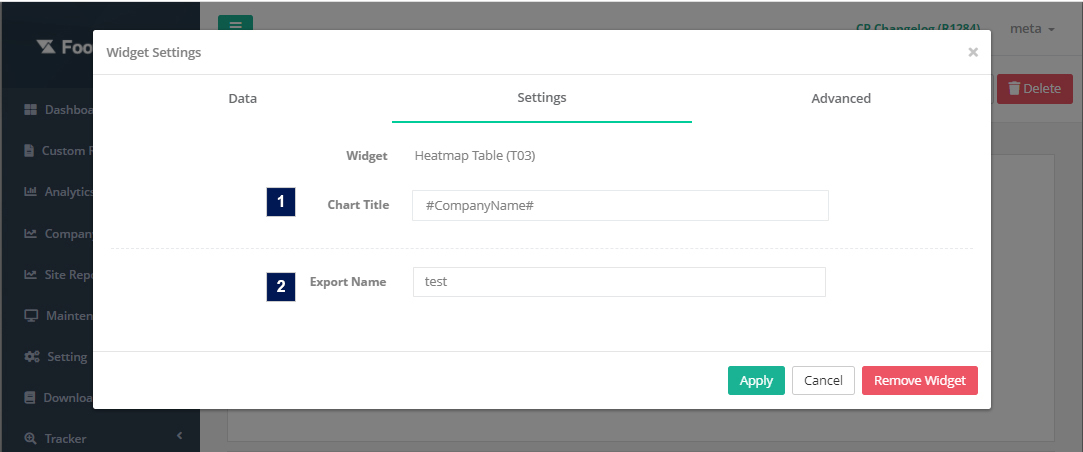
1.1.2 Settings Tab
| Item | Description |
| 1. Chart Title* | Title for the table (Maximum 30 characters) |
| 2. Export Name* | Export name of the widget for the export function |
*Required field
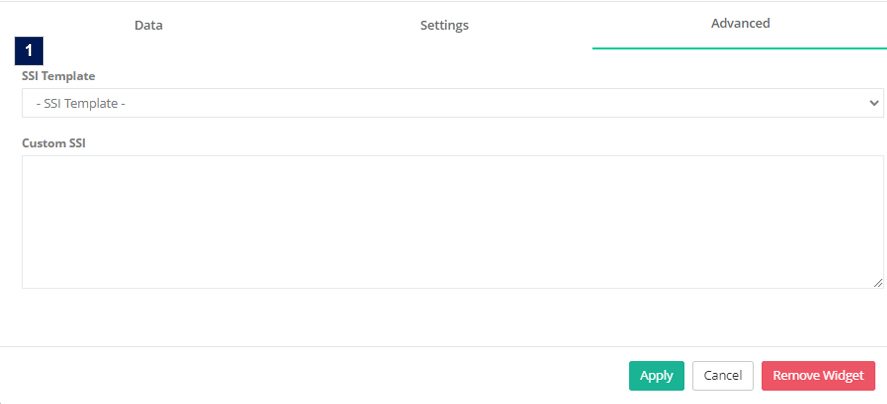
1.1.3 Advanced Tab
| Item | Description |
| 1. SSI (Optional) | Apply custom SSI code by selecting the SSI template or enter the code in the text area. |

