Data Availability Monitoring
Audience: Operations, Management, IT Team
1. Overview
This guide explains how data availability is measured, reported, and managed within the customer site deployment. Its purpose is to provide transparency and confidence, while ensuring issues are identified and resolved quickly without requiring constant manual oversight.
2. Data availability principle
Each device is expected to deliver data continuously, evaluated in one-minute intervals.
- 1 day = 1,440 expected minutes
- Availability is measured end-to-end, up to final storage and reporting
- This ensures reported data reflects real, usable information
3. Data Availability States Summary
| Availability State | What It Means | User Impact |
|---|---|---|
| OK – On Time | Data arrived within the expected 5-minutes time window and was processed successfully. | Live and historical dashboards are complete, accurate, and final. No user action required. |
| OK – Delay | Data arrived successfully but later than expected due to temporary latency or buffering. | Live dashboards may show delayed updates. Historical dashboards will update retroactively and become complete once processing finishes. |
| Delay – Device Offline | Device temporarily offline due to network or connectivity interruption; data may arrive once reconnected. | Temporary gaps or delays in live dashboards. Buffered data is typically recovered after reconnection, so historical dashboards usually become complete. |
| Missing – Pipeline Not Ingested | Data was generated but not processed by the ingestion pipeline. | Live dashboards show gaps during the incident. Historical dashboards may be partially or fully backfilled later (footfall recoverable) |
| Missing – No Power | Device not powered; no data generated. | Live and historical dashboards show permanent data gaps for the affected period. Data cannot be recovered. |
| Missing – Counting Module Not Running | Device powered on but counting module not running, so no usable data produced. | Live and historical dashboards show permanent data gaps for the affected period. Data cannot be recovered. |
| Missing – Unknown | Data missing but root cause not yet classified; further investigation required. | Live and historical dashboards may show gaps. Impact and recoverability are undetermined until Root Cause Analysis completes and the issue is reclassified. |
4. Reports available to Customer
4.1 Per-device availability (per day)

Used to:
- Validate installation stability
- Identify isolated device issues
- Support technical discussions when needed
4.2 System-wide availability (30 days)
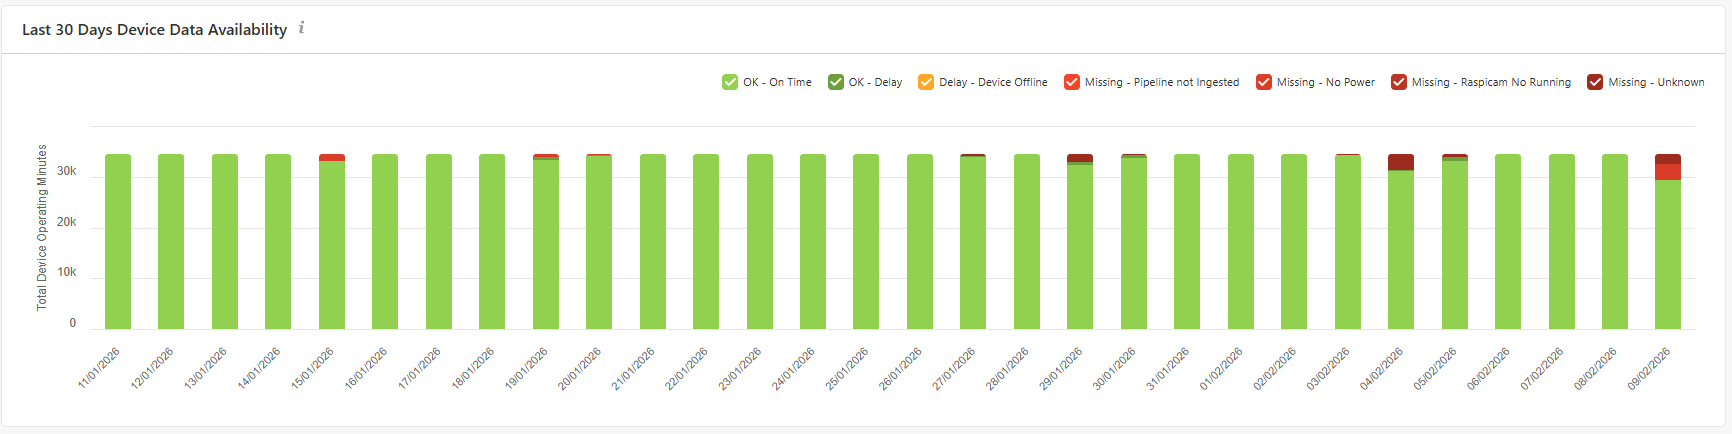
Used to:
- Assess overall system health
- Support management and SLA discussions
- Track long-term reliability trends
5. Patching and corrections (what Customer sees)
When corrections are applied:
-
The affected time window is logged
-
The action is recorded automatically
-
Monthly summaries reflect:
- What was affected
- What was done
- Final data completeness
Customer does not need to manage patching workflows.
6. What Customer does NOT need to monitor
The following are handled internally by FootfallCam:
- Ingestion retries and reprocessing
- Pipeline-level recovery
- Internal escalation workflows
- Root-cause diagnostics
- Patch execution mechanisms
Only outcomes and transparency are surfaced.
7. Data Availability States, Responsibility & SLA
| Availability State | Responsible Party | Action Required | SLA |
|---|---|---|---|
| OK – On Time | N/A | No action | N/A |
| OK – Delay | FootfallCam | Re-ingest data, validate completeness | ≤ 12 hours |
| Delay – Device Offline | Customer IT | Check device power, network, LED status | ≤ 1 business day |
| Missing – Pipeline Not Ingested | FootfallCam | Re-ingest data, validate completeness | ≤ 12 hours |
| Missing – No Power | Customer IT | Restore power, verify device status | ≤ 1 business day |
| Missing – Counting Module Not Running | FootfallCam | Remote diagnosis on the affected device(s) | ≤ 12 hours |
| Missing – Unknown | FootfallCam | Investigate root cause | ≤ 1 business day |