Outside Traffic
The Validation Workspace is designed to help you determine the right outside-traffic scaling for your store environment.
This section does not explain how Bluetooth or Wi-Fi detection works. Instead, it focuses on how you validate, benchmark, and confirm that your outside traffic numbers are realistic and consistent for your location.
Bluetooth outside traffic provides statistically reliable trend estimation. However, calibration varies depending on:
- Street width
- Road traffic interference (cars carrying devices)
- Narrow alley vs open plaza
- Residential buildings with stationary devices
- Device randomisation behaviour
The Validation Workspace allows you to adjust scaling so that your outside traffic aligns with real-world expectations.
Step 1 – Review 14-Day Trend Benchmark
Navigate to: Accuracy Validation App → Outside Traffic → Overview
On this page you can have a quick overview of the 14-day data trend of the selected site and device stability on the data collection.
You can overlay:
- Wi-Fi Outside Traffic
- Bluetooth Outside Traffic (if enabled)
- Footfall In (store entry benchmark)
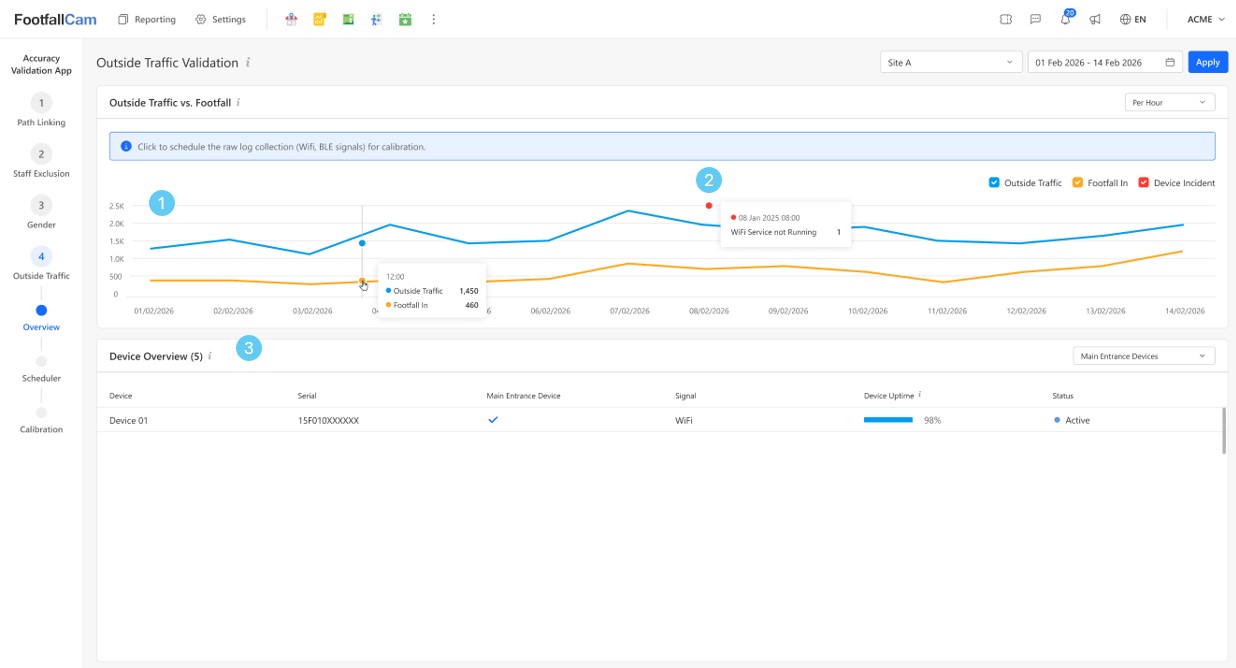
| Label | Descriptions |
|---|---|
| 1 | This graph shows the 14-day Outside Traffic data trend comparing to the Bluetooth Outside Traffic and Footfall In. Note: You may click on any day in the graph to schedule Wi-Fi or BLE raw log capture for both historical or future date time for calibration. |
| 2 | Red dots indicate device incidents such as Wi-Fi Dongle Not Detected, Wi-Fi Service Not Running or No Power which directly affect outside traffic data collection. |
| 3 | Device Overview showing the list of devices of the site, helps you to determine ✔ How many devices are collecting outside traffic ✔ Whether devices are stable |
What to look for:
- Are the trends directionally consistent?
- Do peak days align?
- Is the relationship stable (e.g., Bluetooth consistently ~6–8x of entry count)?
- Are there abnormal spikes indicating interference?
This step confirms statistical stability before scaling adjustments.
Step 2 – Schedule Raw MAC Log Capture
If trends appear inconsistent, proceed to deeper validation.
Use the Raw MAC Scheduling function:
-
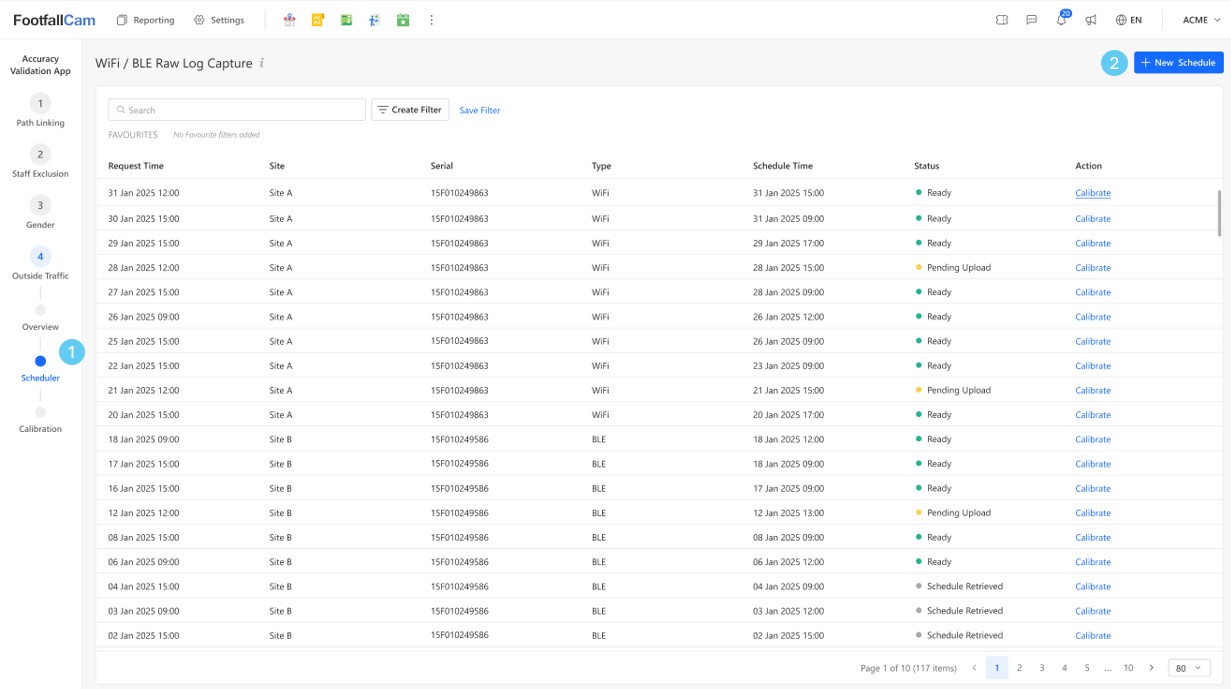
Navigate to: Accuracy Validation App → Outside Traffic → Scheduler
-
Click “New Schedule” to schedule Wi-Fi or BLE raw log capture for both historical or future date time for calibration.
Raw logs allow analysis of:
- Outside Traffic density per hour
- Night-time background noise
This helps determine whether scaling should be:
- Reduced (e.g., high roadside interference)
- Increased (e.g., narrow pedestrian alley)
- Filtered (e.g., residential static signals)
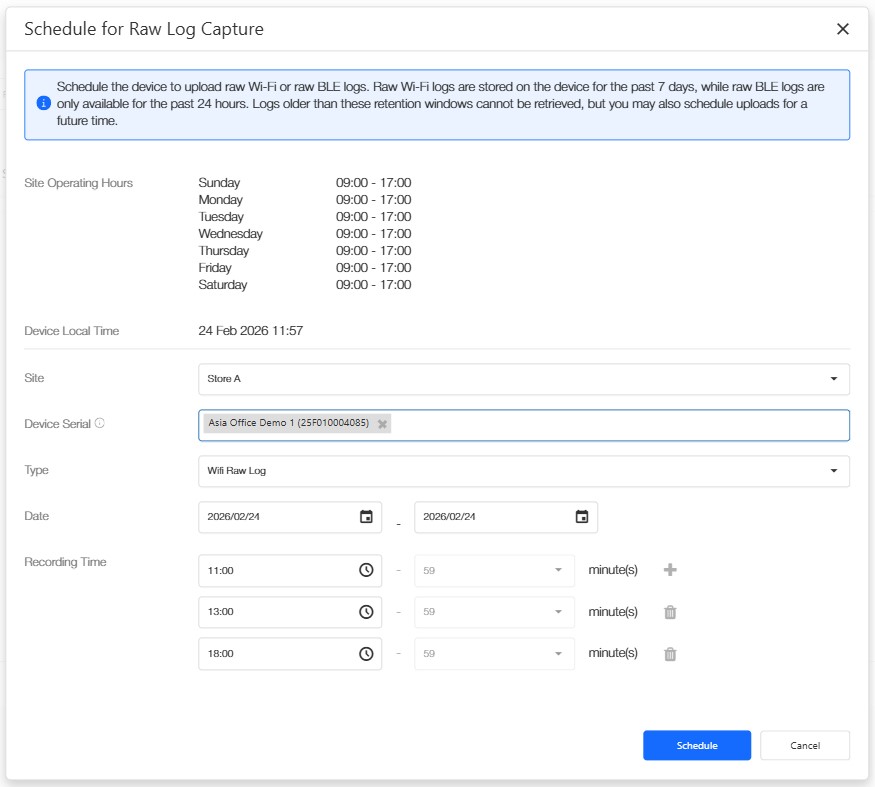
Pre-condition: WiFi raw log capture only supported for devices with firmware v5.2.0_p41 or above. If your device firmware is lower, please contact FootfallCam support for an upgrade.
Raw Log Retention Rules
| Type | Device | Server |
|---|---|---|
| Wi-Fi Raw Logs | Stored on device for past 7 days | Stored at server for 14 days |
| BLE Raw Logs | Stored on device for past 24 hours only | Stored at server for 14 days |
If within retention period, historical capture uploads to server within ~1 hour (if device online). Alternatively, you may also schedule capture for future date/time.
Schedule Status
In Scheduler page, you will see different statuses:
| Status | Meaning | Next Action |
|---|---|---|
| Ready | Raw log uploaded successfully | Proceed to Calibration Workspace to perform calibration. |
| Pending Device Retrieval | Scheduled on server, waiting device to retrieve | Wait for device to retrieve the schedule |
| Schedule Retrieved | Device has retrieved schedule, waiting for capture time | Wait until the scheduled recording time completes. |
| Pending Upload | Data captured but not yet uploaded to server | Wait for device to upload. |
| Failed | Upload failed | Check and confirm device connectivity, reschedule the raw log capture if the device is online. |
Only when status = Ready can proceed to calibration.
Step 3 – Adjust Calibration Settings
Navigate to Accuracy Validation App → Outside Traffic → Calibration
Once raw log data is available, calibration is performed in the Calibration panel. The goal of this step is to align outside traffic trend with:
- The store’s physical environment
- Observed ground truth
- Business expectation (turn-in rate reasonableness)
Scaling accounts for:
- Average devices per person
- Smartwatch/device multiplier
- MAC randomisation impact
- Environmental interference
Calibration aims to achieve:
- Stable trend behaviour
- Reasonable turn-in rate
- Alignment with store environment
It is not meant to force outside traffic to match an exact number. Trend consistency is more important than absolute value.
Calibration Settings Adjustment
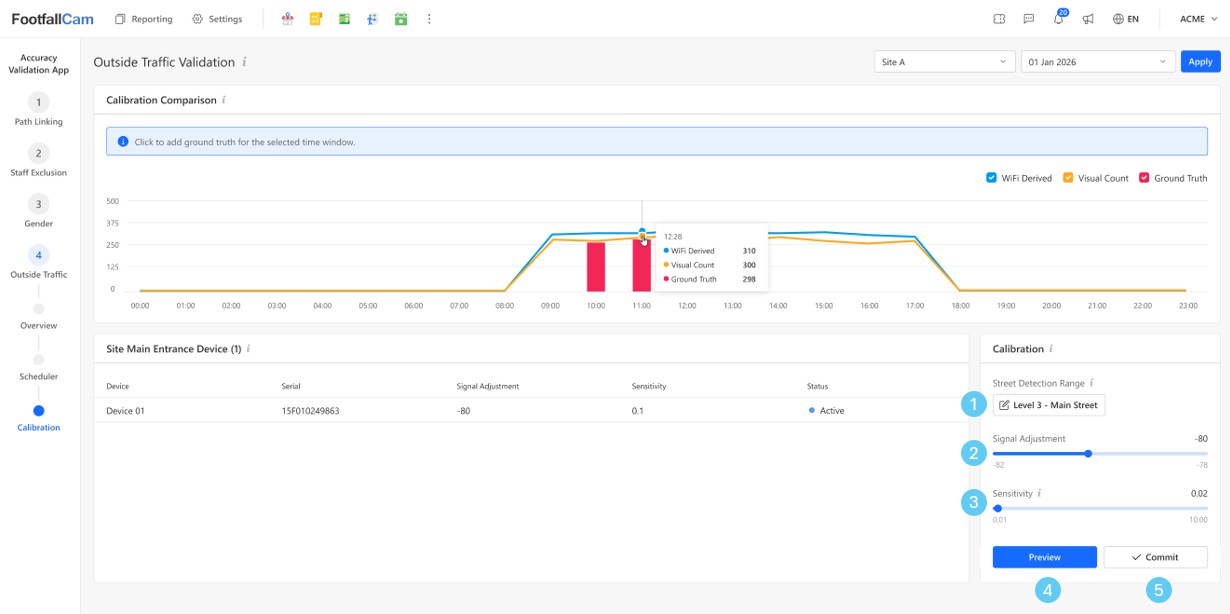
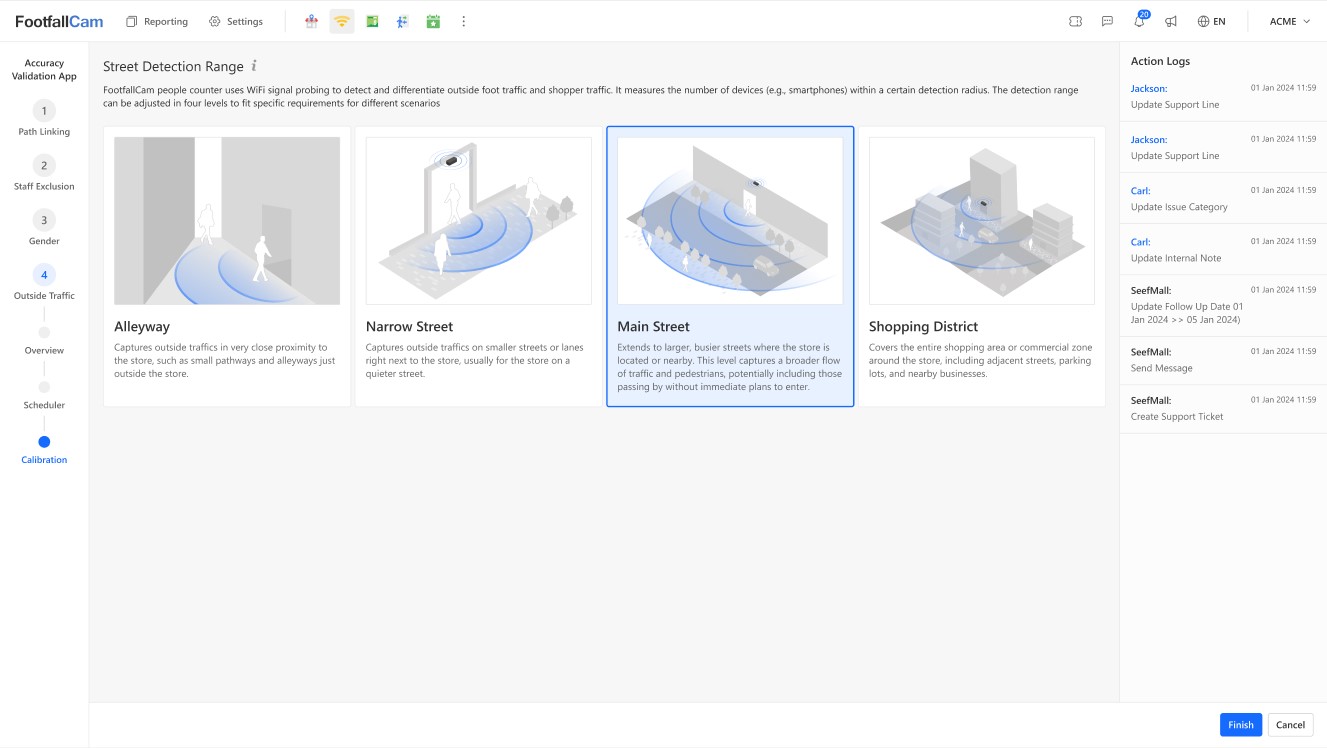
1. Select Street Detection Range
First, determine the store’s physical street environment. Choose the detection range that best matches the store location:
| Detection Range | Scenarios |
|---|---|
| Level 1 – Alleyway | Very close proximity, small paths, minimal passers-by. |
| Level 2 – Narrow Street | Smaller streets or quieter lanes beside the store. |
| Level 3 – Main Street | Busy urban street with consistent pedestrian flow. |
| Level 4 – Shopping District | Wide commercial zone covering surrounding area, nearby streets, or open shopping areas. |
This selection defines the baseline detection radius for Wi-Fi signals.
It reflects where the store is located, not how much traffic you expect.
2. Adjust Signal Threshold Within Selected Range
After selecting the street level, fine-tune the signal threshold.
This controls how strong a Wi-Fi signal must be to be counted as outside traffic.
- Increasing the signal threshold → captures more distant signals → higher outside traffic.
- Decreasing the signal threshold → filters weaker signals → lower outside traffic.
Use this adjustment to refine the detection area within the selected street category.
3. Fine-Tune Sensitivity
Sensitivity controls how aggressively the system interprets detected Wi-Fi signals as unique outside traffic.
- Higher sensitivity → increases derived outside traffic
- Lower sensitivity → produces more conservative counts
This is used for final tuning after street range and signal level are properly set.
4. Preview Before Deployment
After adjusting the above settings, click Preview and the system immediately recalculates outside traffic using the uploaded raw log data and displays the updated trend in the graph.
You should now compare:
- WiFi Derived
- BLE Derived
- Ground Truth (if inputted)
- Visual Count (if configured)
Adjust again if necessary. You may iterate multiple times within minutes.
5. Commit Calibration
Click Commit if you are satisfied with the calibration. This saves the calibration settings and applies them to all main entrance devices at the selected site.
From this point onward, live outside traffic data will follow the new calibration settings.
Ground Truth & Visual Count (Optional)
Ground Truth and Visual Count are optional references during calibration.
- Ground Truth is manually entered by the user based on physical observation.
- Visual Count is automatically generated if an outside-traffic line-crossing zone has been configured for the site.
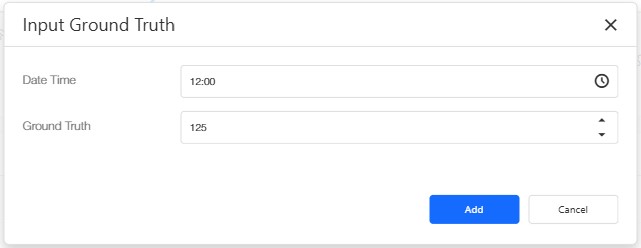
To input Ground Truth:
- Click on the specific hour in the calibration graph.
- Enter the manually observed outside traffic number.
- Save.
Both Ground Truth and Visual Count are used for comparison against WiFi and BLE derived data during preview.
If neither is available, calibration can still proceed based on trend alignment and business expectation.
Step 4 - Post-Calibration Monitoring
After committing calibration, return to the 14-day view monitor the data trend over the next 7 - 14 days to ensure the calibrated outside traffic aligns with business expectation.
The objective is to confirm:
- Improved stability
- Consistent conversion ratio
- Logical relationship with entry counts
What to look for:
- Does the Turn-In Rate fall within reasonable expectation for this store type?
- Does the relationship between Footfall and Outside Traffic make commercial sense?
- Is the daily trend consistent and explainable?
If the trend aligns with expectation, calibration is considered successful.
If the outside traffic or Turn-In Rate appears commercially unrealistic, you may return to the Calibration Workspace to refine the settings.
Key Principle
Bluetooth/WiFi outside traffic is statistically valid for trending, but final calibration must reflect your store’s physical environment.
The Validation Workspace ensures your outside traffic metric is:
- Environment-appropriate
- Consistent over time
- Decision-ready
Use this workspace whenever opening a new site or when surrounding street conditions change.
Applicability & Auto-Disable Threshold
Bluetooth and Wi-Fi Outside Traffic are statistical estimations, designed for locations with moderate to high pedestrian flow. They rely on probabilistic detection of mobile devices and trend smoothing over time.
These methods are not recommended for:
- Car parks
- Low-traffic office entrances
- Small internal mall corridors
- Sites with consistently low outdoor pedestrian volume
As a guideline:
If average outside traffic is below 300 detections per day, the dataset may be statistically unstable and prone to distortion.
In such cases:
- Outside Traffic via Bluetooth/Wi-Fi will be automatically disabled
- The Validation Workspace for those metrics will be hidden
- Visual Count remains the recommended deterministic benchmark
Why?
Low sample size increases:
- Variance caused by MAC randomisation
- Noise from stationary devices
- Sensitivity to individual device behaviour
- Misleading scaling outcomes
These technologies are designed for trend reliability at scale, not micro-volume precision.