

Reports are better visualization to represent the data. There are many types of reports to sustain different requirement from the customers. The reports are mainly divided into two main set, which are Basic Reports and Custom Reports.
7.1 Basic Reports
Basic Reports included the reports that generally used by all customer according to the industry.
7.1.1 Types of Basic Reports
| Level of Reporting | Report Name | Industry | Usage |
| Company Level | Company Daily Report | General | To showcase the daily trend across all branches based on a compiled daily report for macro view across all stores in the chain and drill down to an individual store in question if performance drops. |
| Company Weekly Report | General | To showcase the overall weekly trend across all branches within the company and provide all C-level executives with a comprehensive insight on the consumer behaviors and have a macro view of the performance of the stores. | |
| Company Monthly Report | General | To showcase the overall trend across the previous month for all branches within the company. Provide all C-level executives with a comprehensive insight on the consumer behaviors and have a macro view of the performance of the stores. | |
| Company Site Comparison Report | Retail | To compare two different group of stores based on environment to determine difference between traffic pattern based on external actors and enable top management to categorise different types of stores. | |
| Site Level | Daily Report | General | To showcase the daily trend across the site and have a macro view of the performance of the site. |
| Weekly Report | General | To showcase the overall trend across the week and provide a comprehensive insight on the consumer behaviors and have a macro view of the performance of the site. | |
| Monthly Report | General | To showcase the overall trend across the previous month and provide a comprehensive insight on the consumer behaviors and have a macro view of the performance of the site. | |
| Shopping Mall | Daily Report | Shopping Mall | A daily run through of the performance of the shopping mall in comparison of the previous day. Management can implement better personnel allocation based on the peak traffic in area. |
| Weekly Report | Shopping Mall | To showcase the overall trend across the week and provide a comprehensive insight on the consumer behaviors of the shopping mall. | |
| Monthly Report | Shopping Mall | With monthly insight into the shopping mall performance, overseers and develops will have analytical insight into the total visitor count of their mall and to quantify customer loyalty in certain areas or zones. | |
| Counter Daily Report | Shopping Malls | A comprehensive report on the footfall data of each individual counter installed in the shopping mall that list the total number of visitor count recorded by each individual counter on an hourly basis. | |
| Zone Analysis report | Shopping Malls | Identifiable zones within the shopping mall can be viewed in terms of trend in determining which area of the shopping mall garners the most sales opportunities and tenant rental value may be adjusted accordingly. |
7.1.2 Report Page Access
Admin user for FootfallCam Analytic Manager V9™ can alters the reports access to enable certain user to view and hide from other user. This section focuses on the configuration of report page access.
STEP 1 - Access to FootfallCam Analytic Manager V9™: http://v9.footfallcam.com via Google Chrome.
STEP 2 - Click on Setting > Users to access the User Accounts page.
STEP 3 - Navigate to the user to be updated and click Edit.
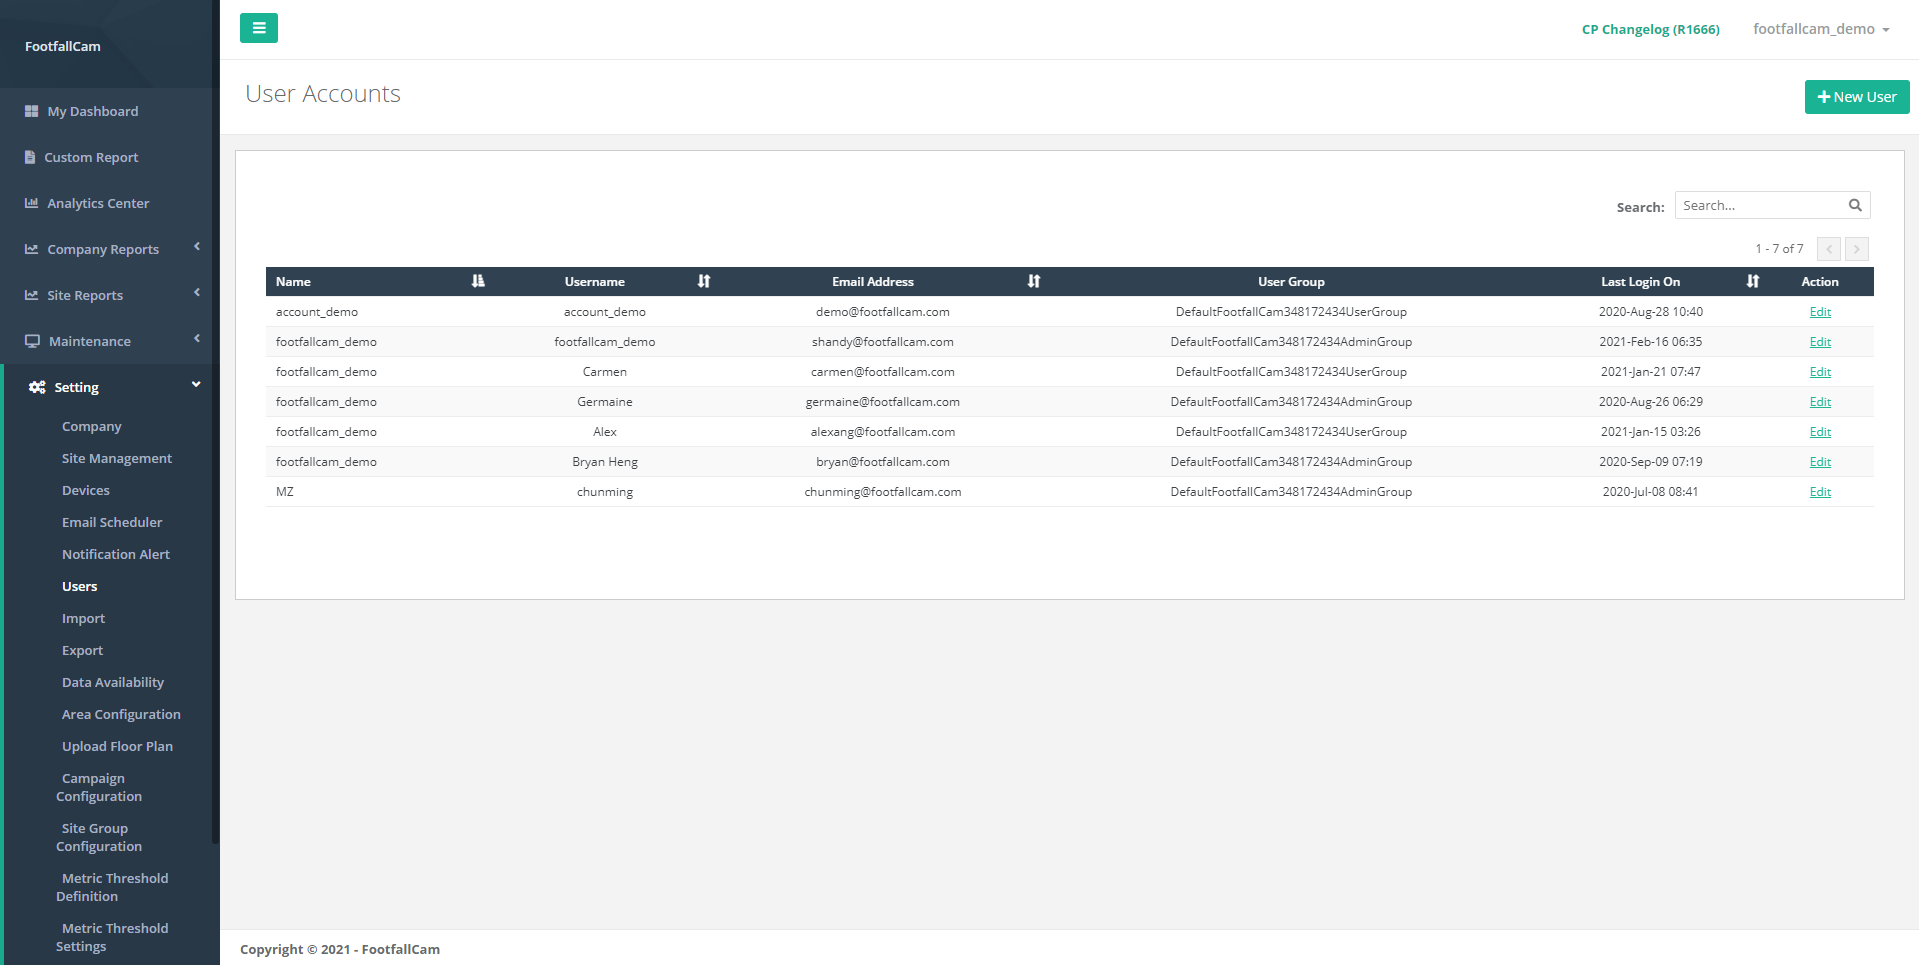
STEP 4 - Navigate to Page Access section and select the report page that allow to view by the user. If the page is not at the selected page box, then it will be hidden from the user.
STEP 5 - Click the Save button at the top right corner of the page to save the update.
7.2 Custom Reports
Custom Reports are reports which applied to specific solutions. These reports will only be available upon request via support ticket.
7.2.1 Custom Reports Request
To request for custom reports, follow the following steps to raise a support ticket.
STEP 1 - Access to FootfallCam Analytic Manager V9™: http://v9.footfallcam.com via Google Chrome.
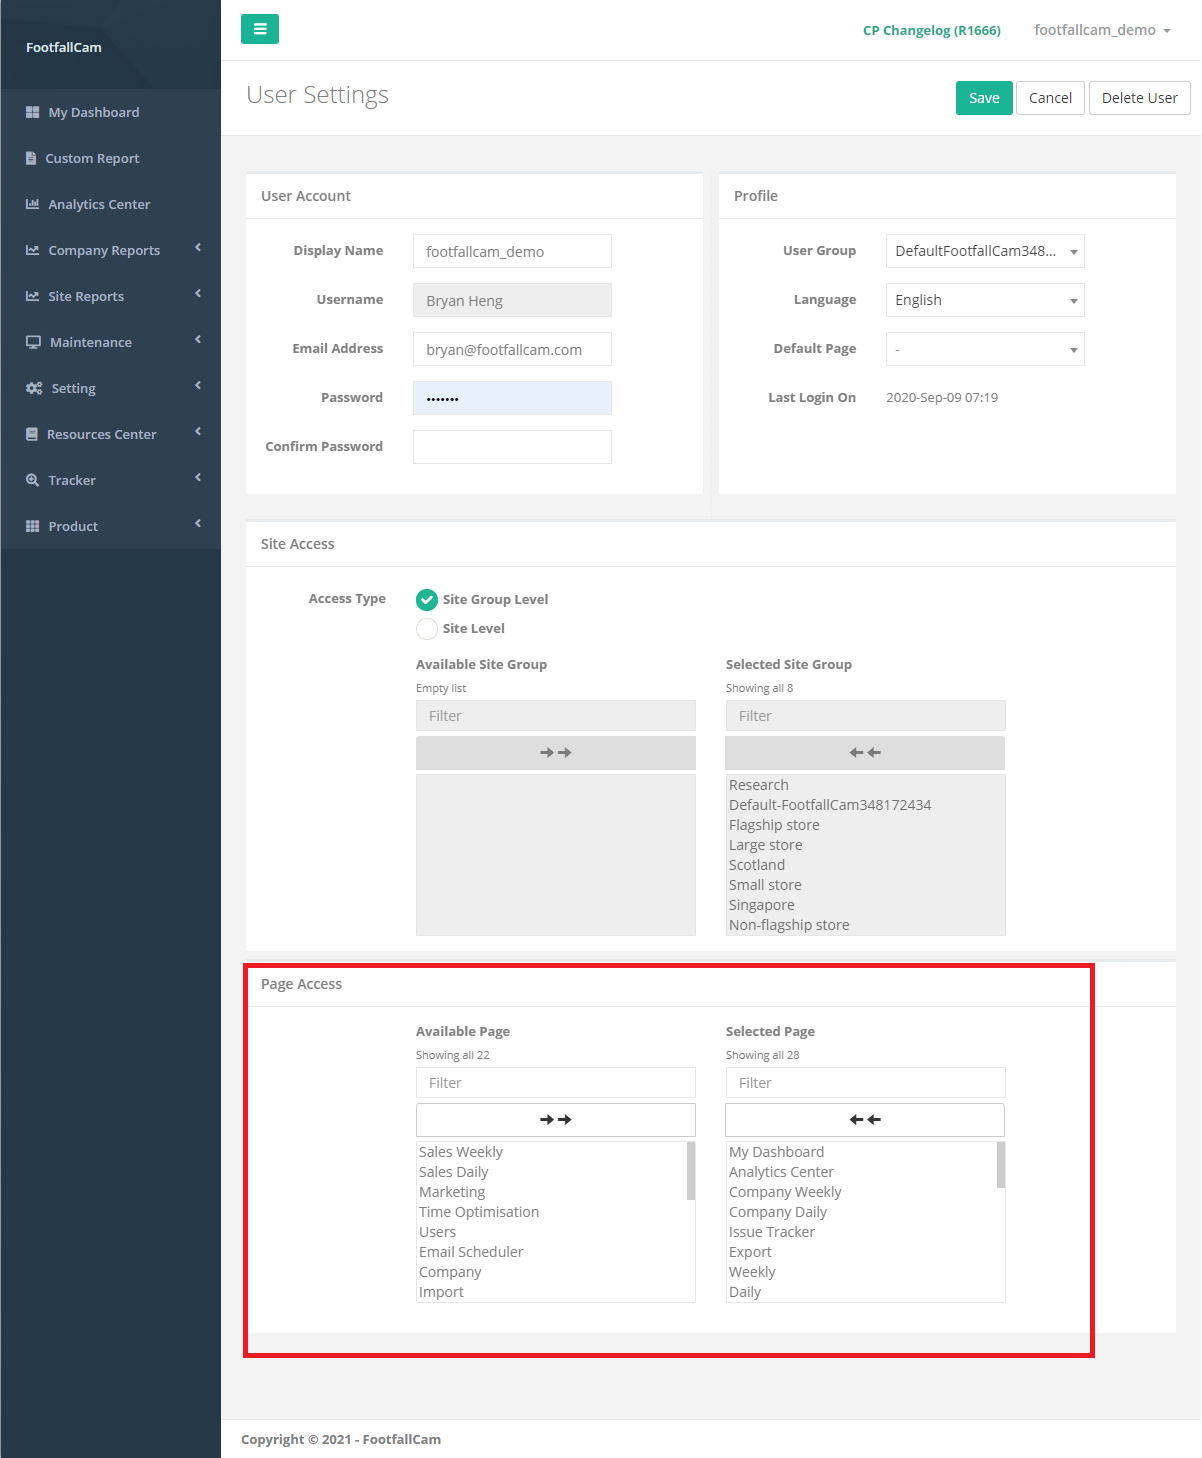
STEP 2 - Click on Maintenance > Support Portal to access the Support Portal page.
STEP 3 - Click on +Raise a Ticket button to access the Raise a Trouble Ticket page.
STEP 4 - Enter "Custom Report Request" in Ticket Subject and select "Others" for Category.
STEP 5 - Complete the process by entering the reports' name and other required fields and click on Submit button.
For more information regarding how to manage support request, please refer Chapter 24: Support Request
7.2.2 Types of Custom Reports
| Report Name | Industry | Usage |
| Company Sales Conversion Daily report | Retail | Provide a daily insight into whether sales have dropped in the previous day according to the number of visitors that have visit the store and display an interest in the product. |
| Company Sales Conversion Weekly Report | Retail | Provide an insight into how well the stores are at converting their visitors into a store into a shopper and if a store is performing badly in terms of conversion, drill down to the issue and cause of deficit. |
| Company Opening and Closing Report | Retail | Benchmarking for the stores hour optimisation within the company to determine when a store should open and close. Doing so will enable the store managers to adjust the operating hour of different store in different area and save resources on staff allocation. |
| Store Sales Conversion Daily Report | Retail | Provide a daily insight into whether sales have dropped in the previous day according to the number of visitors that have visit the store and display an interest in the product. |
| Store Sales Conversion Weekly Report | Retail | Provide an insight into how well the store staff is at converting the visitors entering a store into a shopper and if a store is performing badly in terms of conversion, drill down to the issue and cause of deficit. |
| Store Opening and Closing Report | Retail | Review the opening and closing time analysis of stores based on the outside traffic data picked up by the FootfallCam to determine the most opportunistic moment and adjust the operating hour of the individual store based on the opportunities. This report will only show stores with suggested adjustment on operating hour. If there is no opportunities detected outside operating hour (no outside traffic during non-operating hour) and the site operating hour is optimized, the store will not be included in the report. |
| Marketing Effectiveness Reports | Retail | To determine how well the marketing campaign did by comparing the key performance index of three different time periods. This report will enable marketing managers to determine the perfect promotional strategy to cater to their demographics. |
| Space Occupancy Report | Retail | To determine the space occupancy status of an area. This report enable store managers to determine the peak hour of the store. |
| Space Occupancy Dashboard | Retail | To display the space occupancy status of a store. It is useful in covid-19 pandemic to control the number of people in store. |
| Staff Space Occupancy Dashboard | Retail | To showcase the live occupancy of a location and the hourly trend of the occupancy status. |
| Heat Map Analytic Report | Retail | Identifiable areas within the store can be viewed in terms of intensity to determine which area or products garners the most sales opportunities. |
| Product Engagement Report | Retail | A comprehensive report on the product engagement level by the visitors. This report enables the company to determine which products have more engagement but not able to convert into sales. |
7.3 Report Builder
7.3.1 Create New Report
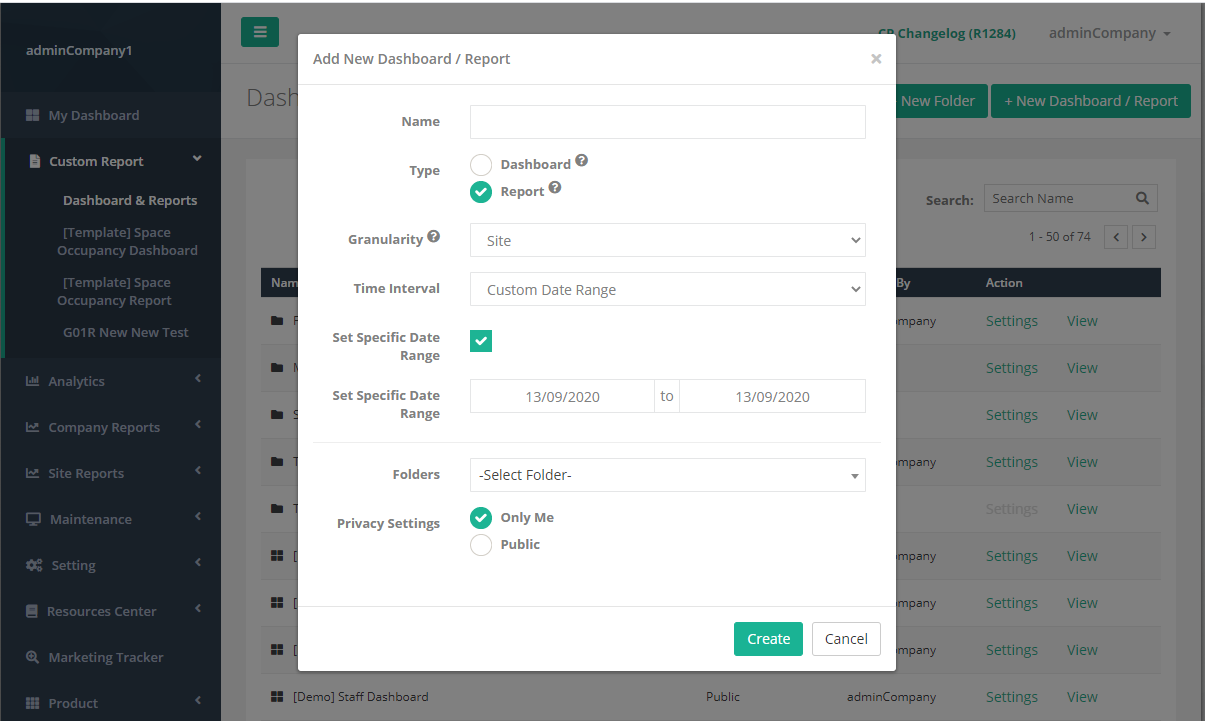
Name:
Users are required to enter a name for the report. (Maximum 40 characters)
Type:
Users are required to choose the type of the report. For the Dashboard, it is used to monitor real-time data (e.g. Live Space Occupancy, Live Visitor Count, etc.) while for the Report, it is used to analyze the historical data (e.g. Daily Visitor Count, Monthly Visitor Count, etc.).
Granularity:
The default granularity for report is Site. Granularity is used to determine the level of data aggregation in the report.
Time Interval:
For Report, the dropdown option will exclude the "Live" option. If "Custom Date Range" is selected, Set Specific Date Range checkbox will be shown. If the checkbox is selected, users are required to choose Start Date and End Date for the report, else if the checkbox is unselected, the Start Date and End Date will be reset to null. If "Based on Marketing Campaign" is selected, the granularity will be reset to "Site" and set as readonly.
Folders:
Users are required to select the report's location. If no folder is selected, the location of the report will be on the main page. If a folder is selected from the dropdown list, the new report will be located at the selected folder.
Privacy Settings:
If a folder is selected, the privacy settings will be overwritten with the selected folder's privacy settings and set the field as readonly, else if no folder is selected, users are able to select the privacy settings of the new report.
If the role of the login user is User (not Admin), the user is not allowed to create a new report and the report creation button is hidden.
Custom Reports User Access
| User Role | User Access |
| Admin | Able to view all Reports and all Dashboards which create under the Company |
| User | Able to view all Reports and Dashboards which the Site can be accessed by the login user |
7.3.2 Report Configuration
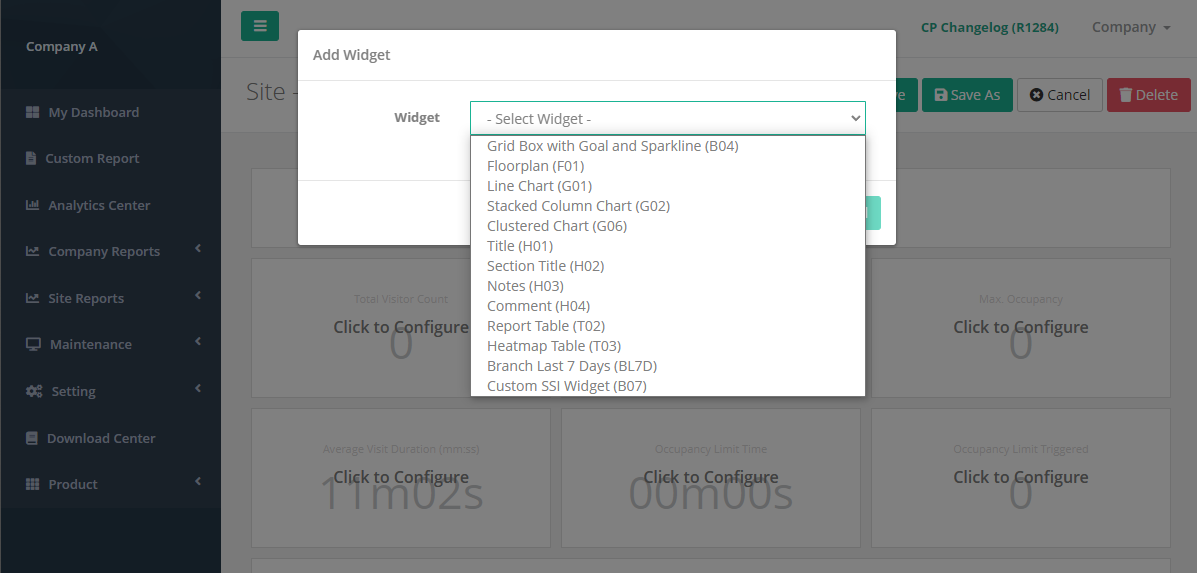
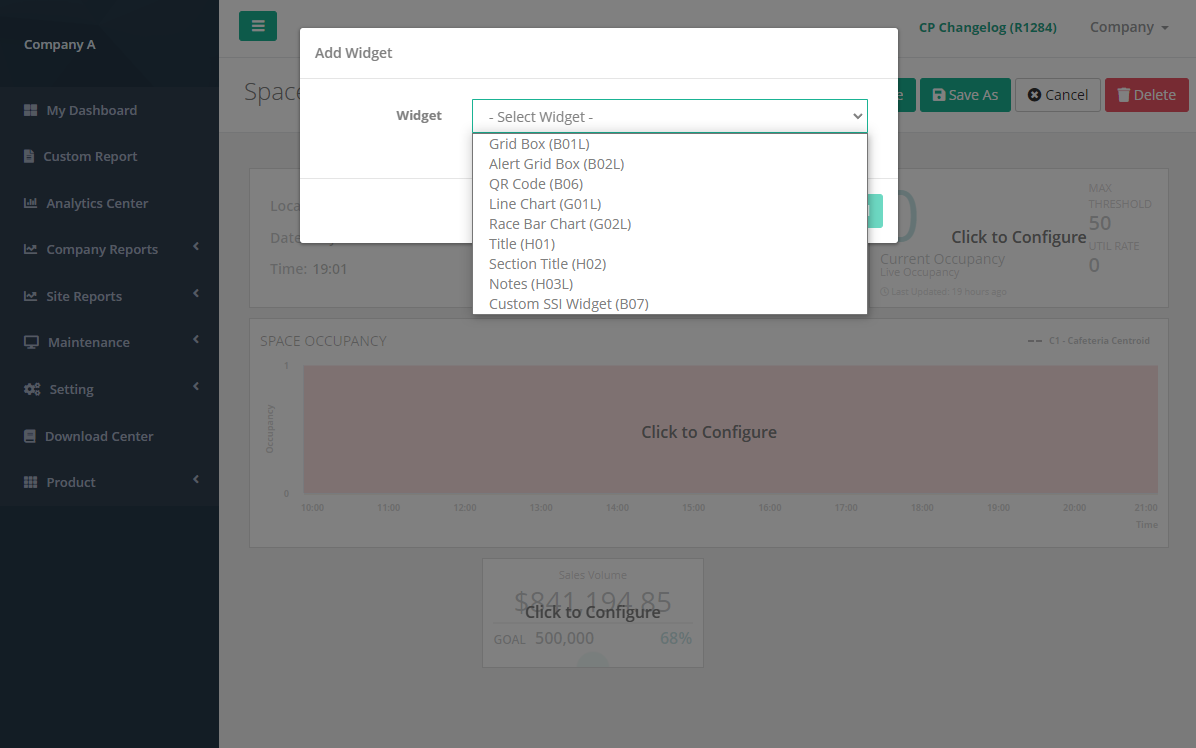
Users are able to select widgets for the report from the list of widgets by clicking the "Add Widget" button.
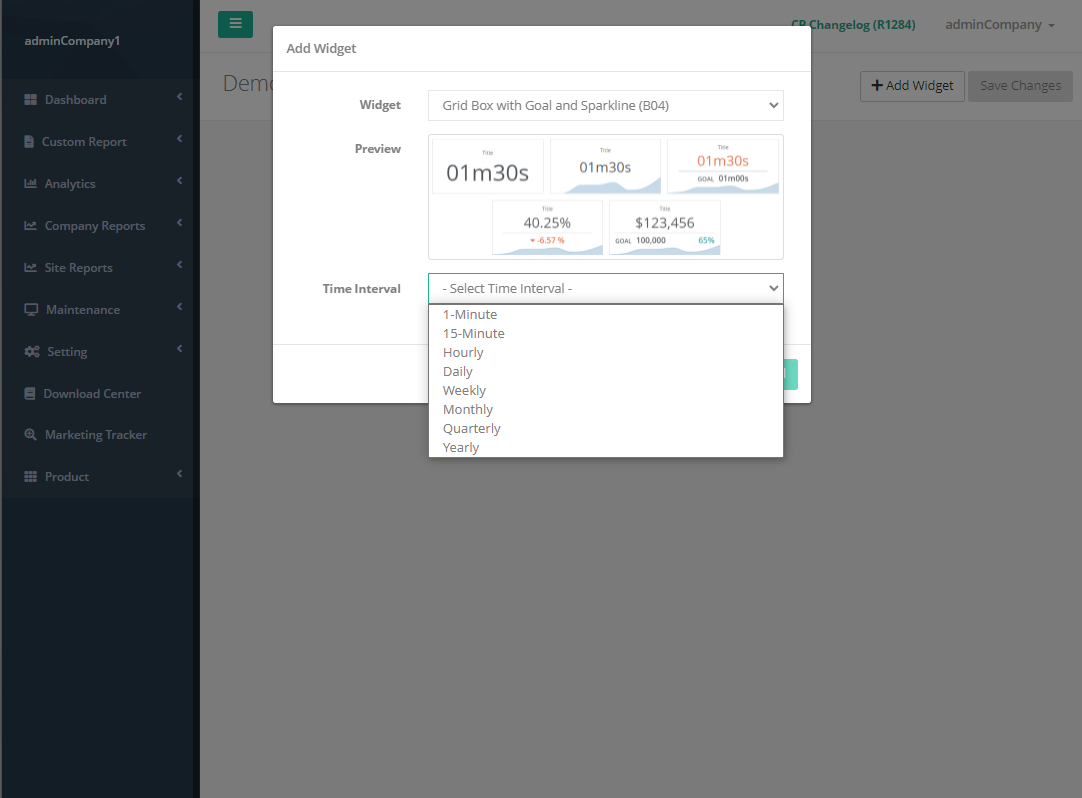
The following widget are require select the time interval:
- Grid Box with Goal and Sparkline (B04)
- Line Chart (G01)
- Stacked Column Chart (G02)
- Report Table (T02)
- Heatmap Table (T03)
The selected time interval will determine the default filter time range and time interval for the widgets above.
7.3.2.1 Custom Report Type - Report
7.3.2.1.1 Box Widget
A) B04 - Grid Box with Goal and Sparkline
-
Used to display the summary data for the metric selected which contains metric information such as goal and data trendline.
- For configuration part, please refer to Custom Report Builder - B04 Grid Box Widget
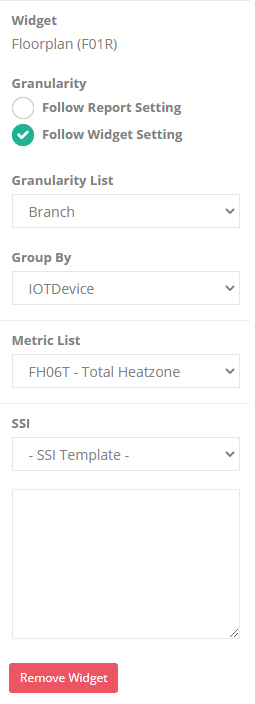
7.3.2.1.2 Floorplan Widget
A) F01R - Floorplan
-
Used to visualize the custom data constitutes a floor plan
Configuration
 |
*Required field |
7.3.2.1.3 Graph Widget
A) G01 - Line Chart
-
Used to view a series of data points with a continuous line
- For configuration part, please refer to Custom Report Builder - G01 Line Graph Widget
B) G02 - Stacked Column Chart
-
Used to visualize data that accumulated a sum. The chart showing data labels for each individual section of stack
- For configuration part, please refer to Custom Report Builder - G02 Bar Chart Widget
D) G06R - Clustered Chart
-
Used to show a combination of a column and a line chart, using multiple y-axes. Using multiple axes allows for data with different ranges to be visualized together
Configuration
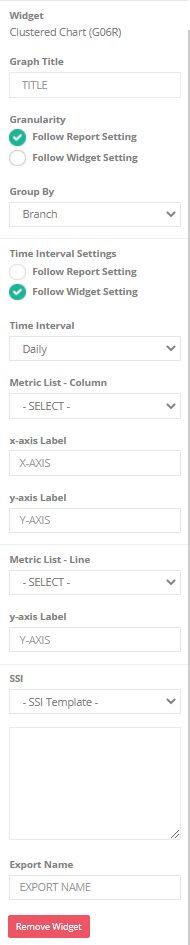 |
*Required field |
7.3.2.1.4 Header Widget
A) H01 - Title
-
Used to indicate the usage of the report which contains general and basic information such as topic, company name, site name and current timestamp for selected date range of report.
Configuration
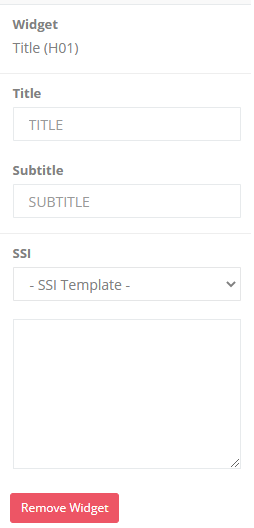 |
|
B) H02 - Section Title
-
Used to indicate the usage of the report which contains general and basic information. Consist of tooltips.
Configuration
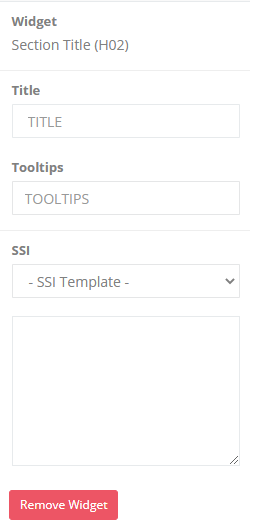 |
|
C) H03R - Notes
-
Used to record down the notes or extra information for the report.
Configuration
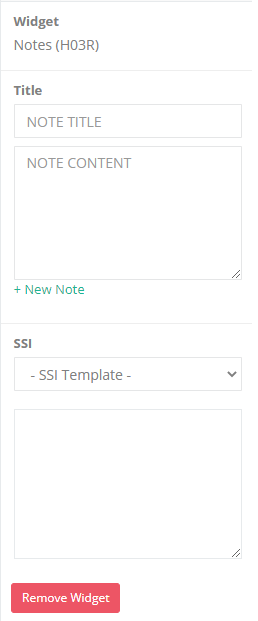 |
|
D) H04 - Comment
-
Used to add a personal comment or start a conversation about a report with your colleagues
Configuration
[Only applied on View Mode] Click "Edit" to write a comment, "Save" to save the new comment in the same report, "Save As" to make a new copy of the report with the latest comment.
7.3.2.1.5 Table Widget
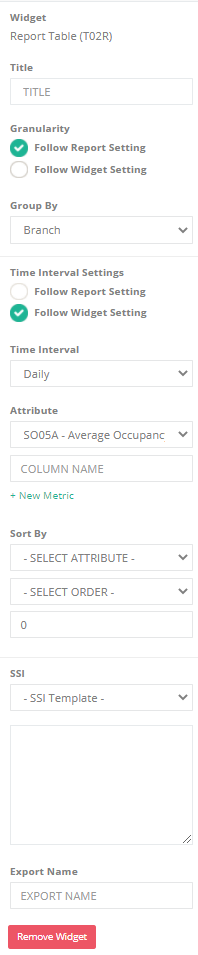
A) T02R - Report Table
-
Used to display summary data in table format to have better visualization
- For configuration part, please refer to Custom Report Builder - T02 Table Widget
Configuration
 |
*Required field |
B) T03R - Heatmap Table
-
Used to visualize hot spots within data sets and to show patterns or correlations
- For configuration part, please refer to Custom Report Builder - T03 Heatmap Table Widget
7.3.2.2 Custom Report Type - Dashboard
7.3.2.2.1 Box Widget
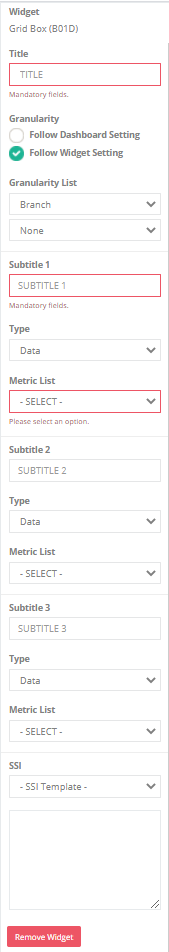
A) B01D - Grid Box
-
Used to indicate the summary data of the metric selected.
Configuration
 |
*Required field |
B) B04R - Grid Box with Goal and Sparkline
Refer to 7.3.2.1.1 Box Widget (A)
C) B05D - Alert Grid Box
-
Used to display the summary data for the metric selected with action plan
Configuration
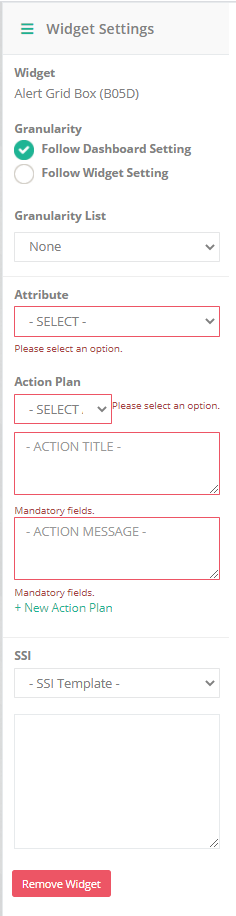 |
*Required field |
C) B06D - QR Code
-
Mainly used for manual occupancy page redirection
Configuration
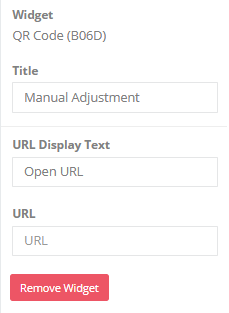 |
*Required field |
7.3.2.2.2 Graph Widget
A) G01D - Line Chart
-
Used to used to view a series of live data points with a continuous line.
Configuration
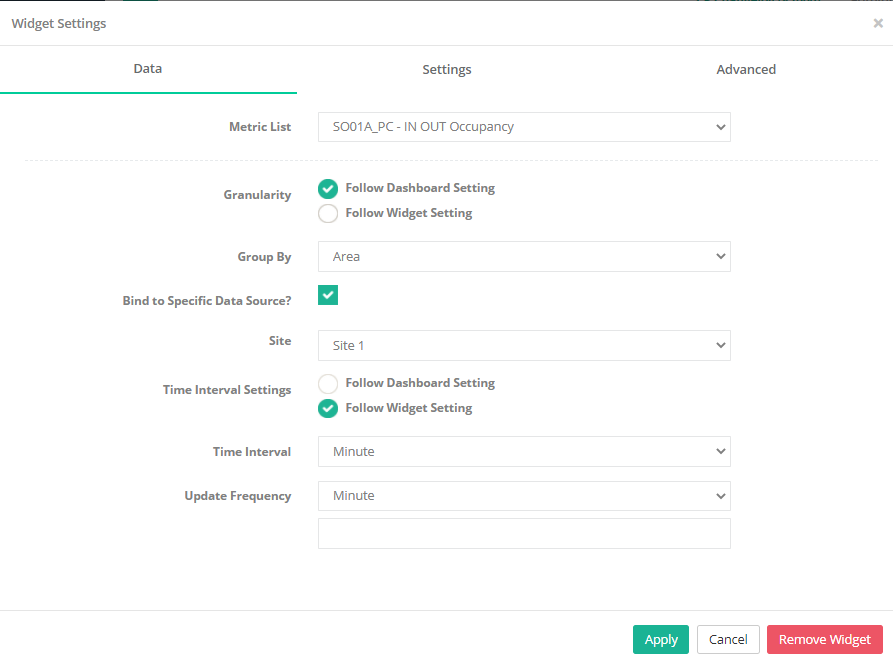
| Metric List* | Select metric for data visualization |
| Granularity* |
Follow Report Setting: (Default) This widget granularity will follow to the granularity chosen on dashboard creation . Follow Widget Setting: Users can customize the granularity by selecting the granularity from the Granularity list without following the dashboard granularity during dashboard creation. |
| Group By* | Grouped data follow the selected groupby value |
| Bind to Specific Data Source? | If ticked, this widget data is binded to a data source (e.g Site / Area). If untick, users are able to view the data of any sites / areas by selecting the selector from Right Side Bar in View Mode. |
| Time Interval Settings* |
Follow Report Setting: This widget time interval will follow to the time interval chosen on dashboard creation. (Currently is not applied) Follow Widget Setting: (Default) Users can customize the time interval by selecting the time interval without following the dashboard time interval during dashboard creation. |
| Update Frequency* | The update frequency number of the graph |
*Required field
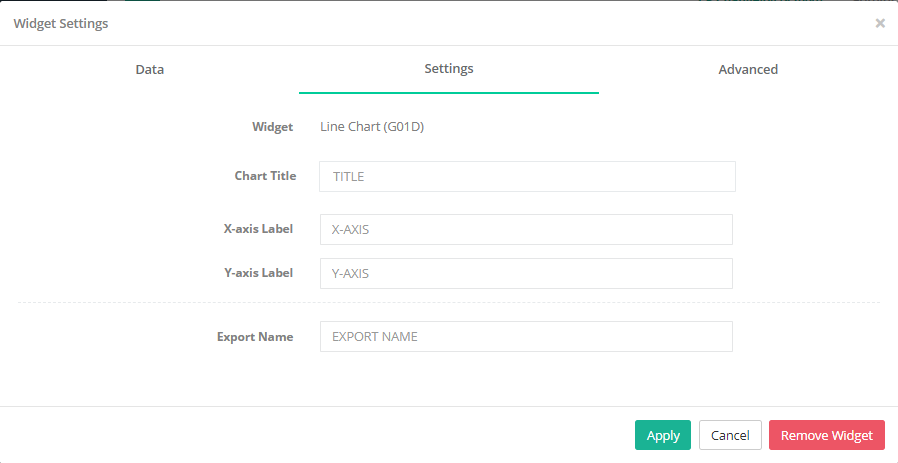
| Chart Title* |
Title for the chart. (Maximum 30 characters) |
| X-axis Label |
Display text for x-axis |
| Y-axis Label |
Display text for y-axis |
| Export Name* |
Export name of the widget for the export function. |
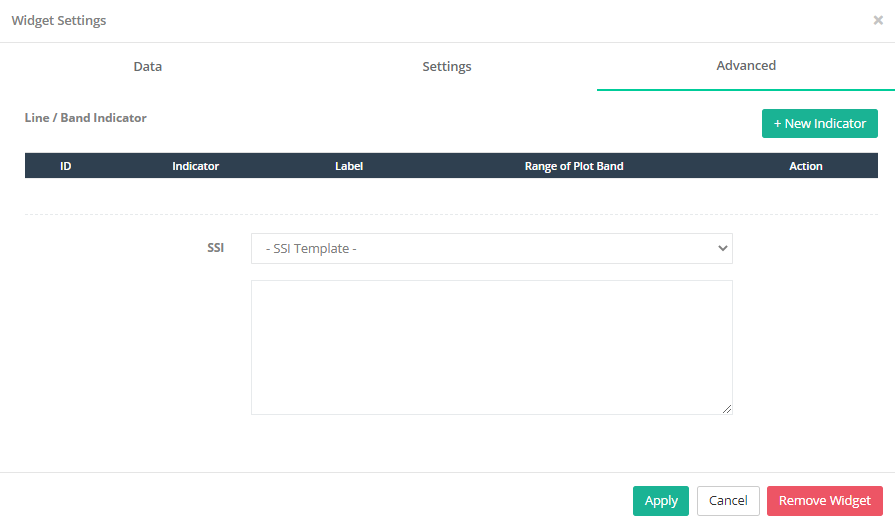
If there is no custom indicator for line or band, the line chart plot band and plot line will follow the default threshold and color.
Add New Indicator
Create New Line Indicator
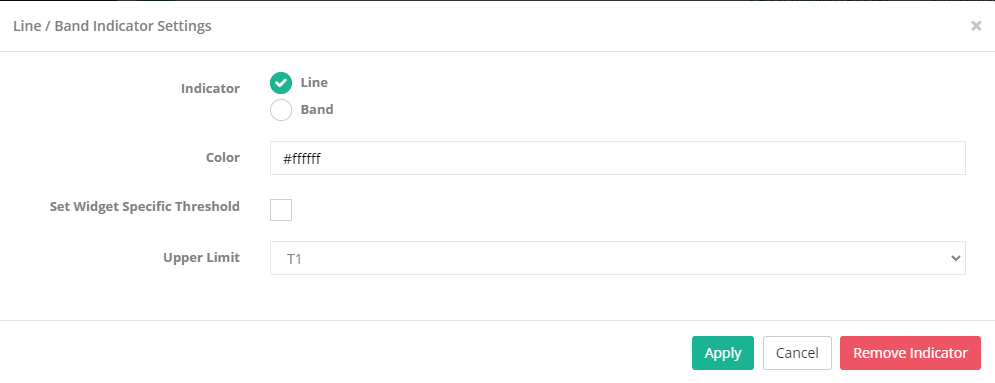
| Color | Set color for the plot line |
| Set Widget Specific Threshold | If ticked, the metric threshold value will follow according to the value set by user, else by default will follow the metric threshold value according to the granularity of the widget |
| Upper Limit | Dropdown list for the metric threshold value. If Set Widget Specific Threshold is ticked, the dropdown list will change to text field which allow user to key in the self-defined threshold value |
Create New Band Indicator
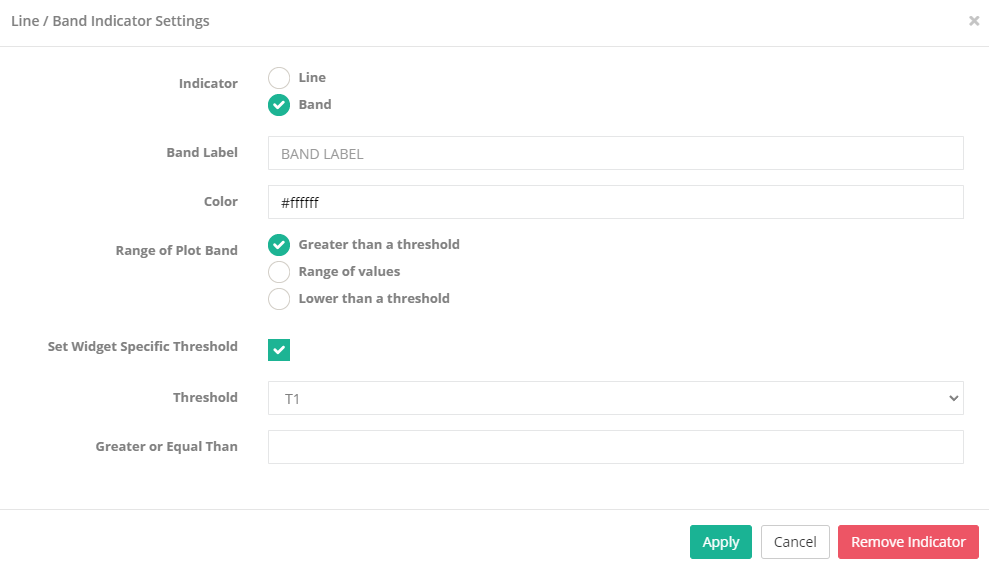
| Band Label* | Label text for the plot band | ||||||
| Color* |
Set color for the plot band |
||||||
| Range of Plot Band* |
|
||||||
| Set Widget Specific Threshold | If ticked, the metric threshold value will follow according to the value set by user, else by default will follow the metric threshold value according to the granularity of the widget |
Threshold MUST be created to ensure the available threshold option. For more information on Create Metric Threshold, please refer to 15.5.2 Metric Threshold. User can update the widget level threshold value by select the options.
B) G08D - Race Bar Chart
-
Used to visualize the trend over time which provides holistic data story / insight in a concise and easy to understand chart.
Configuration
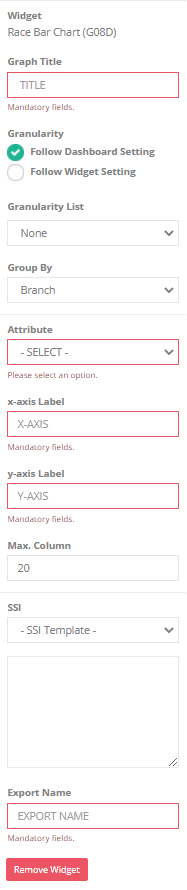 |
*Required field |
7.3.2.2.3 Header Widget
Refer to 7.3.2.1.4 Header Widget.
After done adding and configuring the widgets, click "Save Changes" to save the new created report.